CiAgICA8IS0tIExpbmtlZEluIC0tPgogICAgPHNjcmlwdCB0eXBlPSJ0ZXh0L2phdmFzY3JpcHQiPgogICAgICAgIF9saW5rZWRpbl9wYXJ0bmVyX2lkID0gIjEyMzUwNzMiOwogICAgICAgIHdpbmRvdy5fbGlua2VkaW5fZGF0YV9wYXJ0bmVyX2lkcyA9IHdpbmRvdy5fbGlua2VkaW5fZGF0YV9wYXJ0bmVyX2lkcyB8fCBbXTsKICAgICAgICB3aW5kb3cuX2xpbmtlZGluX2RhdGFfcGFydG5lcl9pZHMucHVzaChfbGlua2VkaW5fcGFydG5lcl9pZCk7CiAgICA8L3NjcmlwdD48c2NyaXB0IHR5cGU9InRleHQvamF2YXNjcmlwdCI+CiAgICAgICAgKGZ1bmN0aW9uKCl7dmFyIHMgPSBkb2N1bWVudC5nZXRFbGVtZW50c0J5VGFnTmFtZSgic2NyaXB0IilbMF07CiAgICAgICAgICAgIHZhciBiID0gZG9jdW1lbnQuY3JlYXRlRWxlbWVudCgic2NyaXB0Iik7CiAgICAgICAgICAgIGIudHlwZSA9ICJ0ZXh0L2phdmFzY3JpcHQiO2IuYXN5bmMgPSB0cnVlOwogICAgICAgICAgICBiLnNyYyA9ICJodHRwczovL3NuYXAubGljZG4uY29tL2xpLmxtcy1hbmFseXRpY3MvaW5zaWdodC5taW4uanMiOwogICAgICAgICAgICBzLnBhcmVudE5vZGUuaW5zZXJ0QmVmb3JlKGIsIHMpO30pKCk7CiAgICA8L3NjcmlwdD4KICAgIDxub3NjcmlwdD4KICAgICAgICA8aW1nIGhlaWdodD0iMSIgd2lkdGg9IjEiIHN0eWxlPSJkaXNwbGF5Om5vbmU7IiBhbHQ9IiIgc3JjPSJodHRwczovL3B4LmFkcy5saW5rZWRpbi5jb20vY29sbGVjdC8/cGlkPTEyMzUwNzMmZm10PWdpZiIgLz4KICAgIDwvbm9zY3JpcHQ+CiAgICA8IS0tIEVuZCBMaW5rZWRJbiAtLT4KICAgIA==
Generic filters
Exact matches only
Search in title
Search in excerpt
Search in content

Flutter is mutter

Here is what I always wanted to address: Where do you place the description of the bars in a bar chart? Before the bars? Behind the bars? Next to the bars? Underneath the bars? Above the bars? Have a look.

Der Wert der Banken: Marktkapitalisierung in Milliarden Euro, in Klammern prozentuale Veränderung zwischen 1.2.2009 und 1.2.2010. Quelle: Die Zeit, 04.02.2010, Seite 19.Pro-Kopf-Ausgaben für die Verbraucherzentralen in den Bundesländern, in Cent. Quelle: FAZ, 19.07.2009, Seite 35.
Source: “Die Zeit”, 2010-02-04, page 19; “FAZ”, 2009-07-19, page 35.

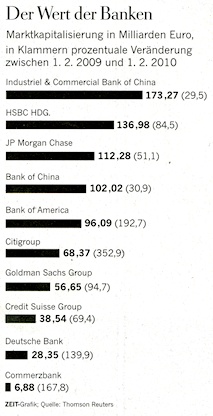
In the newspaper “Die Zeit”: Names above. Numbers next to it, on the right, fluttering. Clever: no problem with long names. The whole amount of space is reserved for the bars. Less clever: the distance between the bars. The more of it, the less of the graphic. Not so clever: the numbers stretch the bars.

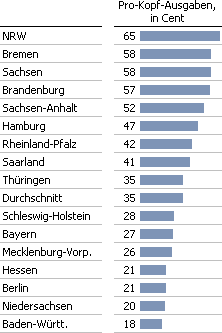
In the newspaper “FAZ”: Names in front of it. Numbers within, on the right within. Clever: average included. Less clever: reading the length of the bar and the number at the same time. This is what you might think. But it is not like that. Graphic and number mingle together. Difficult for the brain. You can learn it, if you see it more often. Important: pixelate exactly. The numbers are not placed accurately. And therefore are fluttering twice.

Have a look. I have drawn it as always. Always works. Things are clear. Every thing has its own place. Numbers as well as graphics.
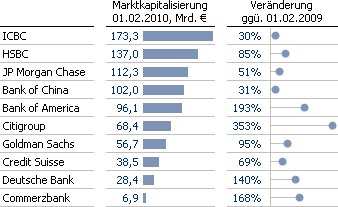
Grafische Tabelle: Marktkapitalisierung von Banken in Milliarden Euro, in Klammern prozentuale Veränderung zwischen 1.2.2009 und 1.2.2010.Grafische Tabelle: Pro-Kopf-Ausgaben für die Verbraucherzentralen in den Bundesländern, in Cent.
Redesign: me.