![]()
Greeting, fellow data analysts!
In a good restaurant, you expect the waiter to subtly mention if certain menu items are no longer available. That way, you won’t be disappointed if they don’t have what you want and your order won’t take longer than necessary. The restaurant could just cross out these items from the menu or daily specials sign – but that doesn’t look particularly good.
In multidimensional data models, you also have many different choices with respect to the direction in which you would like to take your analysis. DeltaMaster offers excellent services in this respect. Its hierarchy menus, for example, constantly adapt to the current starting positions and always show which angles you can explore next. This quickly leads you to your goal – analyses that clearly explain what you have to do to steer your company effectively. Not to mention, its hierarchy menus look impressive as well – whether you are using their default settings or you have customized them to the individual application. This edition of clicks! is filled with many tips to spice up these menus.
Best regards,
Your Bissantz & Company Team
You probably have seen the hierarchy menus of DeltaMaster quite often. You can find them anywhere you need to choose a hierarchy level. For example:
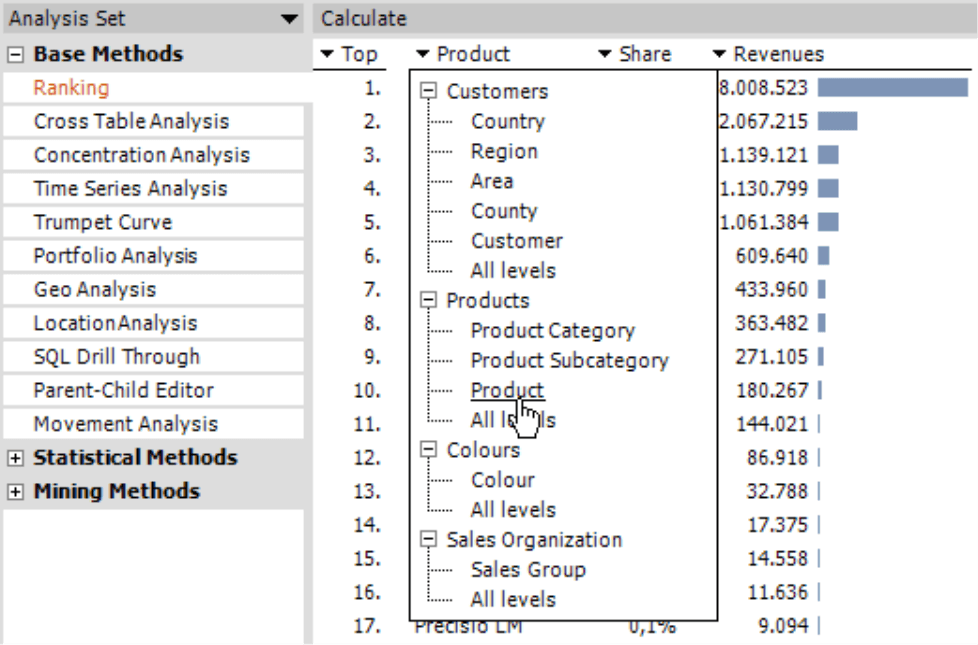
- Should you create a Ranking for revenues by product categories, subcategories, or individual products?
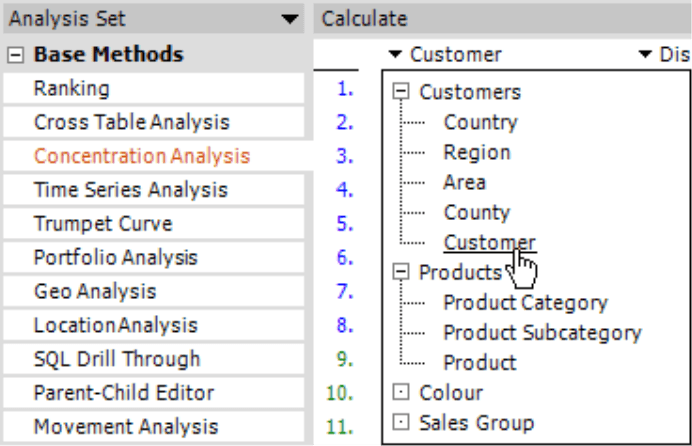
- Should you create a Concentration analysis by customers, regions, or entire countries?
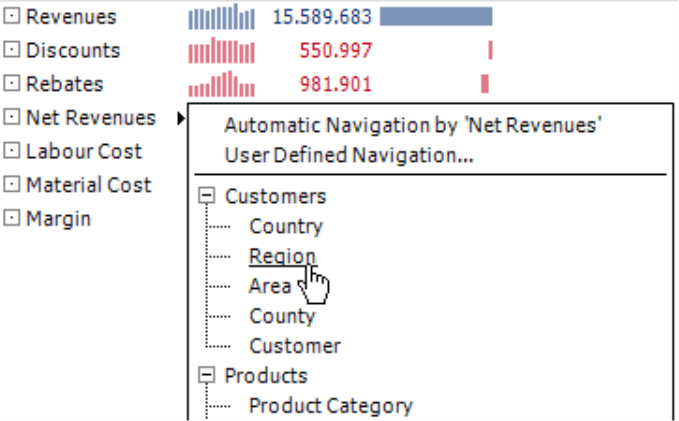
- In which dimension level should the Pivot navigation branch off next?
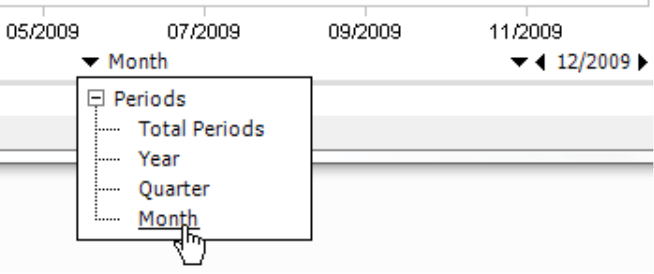
- Do you want to examine the budget-actual variances on a monthly, quarterly, or yearly basis? (In a Time series analysis or Trumpet analysis, DeltaMaster only displays an abbreviated form of the hierarchy menu because it only shows the time dimension.)
DeltaMaster provides hierarchy menus for these and many other scenarios in which you have to decide what you would like to select next. They work identically in all analysis methods, reports, and cockpits. If you are conducting an interactive analysis in Analyzer und Miner, you work almost constantly with these menus. That’s reason enough to take a closer look at exactly how these menus work and what presentation options they offer.
The view influences the hierarchies in the menu
Which hierarchies the menu contains depends on different factors: the current View, the respective measure, its Analysis context, and the Model context.
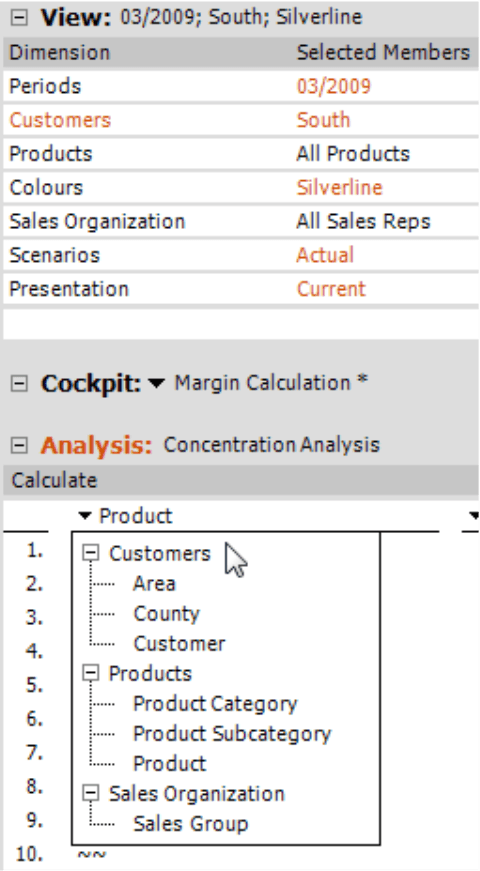
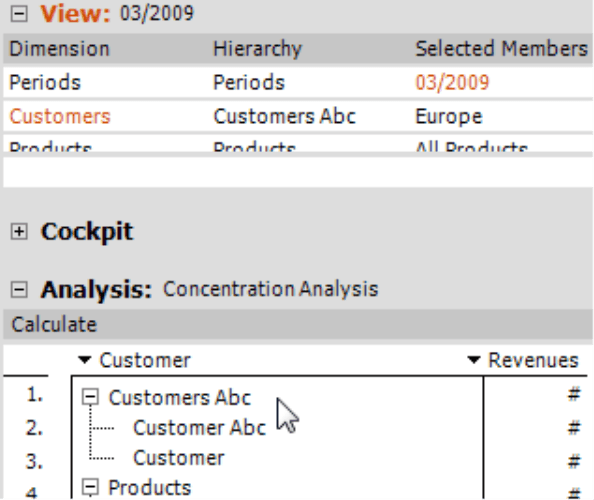
The screenshot on your right shows a Concentration analysis in Miner mode. This example clearly shows how the View affects the menu. Although the model contains seven dimensions (see View window), the hierarchy menu (see Analysis window) only contains three – namely, those dimensions in which no base member is selected in the View. As a result, you will not find the dimensions showing periods, colors, scenarios, or presentation types in the menu. In these four dimensions, the selected member is on the lowest level. In other words, you cannot differentiate this data any further and the hierarchy menu shrinks respectively. Due to this same principle, dimensions with flat hierarchies (i.e. not arranged in hierarchical relationships) will never appear in a hierarchy menu. ‘Scenarios’ (e.g. budget or actual), ‘Time utility’ (e.g. current or previous year), and ‘Currencies’ are typical dimensions with flat hierarchies. Since at least one base member is always selected in these dimensions, there is no possibility for a more detailed breakdown.
Measures and the model influence the hierarchies in the menu
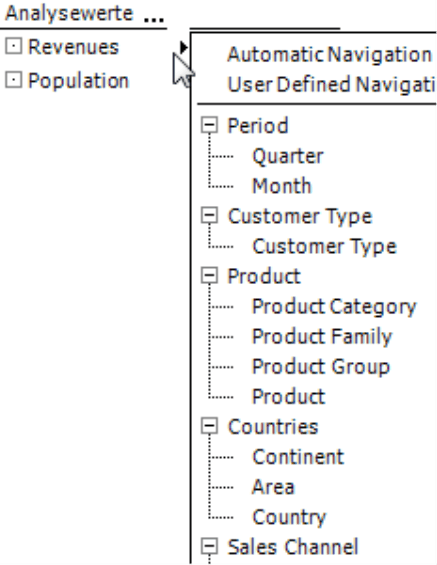
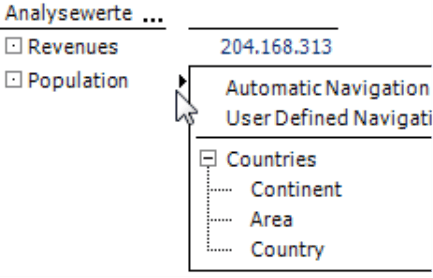
Besides the view, the given measure also has an influence on the menu’s content. As a result, the menu will only show hierarchies and levels that are linked with that measure. The screenshot on your right illustrates this very well by showing a Pivot navigation from our ‘BC Worldphone’ reference application. This demo connects internal sales data (e.g. revenues by customers, revenues by products, costs, margin) with geographic, demographic, and economic data (e.g. population, size, GDP) for the different countries of the world. While you can allocate internal data to individual countries, you cannot link the population to individual products. As a result, you can investigate revenues by countries, areas, continents, or internal structures such as customer types or products. However, you can only analyze the population based on a single criterion – countries, areas, or continents.
This also applies to analysis models that include multiple cubes.
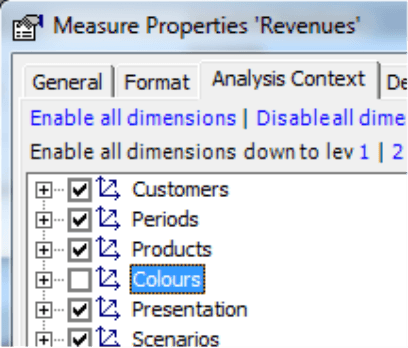
The items that you can select from the menu also depend on the analysis context of the respective measure (tab under Measure properties) and the model context (Model menu). The hierarchy menu only offers those hierarchies and levels that are activated for the measure or the entire model. In the screenshot on your right, for example, the ‘Colours’ dimension from the ‘Chair’ reference application is deactivated. As a result, this criterion will not appear in the hierarchy menu.
Parallel hierarchies
You can also decide how DeltaMaster should treat parallel hierarchies in your analysis models (Extras menu, Options, General tab).
![]()
If you Hide parallel hierarchies in hierarchy menus, DeltaMaster will only show one hierarchy per dimension – namely, the one that is selected in the View window. In the screenshot on your right, this is the customer dimension, which was used to create a concentration analysis. If you save this as a virtual hierarchy, you can reuse this classification for other analyses. If you hide the parallel hierarchies, the menu will either show the original hierarchy from the database if it is selected in the view, or the virtual hierarchy ‘Customer Abc’ if it is active. This setting is very useful when the analysis model contains several parallel hierarchies, which would make the hierarchy menu very long and difficult to read. DeltaMaster also has special options to ‘compress’ the hierarchy menu – more on that later.
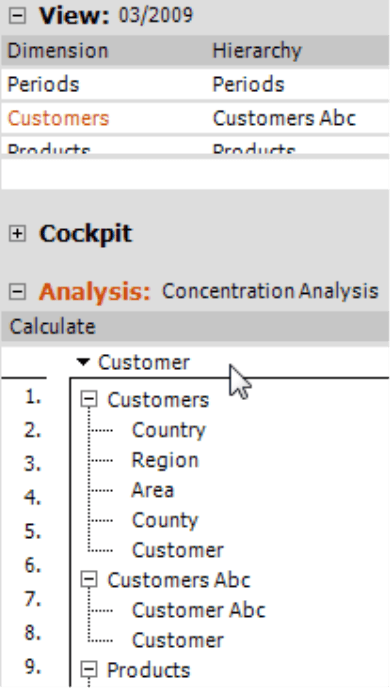
If you choose not to Hide these hierarchies in the Options, DeltaMaster will offer all of the available parallel hierarchies – provided that the (common) ‘All’ member is selected for the respective dimensions in the View window. If you have already selected a more specific member, DeltaMaster will not show the parallel hierarchies in this dimension.
You can analyze your data more quickly and flexibly if parallel hierarchies are directly accessible. For instance, you can select another classification (i.e. another direction to take your analysis) in the Analysis window without having to switch to the View window. More hierarchies, however, make the menu larger.
Levels in the menu
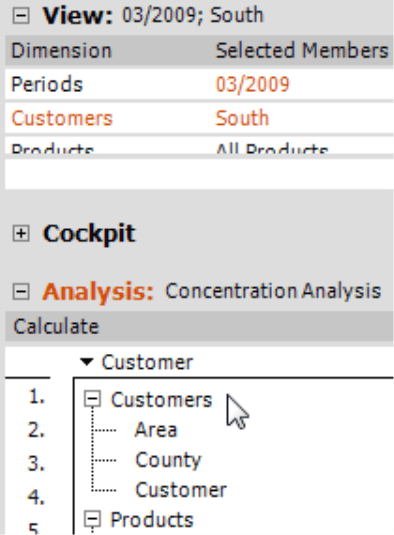
In the menu, DeltaMaster offers all levels in which the user can create a further differentiation from the current View. This is the reason why the screenshot on your right only shows the levels ‘Area’, ‘County’, and ‘Customer’ in the customer dimension. These are the only levels below the currently selection region ‘South’. The hierarchy menu no longer shows the levels ‘Country’ and ‘Region’ that were still visible in the first screenshot on page 2 because they have since been defined in the member selection. If you select multiple objects on a level, the hierarchy menu will still show this level because you can differentiate these members against each other in your analysis. If you have selected members from different levels in your View, this depends on the lowest level.
Saving space in hierarchy menus
DeltaMaster offers five different alternatives for the Display of hierarchy menus (Extras menu under Options on the General tab). With these options, you can usually visualize the menus in much more compact way, which makes the menus easier to read and improves the user experience because you no longer need to open a monstrous menu or scroll through long selection lists. The five display options are listed in the least to the most compact order.
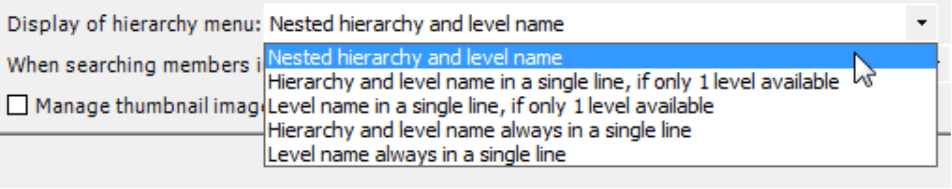
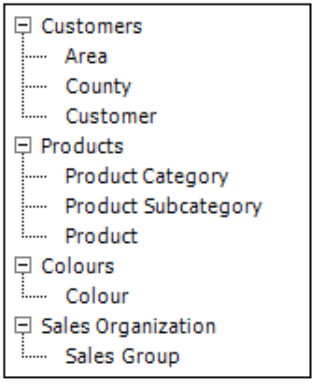
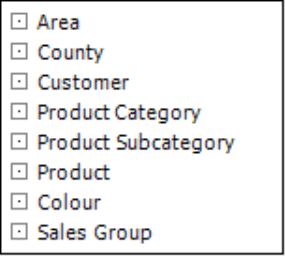
a) In the default setting, DeltaMaster shows the Nested hierarchy and level name. This means that it displays the name of the hierarchy followed by the available lists indented in a branch-like structure. As usual, you can expand or collapse the lists to show or hide the levels by clicking the plus or minus signs. In a new analysis, however, DeltaMaster always shows the lists in a completely expanded state.
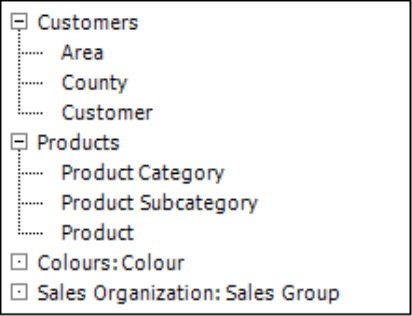
b) Hierarchy and level name in a single line, if only 1 level available: If you are working with hierarchies that only have a single level available for the analysis, DeltaMaster will list the name of the hierarchy followed by the name of the level in a row (‘Hierarchy: Level’) – instead of two separate rows. This will make your menu shorter but wider. In the screenshot on your right, ‘Colours’ and ‘Sales organization’ now only need two rows instead of four as in the one above. DeltaMaster will display hierarchies with multiple levels the same way as in option a) – in other words, with a plus or minus sign to expand or collapse the levels.
This option has no effect on analysis methods such as Ranking or PowerSearch in which you can work with either the individual levels or All levels of the data model. Through the additional menu entry ‘All levels’, each hierarchy has at least two levels. As a result, you will never see the one-row notation in these analysis methods.
c) Level in a single line, if only 1 level available: As in option b), if hierarchies only have one available level, DeltaMaster will only display the name of it on a level without the name of the hierarchy. This makes the display even more compact in width.
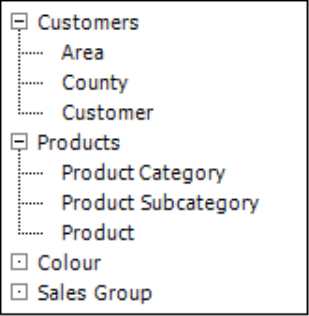
This presentation option is designed for a scenario that occurs frequently in day-to-day business. Many analysis models have dimensions that store a group of criteria without further hierarchal structures below an ‘All’ member. These include contract types, order status, shipping codes, priorities, ABC/XYZ classes, container types, package sizes, simple product options (e.g. ‘Colours’ in our ‘Chair’ reference application), record types, etc. This one level below the ‘top’ level often has a very similar name or even the same one as the hierarchy itself. If the name of the level clearly states to which hierarchy it belongs, you can spare yourself the redundancy in the menu. In our example, ‘Colours: Colours’ (‘Hierarchy: Level’) is simply ‘Colours’ (‘Level’) and ‘Sales organization: Sales group’ is just ‘Sales group’.
d) Hierarchy and level name always in a single line: In the options b) and c) described above, the hierarchy is visualized through an indentation and you can only save space when a single level is available for analysis. Options d) and e), however, don’t use an indentation. Since they don’t show plus or minus signs, their length is constant. These options, however, take effect when more than one level is available for analysis. As in option b), this option saves space because DeltaMaster lists the names of the hierarchy and the level in a single row (‘Hierarchy: Level’) instead of two.
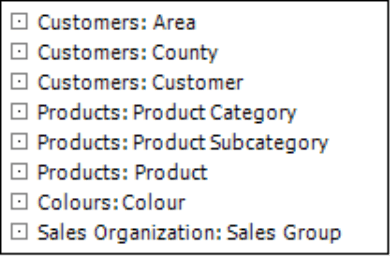
e) Level name always in a single line: This is the most compact menu form. As in option c), it only displays the level names without the hierarchy names.
You can see how much space the different options need when you observe the examples above side by side – which makes sense time and time again when you want to compare things.
| a) | 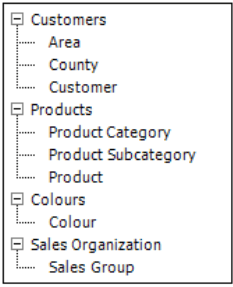 |
b) | 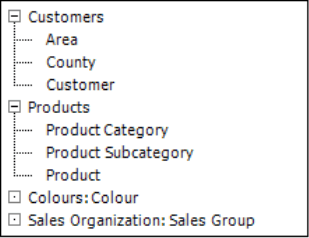 |
c) | 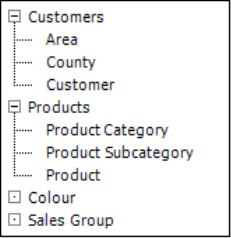 |
d) | 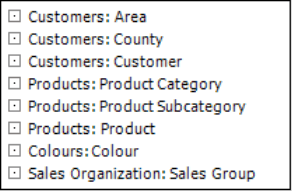 |
e) | 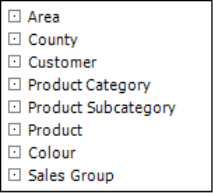 |
As you can see, you can use these simple switches in the Options to display your menus in a much clearer, more comfortable manner. The extremely compact option e), however, only makes sense when all levels have clear, self-explanatory names.
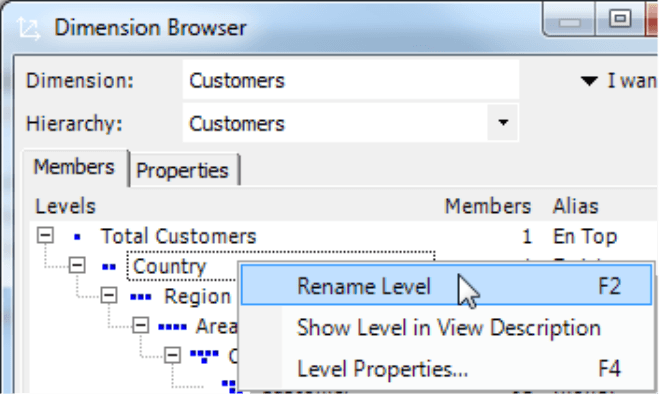
If necessary, you can also rename hierarchies and levels directly in DeltaMaster. This is especially important when dealing with parent-child hierarchies which are only numbered in the OLAP database and have names such as ‘Level 01’ or ‘Level 02’. These level names are unclear if the hierarchy is not listed alongside that level. In the Dimension browser (I want to… menu or context menu of levels), you can give these hierarchies and levels logical names. Careful naming and modeling make your application easier to understand and make the user interface much cleaner as well.
Questions? Comments?
Just contact your Bissantz team for more information.
