![]()
Greetings, fellow data analysts!
Working with maps in reporting isn’t always easy. They can often be deceiving because they seem to suggest that the largest geographical area is the most important one. If you only need to visualize the success of your company in Germany, France, Spain, and the UK, a better alternative would be to create a ranking as a data-dense table containing variances, changes, percentages, and so on. On the other hand, maps are fascinating and emotional – which is important so that management information can make an impact. Analytic maps are also a great help when there could be relationships between places and values, but you cannot assume that the geography – for example, of smaller regions or city districts – is known. What’s important is that the maps reflect your company’s own organizational structures, e.g. the sales organization. With DeltaMaster, you can set that up in just one dialog box.
Best regards,
Your Bissantz & Company team
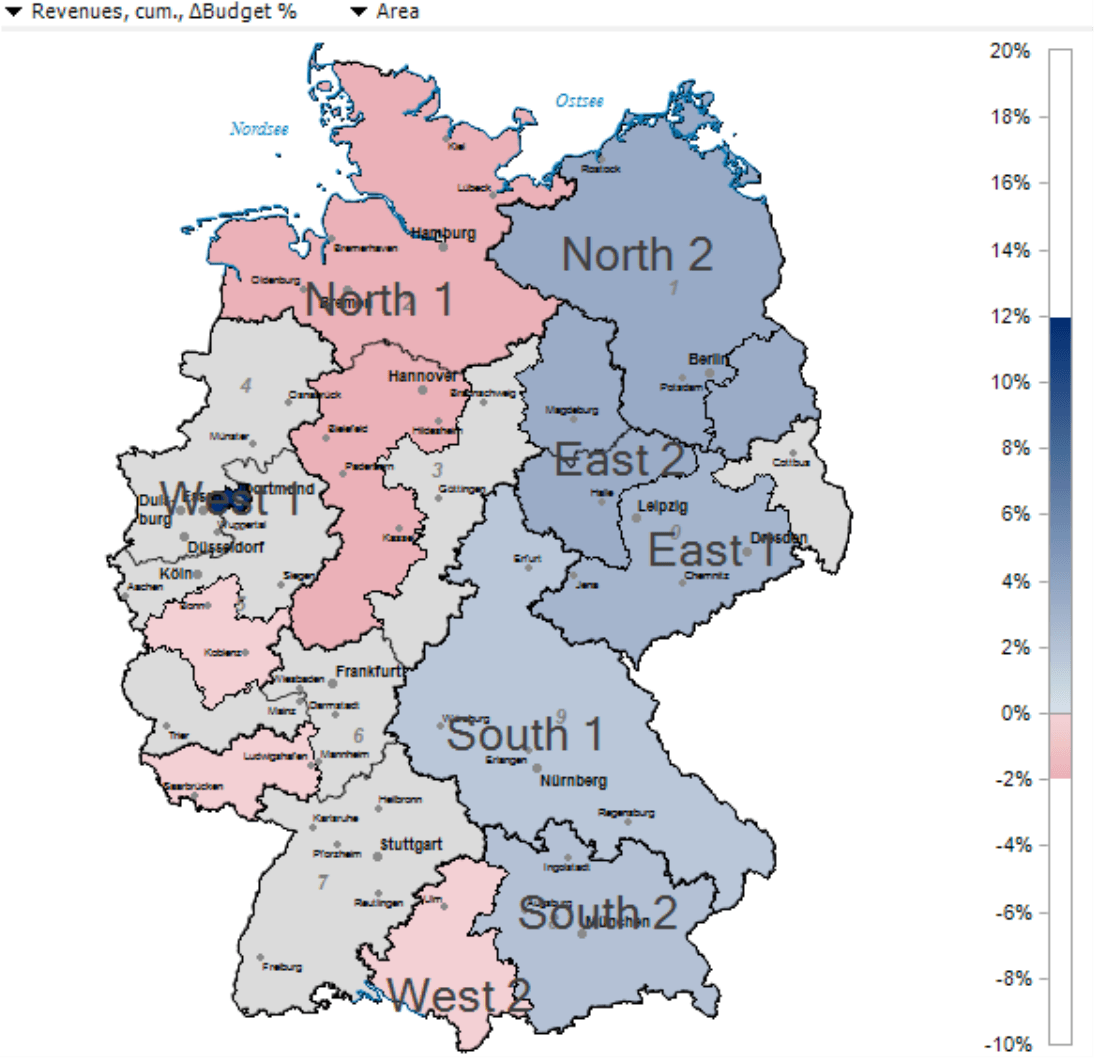
The Geo Analysis in DeltaMaster colors the areas of a map in accordance with the measure of your choice. This helps you quickly see which region generated the largest revenues or where positive or negative changes have taken place. One of the advantages of this module is that you can configure the map so that it assigns geographical areas to a specific organizational unit. That is important in aggregate analyses because companies rarely assign responsibilities for clients, patients, real estate objects, local branch offices, etc. purely based on political structures or postal code areas. Instead, they assign them according to specific requirements which, of course, should be included in the analysis. In the map on the right, for example, the regions are based on customized company rules – and not by states or postal areas.
In the following sections, we will explain how you can configure the Geo Analysis and define the relationships between geographical structures and those of your organization. As always in DeltaMaster, a report editor will need to make the initial configuration in Miner mode. Report consumers, however, can use the saved analysis in Reader, Viewer, Pivotizer, and Analyzer modes without needing to make any further changes. We will illustrate this example using our “Chair” reference model, which contains German postal codes in the customer dimension.
Initial settings
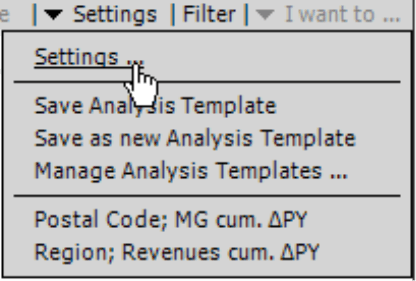
You configure the Geo Analysis in the Settings of this method (menu bar of the Analysis window) on the Mapping tab.
This dialog box is arranged in three sections:
- On the top, you can select which Dimension or hierarchy you wish to use for the Geo Analysis. If you activate the option Use Dimension for Geo Analysis for a dimension, DeltaMaster will display the corresponding mapping table in the dialog box below. You can even configure multiple dimensions for the Geo Analysis so that you can display alternative structures in the analysis model, for example, to represent the status before and after a corporate restructuring.

- In the center part of the dialog box, you can select the Map File. DeltaMaster will offer all maps (LTG files) that it finds in the folder for map files (as defined in the Options on the Folder tab; e.g. “C:Program FilesDeltaMaster 5.5.9Maps“). You may only use one map file for each dimension. For more information on maps, please read the final section of these instructions.
- In the bottom part of the dialog box, you can set up the mapping for the dimension or hierarchy selected above. We will explain how to use this table in the following section.
In the Settings, you can also define if DeltaMaster should display additional charts (e.g. column charts that illustrate the revenue breakdown by various groups of goods) in the map. This visualization is described in DeltaMaster clicks! 05/2005.
Reference and group
The table that links the dimension of the analysis model to the map has many functions. Although it may look a bit mysterious at first, it gives you high flexibility. So what do these five columns have to offer?
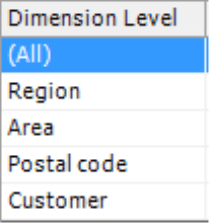
The first column lists all Dimension Levels of the dimension selected in the dialog box above – in this case, the levels of our customer dimension.
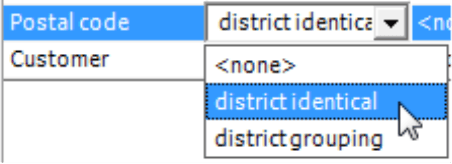
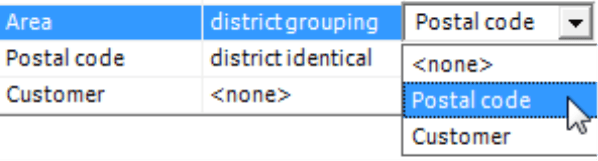
In the second column, you select the Reference Type for the respective level: district grouping or district identical. The selection in this field determines what you need to enter in the following three fields of each row.
- District identical means that the dimension level is identical to the Map Layer. The data model and map, therefore, are linked to each other on this level. Let’s say, for example, a dimension level contains five-digit or two-digit postal codes as the name of the dimension member or in the member properties (see below). You can assign this level to a specific one in the map by marking it as district identical.
The Grouping Level does not play a role in district identical levels. You must, however, define a Map Layer and Reference Element (see below).
- District grouping means that this level combines those of a lower dimension level. With this option, you can consolidate the regions in line with your organizational structure as described above. The members that are directly linked to the map will be grouped or aggregated according to the dimension structure. DeltaMaster will then use these aggregated values to determine how it should color the corresponding area. The aggregated values do not necessarily have to belong to the neighboring areas on the map.
You must define a Grouping Level for district grouping levels (see below). The Map Layer and Reference Element, however, are irrelevant.
- If you select “<none>” for the Reference Type, DeltaMaster will ignore the level.
In order for DeltaMaster to calculate the Geo Analysis, at least one level must be marked as district identical. In the Analysis or Report window, you can choose from all dimensions that are linked to a map including the district-identical and district-grouping levels.
The Grouping Level in the third column of the mapping table is only relevant for district grouping levels. Here, you can select the dimension level containing the members that you wish to combine. DeltaMaster only offers lower levels. In most cases, you would select a district identical level. All district grouping levels must be based on the same Grouping Level. The levels “Region” and “Area”, for example, could both refer to the level “Postal code” which, in turn, is linked 1:1 (i.e. district identical) with the map.
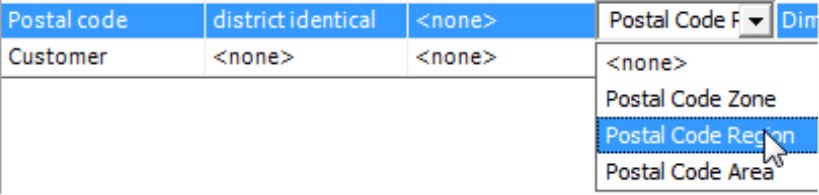
The Map Layer in the fourth column is only relevant for district identical levels. Here you can select the level of the map that should be linked to the dimension level of the analysis model – for example, five-digit postal codes of the customers with the postal code area as defined in the map or the first two digits of the postal code for a given management territory with the postal code region. DeltaMaster displays the map layers in the selection list based on their hierarchal order with the roughest level on the top and the most granular one on the bottom.
The Reference Element in the fifth column is also only relevant for district identical levels. Here you can define the term that is used to link the analysis model and map – either the name of the Dimension Member or a member property depending on how the postal codes (or other geographic keys; see last section) are saved in the analysis model.
![]()
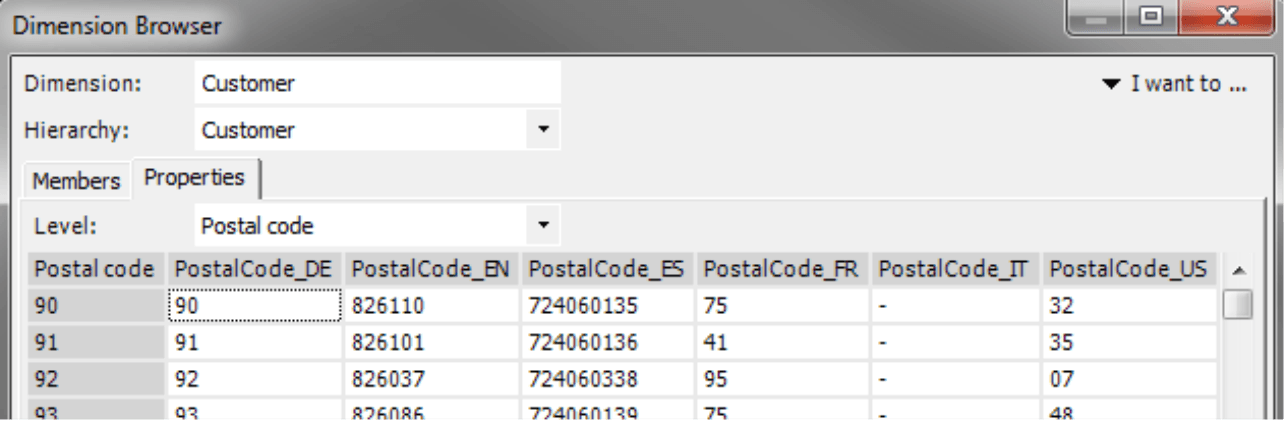
On the Properties tab in the Dimension Browser, you can check whether the Dimension Member itself or a member property returns the necessary information. In our example, both options are possible: the two-digit postal code is used as the name of the member (“Postal code” column) and is available as the member property “PostalCode_DE”. (The other properties displayed in the screenshot above are used in foreign language versions of the reference model.)
When you configure the Geo Analysis module, it is recommended to edit the Settings from the bottom to the top. In other words, start on the lowest (i.e. most granular) dimension level and work your way up to the first level that matches a map layer. You can mark this one as district identical. Afterwards, you can define the groupings.
Tip: With a double click, you can switch between the different options in all selection lists of this dialog box.
Avoiding a mosaic effect
Oftentimes in a Geo Analysis, the areas are not completely colored and are broken up by many small slivers so that the map looks like a mosaic. Although the result is correct, it is not always helpful because you can no longer recognize the relationship to the organizational structure. In fact, the gaps in the map are caused by gaps in the data. The database, for example, may not contain data for all postal code areas or all regions on the lowest map layer because you don’t have customers, patients, real estate objects, or branch offices everywhere. Our “Chair” reference model, for example, has a very small customer base. As a result, the map is so sparse that it looks as if nothing is colored at all. You only begin to see colored areas once you zoom in. District grouping on a higher level won’t change the presentation either because the aggregation is based on values and not the area.
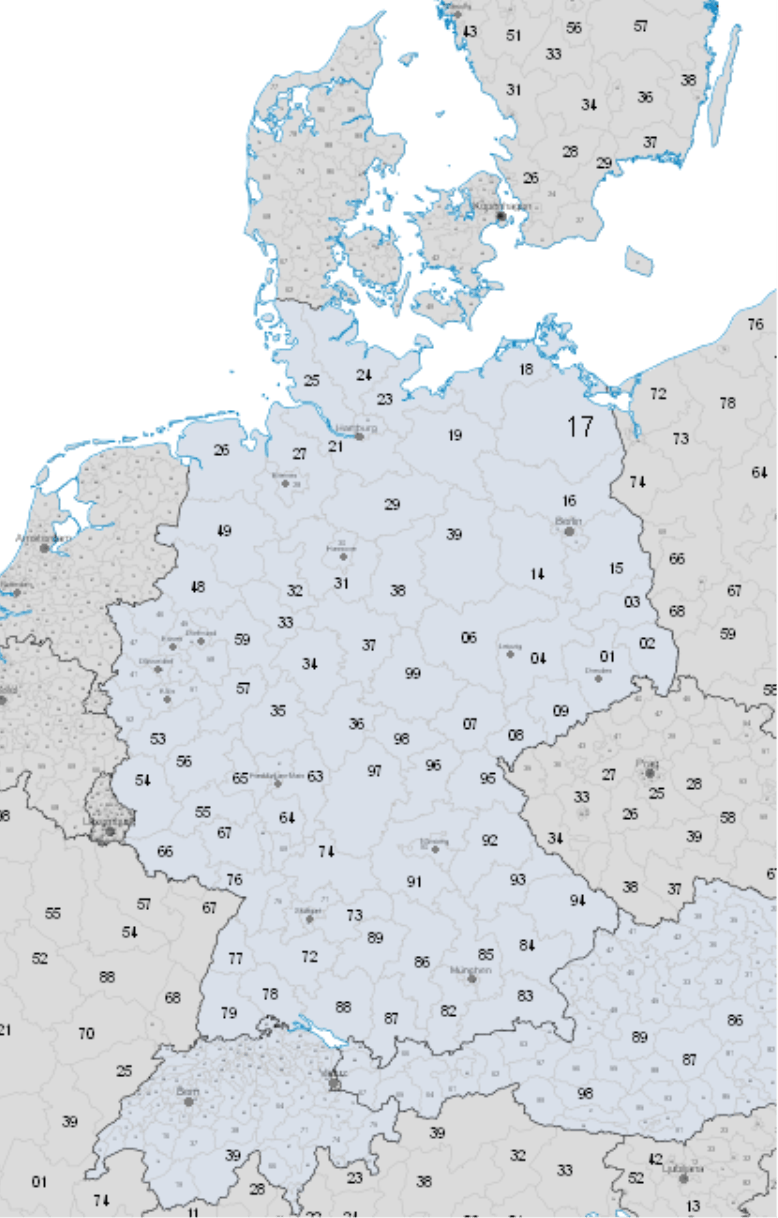
A good solution is to omit the lowest level with the individual postal code areas (i.e. five-digit postal codes) and to start one level higher with the postal code regions. In Germany, for example, there are 95 of them. That should provide adequate detail for most management tasks. (If you require more, the reason why is probably because you have more than enough data to start.) The “Chair” reference model contains postal code information on two levels: the lowest one (“Customer”, five digits) and second lowest one (“Postal code”, two digits). As a result, two district identical references are possible: “Customer” to the map layer “Postal code area” and “Postal code” to the map layer “Postal code region”. Since the first option has limited usage, we recommend that you do not offer it and start by assigning postal code regions.
Interpreting mapping errors
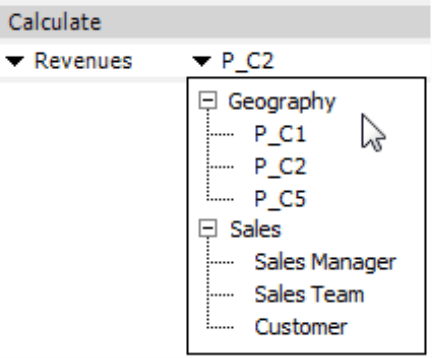
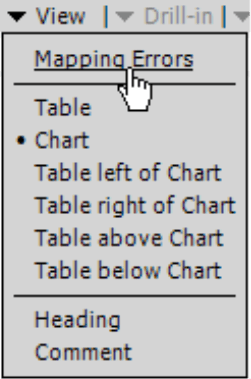
Once you have configured the Geo Analysis, click Calculate (link in the menu bar of the Analysis window). DeltaMaster will assign the members of the selected dimension to the areas on the map as defined in the Settings. When you do this, you may notice that not all of the dimension members are included in the map. In this case, you can open the Mapping Errors in the respective entry of the View menu. DeltaMaster will also display the number of mapping errors in the status bar of the report.
If you have many mapping errors (in particular, as many errors as members), this is a sign that you have not entered the mapping correctly. In this case, open the Settings and check if the Reference Element is configured correctly (e.g. so that the member property is set for the postal codes).
Some mapping errors are errors by nature. The postal code system in Germany, for example, is not designed so that all private codes of large organizations (e.g. shipping houses and government agencies) can be translated into geographic delivery postal codes. In many cases, you can still use mapping – but in a relational database and not in DeltaMaster or an OLAP cube. If you need support with these types of mappings, please contact your account manager for more information.
Changes in postal codes can also be a reason behind mapping errors. Every so often, some postal codes are cancelled due to the restructuring or consolidation of different areas. For this reason, we offer updated map files in longer intervals. Notifications of map updates are published in DeltaMaster deltas!.
Of course, there are also real errors due to missing or incorrect postal codes. The German postal code 99999 is one example. The largest German postal code is 99998 (for Weinbergen in Thüringen, approximately 50 km northwest of Erfurt).
Other countries, other maps
The Geo Analysis offers maps for multiple continents, countries, and industries where a specific geographic system has emerged as a standard such as IMS landscape or RPI cells from Insight Health for the pharmaceutical sector. Maps with application-specific allocations such as Nielsen areas in market research or the municipality keys of the German Federal Statistics Office (i.e. “KGS5“, with states, administrative districts, and counties) are also available.
DeltaMaster always uses numerical keys for mapping dimension members to areas of the map. As a result, you can immediately use German postal codes in a Geo Analysis if they are saved as the name of dimension member or a member property. On the global map, the countries are numerically coded in line with ISO 3166. In the map “Europe with Postal Code Regions” as shown on your right, the keys are comprised of the same numerical ISO codes as well as the first digits of the postal code.
For many maps, we can provide you with code lists so that you can compare and prepare your master data. We can also produce specific maps for your company’s specific requirements, for example, a floor map of a production plant or retail space. If you are interested, please contact your account manager for more information.
