With the help of statistics we seek clarity, uniqueness, profound boundaries and, ultimately, decisiveness. The world around us, however, is multicausal, continuous and ambiguous – anything but straightforward. Statistical measures, such as averages or medians, deliver values that are tempting to believe as true. They are, however, no more than an abridged description and characterization of a series of values. The underlying numbers – and not the statistics themselves – are the true reality.
No one has described this phenomenon more powerfully than Stephen Jay Gould, who was diagnosed with abdominal cancer in the 1980’s. When confronted with the statement that the median life expectancy for this diagnosis was eight months, he applied an understanding of numbers that marked his entire research. He observed the entire range of data.
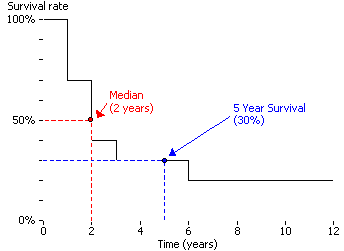
Example of a survival curve
The lopsided life expectancy statistics showed him that a very small fraction of patients lived significantly longer than eight months. New treatment methods and his otherwise optimistic demeanor gave him the power to envision his life expectancy well beyond that of the median.
In fact, Gould died twenty years later on May 20, 2002 in New York – from lung cancer.
What can we data analysts learn from this story? Don’t be deceived by aggregated values. View the distribution of all numbers instead. All too often, trend lines are used to summarize chaotic clouds of points. Outliers distort averages. Significance tests often replace one’s own ability to make judgment calls.
Bella has some additional thoughts on this topic and shows how distributions can be displayed in word-size format.
