Power BI: enhanced
with Bissantz tools
Your upgrade for more effective analyses and comprehensive planning: With DeltaMaster, you can start exactly where Power BI reaches its limits.
short implementation times
AI-based automation
business logic
mobile reporting
award-winning support


Power BI – better with Bissantz tools
Reporting, analysis and planning in one front end – faster, more automated and more effective
With Power BI, Microsoft has created a basic tool for business intelligence tasks that many data analysts and controllers know. Power BI users can merge, analyze and visualize data from various sources and create dashboards and reports manually. This can be achieved faster, better and, above all, in a more automated way: with seamlessly compatible Power BI tools by Bissantz.
Bissantz reads data from Power BI, provides guidance in building reports and systematically navigates users through business analyses. The software is more than just a BI tool: it is a comprehensive business intelligence solution that closes gaps and enables new applications. In fact, Bissantz starts where Power BI reaches its limits: with planning, visualization and AI-based automation.
Manual analytics effort?
Manually creating hierarchies, actual-to-actual comparisons, plan-to-actual comparisons, cumulations and sparklines requires many clicks and many hours in controlling. The Bissantz analytics tool for Power BI automates these steps at the click of a button – without any DAX programming.
Separate planning?
Power BI does not natively offer comprehensive planning capabilities. For those wanting to perform planning, budgeting and forecasting directly in Power BI, the platform’s limitations quickly become apparent. Bissantz bridges this gap with a powerful planning tool for Power BI.
Figures without insights?
Complicated charts and inconsistent visualizations make it difficult to get a quick grasp of the data. The Bissantz visualization tool for Power BI provides graphical tables with sparklines and Bissantz’Numbers – for Power BI data that is instantly understandable.
Market leaders and hidden champions trust us.
Bissantz
Analytics Kit
The Bissantz Analytics Kit boosts productivity in your Power BI projects and enables advanced analyses and meaningful visualizations.
Bissantz
Tables Visual
Bissantz Tables is our visual for standardized, efficient, and effective data visualization in Power BI.
Planning
for Power BI
Bissantz steps in where Power BI reaches its limits: with an easy-to-connect planning solution that packs a punch!
Power BI solution with established methods
Streamlined BI and controlling with Power BI tools by Bissantz
DeltaMaster has been the tool of choice for controllers and managers for many years – enabling analysis, planning and reporting in one continuous front end. What makes DeltaMaster so compelling is also available to Power BI users: patented and award-winning visualizations, a powerful planning engine and a broad set of business analysis methods.
Bissantz solutions don’t just make Power BI more powerful – they also make it easier. A few clicks are enough to enhance models, standardize reports and set up planning processes. No DAX programming, no complicated configuration. Instead: short implementation times, mobile reporting and automated workflows.
Get the most out of
your data in Power BI
Bissantz provides Power BI solutions that help you get more out of your Power BI data: with clear visualizations using typographically scaled Bissantz’Numbers, a consistent color logic and insightful sparklines, you spot variances faster, steer more precisely and understand your data immediately. At the same time, planning, budgeting and forecasting are available right in the report – bottom-up or top-down, with scenarios, workflow control, cell comments and real-time analysis.
Analytical reporting
Signals that convey deviation and control information faster and more clearly than ever before.
Integrated planning
Planning, simulating, extrapolating, entering, changing and saving data.
Clear visualization
Large values large, small values small, only red and blue in intensities, no yellow, no green.
More power for Power BI
Count on Bissantz for its powerful and dependable Power BI solution
What Power BI can’t do, Bissantz has long mastered: effortless planning, clear visualization and comprehensive analyses. Our Power BI solutions for powerful planning, insightful visualization and sophisticated analysis are based on established software modules that have proven themselves over many years with customers across all industries.
To help you get the most out of our technology, we provide personalized support. For the design, implementation and rollout of our Power BI tools, the Bissantz consulting team is at your side with advice and support – solution-oriented, efficient and fully tailored to your requirements.
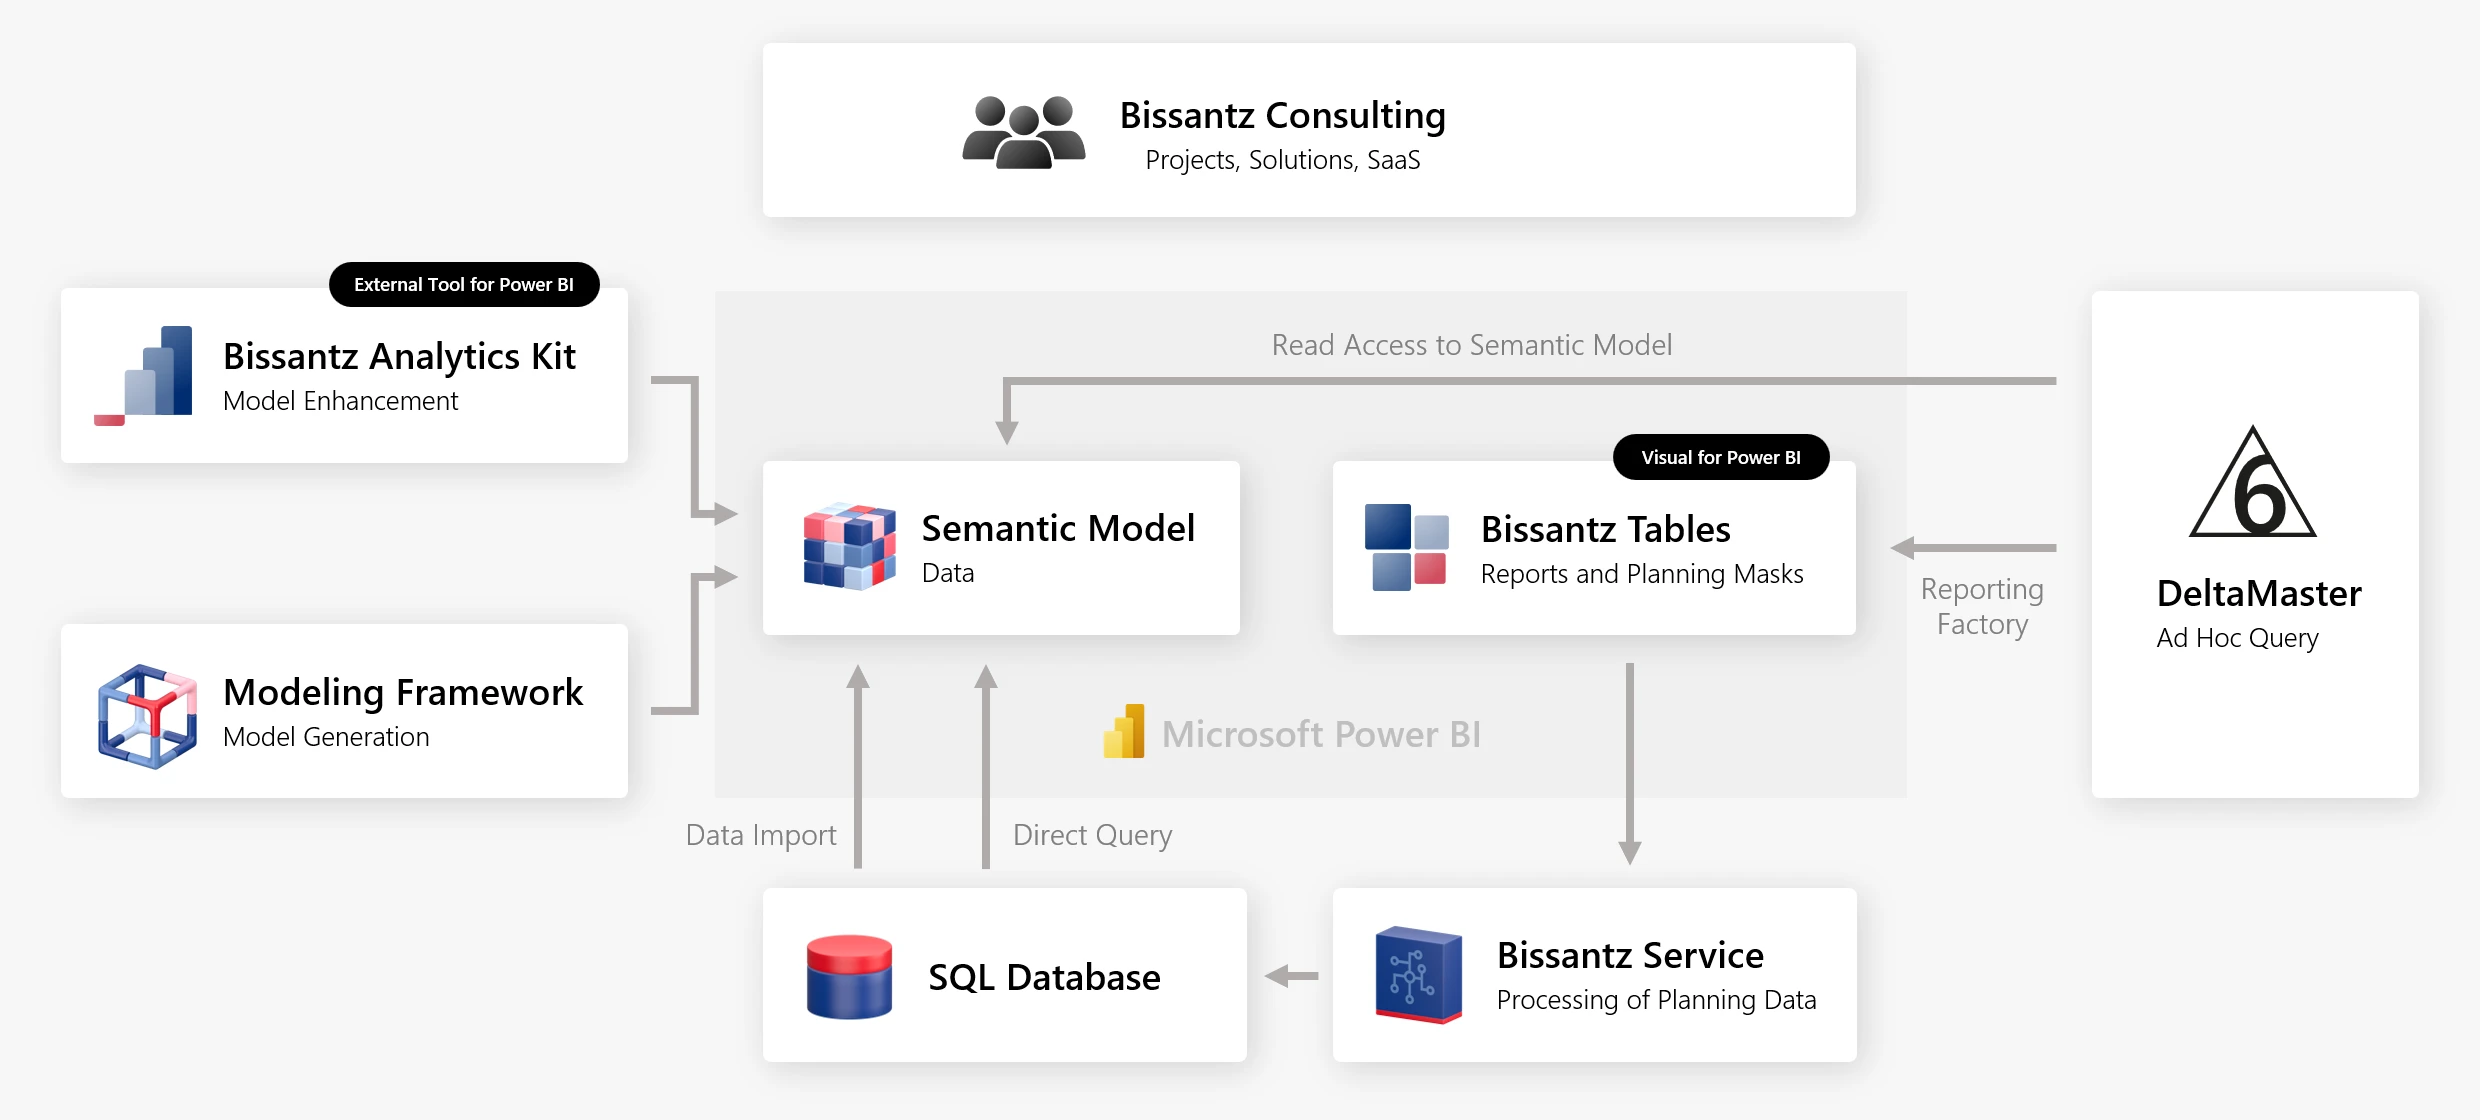
More performance, less effort
Our architecture enables the integration of all relevant systems – quickly and easily
FAQ – Frequently Asked Questions about our Power BI tools
Key information at a glance – answered concisely and clearly
Bissantz enhances the capabilities of Power BI with analytics, planning and standardized visualization, offering exactly the features that Power BI itself does not cover.
An AI-based extension that automatically enriches tabular models in Power BI with industry best practices for controlling.
Yes. Bissantz offers a full-featured planning engine for budgeting, forecasting and data entry directly within Power BI.
An award-winning Power BI visual for graphical tables featuring sparklines, typographically scaled Bissantz’Numbers and red-blue color logic.
For all Power BI users who want to professionally address the tool’s shortcomings.
Free of charge for you
Download our quickguide for a deep dive into our Power BI solution