![]()
Greetings, fellow data analysts!
For many elite athletes and other overly ambitious people, winning is everything. You don’t win silver. You lose gold! The same applies in modern business. The bottom line for most companies today is whether they win or lose, and not how they play the game.
Fortunately, not everything in business is top or flop. To make the well-informed decisions that ultimately pave your way to success, you need to monitor both the upper and lower ranks of your data. These lists of objects as well their proportions and spacing all provide key details in assessing your status quo.
Rankings are prized as one of the top analytic methods for analyzing this type of information. And as you would expect, DeltaMaster offers not one but two ranking options: traditional one-dimensional lists and the multi-dimensional PowerSearch. What these modules offer and how to use them efficiently is our focus in this edition of clicks! So…on your marks, get set, go!
Sincerely,
Your Bissantz & Company Team
Rankings allow you to categorize report objects, so you can quickly answer important business questions such as who (or what) is bigger/smaller, better/worse or faster/slower. Sometimes the ranking delivers the report that you need and your work is already done for the day. Other times, it produces more questions than answers, and you will need to analyze certain objects in further detail.
The Ranking, PowerSearch and pivot table features in DeltaMaster offer the functionality you need to do just that. This edition of clicks! will focus on how to use the Ranking and PowerSearch analysis modules[1].
Ranking
The Ranking module in DeltaMaster allows you to create top ten, top/flop or other lists that sort dimension objects in ascending or descending order based on the given criteria.
DeltaMaster lets you sort your data using the measure of your choice. Just select a measure directly from the column heading menu or drag it from your cockpit. If you choose the drag and drop option, DeltaMaster will automatically create a new, user-defined measure if necessary. Let’s say, for example, you are preparing a sales analysis for Chair Inc. and you want to show the gross margin variance in a pivot table. If you drag and drop the cell containing the actual margin into a Ranking analysis, DeltaMaster will create a filter measure (if it doesn’t already exist), which you can then use in any other cockpit or analysis.
You will notice that the user interface reacts differently depending on where you drop the measure. If you drop it into a column headline, DeltaMiner will not automatically calculate the ranking so that you can set other parameters and then Calculate when you are ready. If you drop the measure anywhere else within the preview pane, DeltaMaster will immediately execute the calculation.
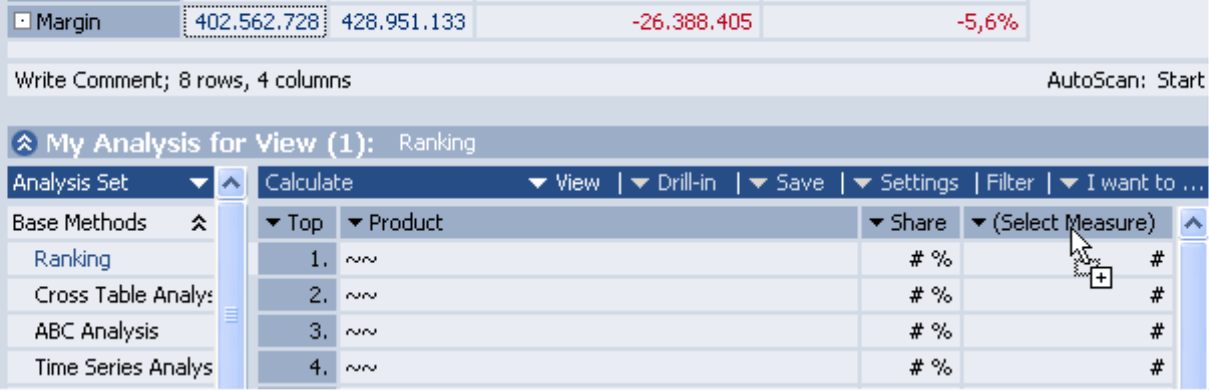
In a similar way, you determine in which dimension you want the members sorted. You can either drag a dimension or hierarchy from My view into the analysis window or you can select the desired dimension level directly from the column heading menu. This route gives you the further option to run a ranking across all levels.
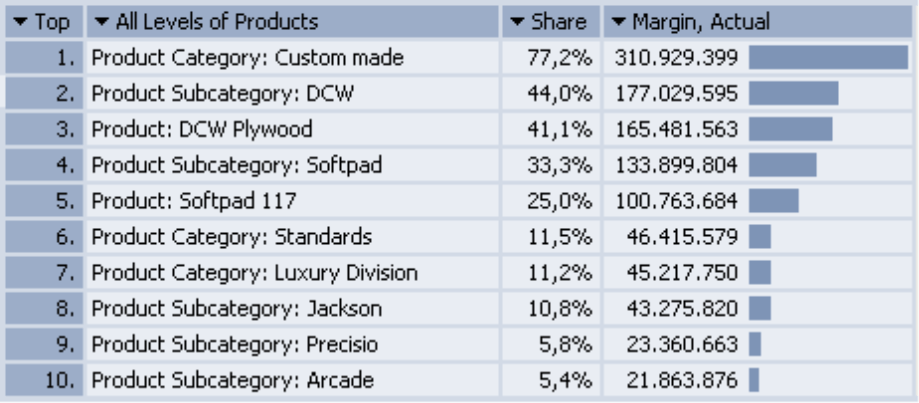
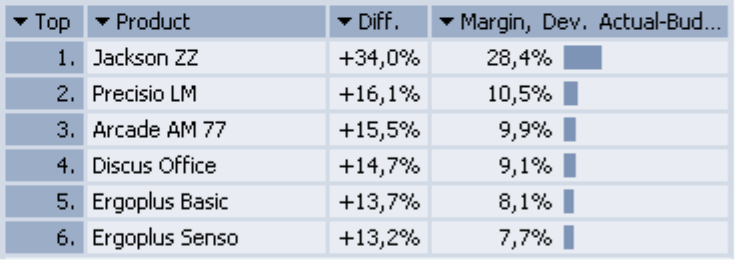
When you view the top-ten list on your right, you may be surprised that the product “DCW Plywood” (#3) generates more margin than the entire collection of standard models (#6). This function also helps you uncover compensating effects, such as when an object on a subordinate level has a greater value than one on an higher level.
Your current view and the Analysis Context of the chosen measure determine which dimensions can be used in rankings. When working with a virtual cube (which is a composition of multiple physical cubes in MS Analysis Services 2000 – the same applies to measure groups within an AS2005 cube), you will be dealing with measures that are located in only one of the underlying base cubes (or measure groups, respectively) and can thus only be sorted by their dimensions.
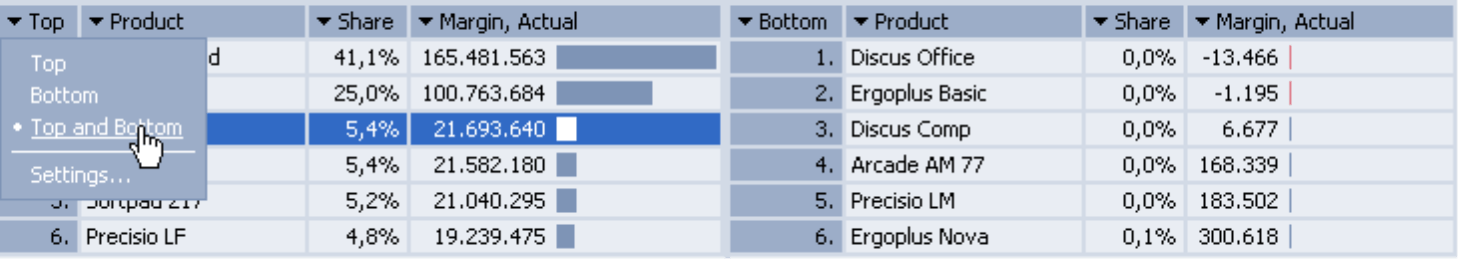
In the left-hand column you can change the direction of the ranking. If you choose Top, DeltaMaster will start the list with the largest value and continue in descending order. If you select Bottom, the list will begin with the smallest value and proceed in ascending order. The Top and Bottom option creates a top/flop comparison with both an ascending and a descending list.
Since DeltaMaster calculates the best and worst performers by default, you can switch among these views without needing a separate database query. If you want to export your ranking to PowerPoint, DeltaMaster 5.2.1 (and higher) gives you the option of a one or two list output and offers appropriate wildcards[2].
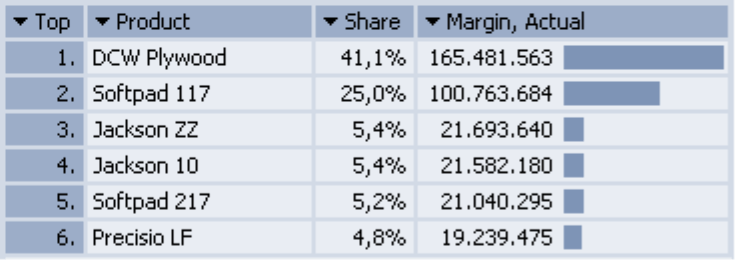
The horizontal bar in each row further illustrates the actual and relative size of the objects. If you prefer an alternative or additional graphical presentation, you can select one from the View menu.
The Share/Difference column ranks the individual object against the total of all objects in the current view of the selected dimension.
- If the sorting criterion is an additive measure, such as revenue, DeltaMaster will render the Share of the single value to the total value of all objects in the current view. In the column headline you can switch to see the Difference of the total sum and the individual value. The additivity of a measure is defined in its properties (General tab).
- If the sorting criterion isnot additive, such as a relative margin variance, DeltaMaster will automatically render the Difference of the individual value as the average of all objects. If you then switch back to Share, DeltaMaster will then reveal how the individual value compares to the average, which is set at 100%
Using the context and I want to… menus, you can show and hide the Share and Difference column at any time.
When working with large data volumes, you can improve response times by altering the Settings. You can make database queries faster, for example, by limiting the number of database records. If you do so, you may find that the sum of the percentage values in the Share column does not add up to 100%. This occurs because Share is calculated based on the total value of the objects in the current view, including those that are not displayed. This condition is documented in the legend. You can generate even faster results if you only Fetch top or bottom objects.
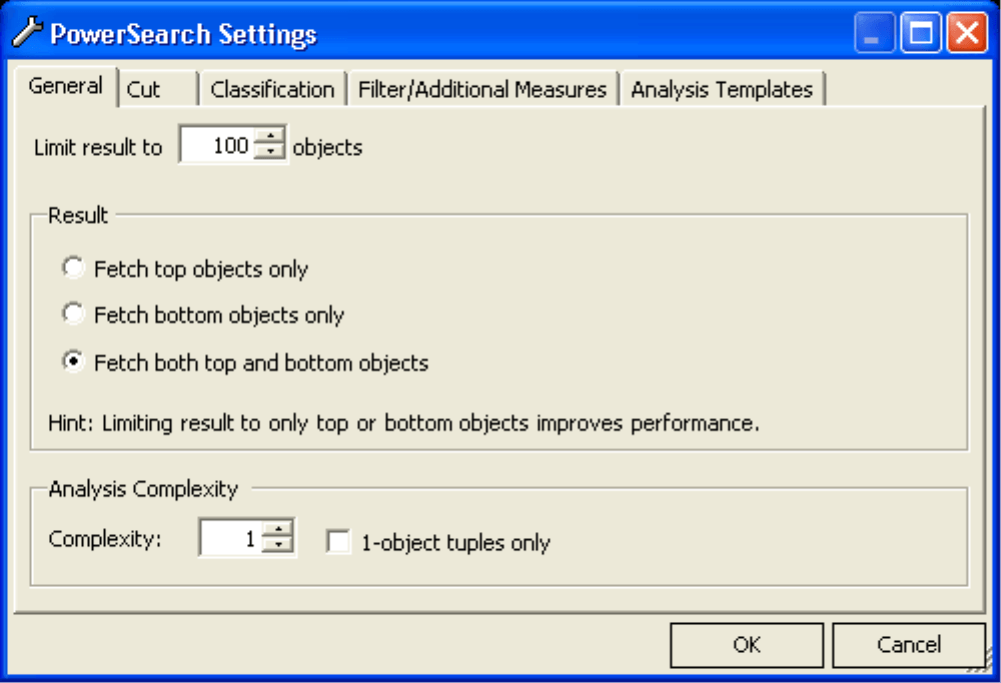
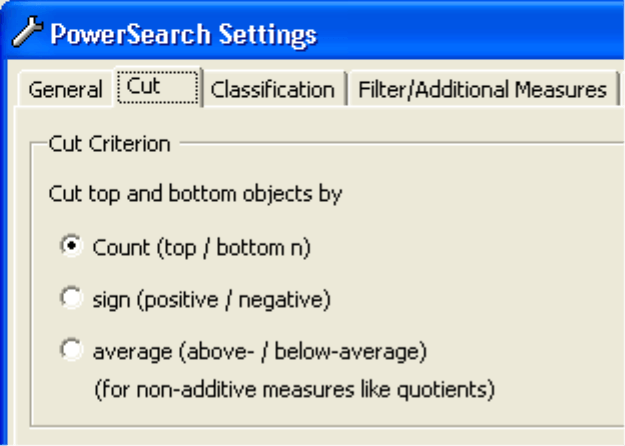
DeltaMaster classifies the periphery between the top and bottom objects as the Cut. Using the Cut tab, you can determine how DeltaMaster should separate the objects: based on the Count (number of objects set in the General tab), the Sign (which is helpful for variance analysis) or the Average (for quotients and other non-additive measures). Sign and Average ensure that objects are not duplicated in both lists. If you select Count and the set limit (doubled) is larger than the number of objects, however, some objects will fall into both categories.
You can create a very data-dense report, when you display additional values in the list. Chair Inc., for example, uses a sales statistic showing margin, turnover, and units sold. The easiest way to add additional measures is to press and hold the CTRL key while dragging the desired measure into the analysis window. Use the Hide filter or Remove filter options in the column heading menu to remove these values from your view.
![]()
If you want to learn more about a given object in your ranking, double click its name or use the Drill–in menu option to take the object over to the view (analysis chain technique) and continue your analysis.
PowerSearch
PowerSearch goes beyond “traditional“ ranking to offer data mining functionality. While a ranking can only sort objects in a single dimension, PowerSearch works across one or more dimensions. This way, you can search an entire OLAP cube and retrieve interesting findings without ever leaving your current view. This one-step process saves you a tremendous amount of time.
The usability and options that you now know from Rankings also apply for PowerSearch with a few slight differences in the settings and the dimension selection process.
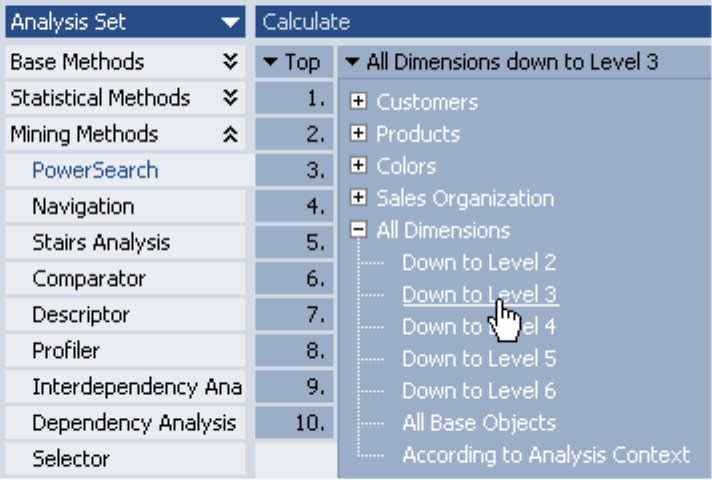
With PowerSearch, you can select All Dimensions in addition to the dimension lists used in Rankings. When you choose all dimensions, DeltaMaster searches all available dimensions of the cube and retrieves a list of the biggest and smallest objects. Dimensions are available for analysis when they are incorporated in the analysis context and they are not located on a base member in the view. Alternatively, you can limit your analysis to the top levels. If you choose “down to level 3” in the Chair data model, for example, the customer dimension would only include “country” and “region”, and the product dimension would only contain the “Product Category” and “Product Subcategory” levels. If you select All Base Objects, however, DeltaMaster will only search the base members (i.e. leaves) in the various dimensions.
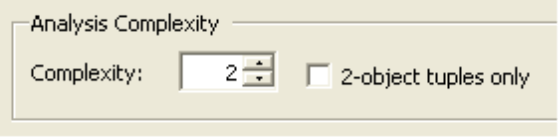
Another Settings option is Analysis Complexity, which signifies how many dimensions can or must be combined to the objects that will be sorted. A setting of “1” means that the objects will be directly observed and only have one dimension. The resulting list looks as if you had created a ranking for each individual dimension of your data model and then took the biggest individual objects in the dimension for a new ranking. If you select an analysis complexity of 2 or higher, objects combining two or more dimensions are possible: e.g. “Product Category: Standard Models. Region: South”. The check box regulates if DeltaMaster should only search for object combinations (i.e. tuples) containing the given number of dimensions or if it should serve as the maximum level, which means that items combining fewer dimensions can also be retrieved.
Questions? Comments?
Just contact your Bissantz team for more Information!
[1] Stay tuned to future editions to learn how to incorporate rankings into pivot tables.
[2] See DeltaMaster deltas!5.2.1, feature 22 for further information.
