






































What is data quality?
Data quality describes the degree to which data meets the requirements of its intended use, whether for analysis, operational processes, or strategic decision-making. It determines how accurate, complete, consistent, up-to-date, and fit for purpose a dataset is—and is therefore a key prerequisite for reliable business intelligence and data-driven corporate management. Bissantz ensures that companies work with reliable data and can make well-informed decisions.
| Feature | Details |
| Category | Data management / business intelligence / compliance |
| Application | Ensuring accurate, complete, and consistent data for analyses and decisions |
| Typical areas of application | Controlling, business intelligence, AI, automation, compliance, reporting |
| Related terms | Data governance, data integrity, data management, ETL, data warehouse, single source of truth |
| Benefits | Reliable analyses, better decisions, compliance, competitive advantage |
At a glance
Data quality is measured against its intended purpose: the same data may be sufficient for monthly reporting but too imprecise for a daily forecast.
Six core dimensions are considered standard: accuracy, completeness, consistency, timeliness, validity, and uniqueness.
Data quality can be measured using metrics such as error rate, duplicate rate, or the completion rate of mandatory fields.
Data errors are least costly when detected during data capture or integration, rather than later in a management report.
AI amplifies the effect: AI-powered analyses and forecasts only produce useful results when based on validated data.
Data quality definition
Data quality refers to the degree to which data is suitable, accurate, and reliable for a specific purpose. It is assessed based on various quality characteristics such as accuracy, completeness, timeliness, consistency, and uniqueness. High data quality ensures that data can be processed and analyzed reliably and used as a basis for well-founded decisions.
Data quality is not merely a technical detail; it is a key prerequisite for business success. Reliable, up-to-date, and complete data enables companies to generate sound insights and build reliable automated processes. In an era of business intelligence, artificial intelligence (AI), and data-driven decision-making, the quality of the underlying data is critical.
A high standard of data quality means that data must not only be technically correct but also understandable, relevant, and usable in the right context. Ideally, data should support processes rather than hinder them. Companies that recognize this invest systematically in capturing, validating, cleansing, and continuously monitoring their data.
What does data quality mean for a company?
Data quality in a company means that data is fit for its specific purpose: for month-end closing, sales planning, or an AI project. A dataset is never inherently good or bad; its quality always depends on the requirements of its users. In the literature, this principle is known as “fitness for use.”
Data quality goes beyond technical correctness. Data must also be consistently defined, understandable, and usable in the right context. A revenue figure is of little use if sales and controlling interpret it differently – for example, as gross revenue versus net revenue.
In business intelligence and controlling, data quality determines whether reports inspire confidence or trigger discussions about the numbers. Data quality is therefore not a one-time project but an ongoing responsibility shared by business functions and IT.
How does data quality differ from related terms?
Data quality is the measurable outcome that data integrity and data governance make possible.
| Term | Key question | Example |
| Data quality | Is the data fit for its purpose? | The customer master contains no duplicates and complete addresses. |
| Data integrity | Does data remain unchanged and structurally correct during storage and transmission? | An order always references an existing customer. |
| Data governance | Who is responsible for which data and according to which rules? | Sales maintains customer data; controlling defines metrics. |
| Data management | How is data captured, stored, integrated, and made available? | ETL processes load ERP data into the data warehouse every day. |
Why is data quality so important?
Companies with high data quality not only work more efficiently but can also respond more quickly to market changes because they have access to reliable data.
Poor data quality affects:
Decision-making: Analyzing faulty data can lead to incorrect strategic decisions.
Automation: Systems perform only as well as the data they process. The better the data, the more effectively processes can be automated.
Customer experience: Incorrect or incomplete information appears unprofessional.
Compliance and reporting: Faulty datasets can jeopardize legal obligations or audits.
What are the criteria and dimensions of data quality?
Data quality is generally measured across six core dimensions: accuracy, completeness, consistency, timeliness, validity, and uniqueness. Each dimension can be assessed using its own verification question and set of rules.
| Dimension | Meaning | Typical verification question | Example from controlling |
| Accuracy | Data corresponds to reality. | Do the values reflect the actual circumstances? | The posted invoice amount matches the invoice. |
| Completeness | All required datasets and mandatory fields are present. | Are any fields or entire datasets missing? | Every item is assigned to a product group. |
| Consistency | Data does not contradict itself, including across systems. | Do the values match across all sources? | Revenue in the ERP system matches revenue in the BI report. |
| Timeliness | Data is sufficiently current for its intended purpose. | When was the data last updated? | Incoming orders in the daily report are no more than one day old. |
| Validity | Data conforms to defined formats and value ranges. | Are all fields populated using the correct format and value range? | A discount is between 0 and 100 percent. |
| Uniqueness | Each object exists only once in the dataset. | Are there duplicates? | A customer is not recorded under two customer numbers. |
What other criteria are relevant?
In addition to the core dimensions, other criteria are important, particularly for use by business functions. The ISO/IEC 25012 standard defines a total of 15 data quality characteristics.
- Relevance: The data answers the questions for which it was collected.
- Understandability: Metrics and fields are clearly defined and documented.
- Provenance transparency: Every figure can be traced back to its source (data lineage).
- Accessibility: Authorized users can access the data on time and without unnecessary effort.
What are the characteristics of good data quality in everyday use?
Good data quality is evident when people no longer debate the numbers themselves but focus on what they mean. Typical characteristics include:
- Reports from different departments show the same values for the same metric.
- Controllers no longer manually correct figures in Excel before publishing them.
- Anomalies in reports have business-related causes, not technical ones.
- Business functions know who is responsible for their data and report errors at the source.
How is data quality assessed and measured?
Data quality is assessed by defining verification rules for each dimension, measuring the current state using metrics, and comparing the results with a target value. Without measurement, data quality remains a matter of assumption: according to Gartner, 59 percent of organizations do not measure their data quality.
What steps are involved in an assessment?
- Identify critical data: Which data feeds into management metrics, planning, or AI applications? This is where verification begins.
- Define verification rules: Business functions and IT define what “correct” means for each dimension, such as mandatory fields, value ranges, or reconciliation rules between systems.
- Measure the current state: Data profiling reveals completion rates, value distributions, duplicates, and formatting errors.
- Define thresholds: A target value is defined for each metric, such as at least 98 percent of mandatory fields being populated.
- Monitor continuously: Metrics are checked with every data load and made visible in a data quality report.
Which metrics are suitable for measuring data quality?
| Metric | Calculation | Dimension |
| Completeness rate | Populated mandatory fields divided by all mandatory fields, as a percentage | Completeness |
| Duplicate rate | Number of duplicates divided by all datasets, as a percentage | Uniqueness |
| Error rate | Datasets with rule violations divided by all datasets checked | Validity, accuracy |
| Reconciliation difference | Difference between a total in the source system and the BI system | Consistency |
| Data age | Time since the last successful update | Timeliness |
| Correction effort | Hours spent on manual rework per month-end close | All dimensions (indirectly) |
Thresholds depend on the intended purpose. For consolidated financial statements, a reconciliation difference of zero is mandatory; for a marketing trend analysis, lower accuracy is often sufficient.
What impact does data quality have on business results?
Poor data quality costs money, time, and trust. A Gartner study from 2020 estimates the cost of poor data quality at an average of at least $12.9 million per organization per year (Gartner). The figure is based on estimates for large companies and should be understood as an order of magnitude.
The later an error is detected, the higher the cost. The so-called 1-10-100 rule describes this effect: an error that costs €1 to correct during data entry can cost around €10 when corrected later and around €100 when it results in a bad decision. Checks at the source and during data integration are therefore the most cost-effective.
| Area | Impact of poor data quality | Example |
| Decisions | Management makes decisions based on incorrect figures. | A product appears profitable because returns are missing. |
| Planning and forecasting | Forecasts carry errors from actual data into future projections. | Duplicates in the customer master inflate sales planning. |
| Processes | Employees manually correct data instead of analyzing it. | Controllers reconcile Excel lists before every close. |
| Customers | Incorrect master data leads to wrong deliveries or invoices. | An invoice is sent to an outdated address. |
| Compliance | Audits and regulatory reports become vulnerable. | Differences between a report and accounting records are detected during an audit. |
| AI | Models learn from errors and pass them on as recommendations. | An AI forecast overestimates demand because cancellations are missing. |
How can data quality be improved?
Data quality can only be improved sustainably when organizational and technical measures work together: clear responsibilities, consistent definitions, and automated checks in data integration. A one-time cleansing exercise removes symptoms but not the underlying causes.
Organizational measures
- Assign a data owner to each data domain, such as sales for customer data and procurement for supplier data.
- Define metrics in a shared glossary so that “revenue” means the same thing in every report.
- Establish data entry rules and train employees accordingly.
- Have errors corrected at the source instead of overwriting them in reports.
Technical measures
- Validate entries in source systems, for example through mandatory fields and drop-down lists.
- Build verification rules into ETL processes so that faulty datasets are detected before loading.
- Consolidate data in a central data foundation that serves as a single source of truth.
- Detect and merge duplicates using matching rules.
- Measure and report data quality metrics with every data load.
BI tools improve data quality because they make errors visible where business users can recognize them: in reports, variance analyses, and drill-downs. A controller can spot an implausible monthly figure faster than any generic verification rule.
How can BI tools improve data quality?
| BI tool function | Contribution to data quality |
| Central data model | All reports use the same data and definitions. |
| Verification rules in data integration | Formatting errors, duplicates, and missing values are detected before loading. |
| Anomaly detection | Implausible values and outliers are automatically flagged. |
| Variance analysis and drill-down | Users can trace an unusual figure down to the individual document. |
| Reconciliation reports | Totals from the ERP system and BI system are regularly compared. |
| Commenting function | Business functions can document known data issues directly in the report. |
What errors occur frequently, and how can they be avoided?
The most common mistake is treating data quality as a one-time IT project. Without ongoing checks and clear responsibilities, old errors quickly return.
| Error | Consequence | Prevention |
| One-time cleansing instead of continuous checks | Errors reappear after a short time. | Build verification rules permanently into data integration. |
| Checking only in the final report | Corrections become time-consuming shortly before the deadline. | Check data at the source and during loading. |
| No data owners | Errors are reported but not resolved. | Assign a data owner to each data domain. |
| Inconsistent metric definitions | Departments argue over which numbers are “correct.” | Use a shared metric glossary and central data model. |
| Manual corrections in Excel outside the system | Reports diverge from the data foundation, and corrections are lost. | Make corrections in the source system or during data integration. |
| Treating all data equally | Effort is spent on unimportant fields. | Start with data that feeds into management metrics and AI. |
| Silently cleansing errors | The underlying cause in the source system remains. | Log cleansing activities and report them back to the source. |
What role does data quality play in artificial intelligence?
Data quality and artificial intelligence are connected in two ways: AI needs validated data, and AI can help identify data errors. Both aspects are becoming increasingly important as AI is used in controlling.
Why does AI require high data quality?
AI models inherit errors from their data and pass them on as seemingly well-founded results. The principle is known as “garbage in, garbage out.” An AI forecast based on incomplete actual data may appear plausible and still be wrong.
Language models introduce another layer: when a large language model accesses documents through Retrieval-Augmented Generation (RAG), the timeliness and uniqueness of the texts also matter. Outdated policies or duplicate versions can lead to contradictory answers.
Regulators are also imposing requirements: Article 10 of the European AI Act requires training, validation, and test data for high-risk AI systems to be relevant to their intended purpose, sufficiently representative, and, to the greatest extent possible, free of errors and complete (Article 10 of the EU AI Act).
How does AI improve data quality?
AI identifies patterns that fixed verification rules may overlook. Typical use cases include:
- Detecting anomalies and implausible values in large datasets
- Identifying duplicates with different spellings
- Classifying unstructured information, such as from conversation transcripts
- Suggesting mappings and cleansing steps when connecting new sources
Bissantz’s AI-powered data integration automatically detects format inconsistencies, typos, and implausible values, suggests cleansing measures, and reduces manual verification loops (AI for data integration). The business evaluation of these suggestions remains with the human, supported by explainable AI.
What trends are shaping data quality?
The key trends are moving data quality upstream into data integration and making it a prerequisite for AI. Instead of looking for errors in finished reports, companies are increasingly checking data automatically and continuously.
| Trend | What it involves | Significance for companies |
| AI-powered data quality | AI detects anomalies, duplicates, and formatting errors and suggests cleansing measures. | Fewer manual verification loops as data volumes grow |
| Data quality as an AI prerequisite | Companies validate their data foundation before introducing AI analyses, forecasts, or agents. | Data quality becomes part of every AI strategy. |
| Unstructured data | Texts, transcripts, and documents are incorporated into analyses through RAG and MCP servers. | Quality rules no longer apply only to numbers. |
| Data observability | Data pipelines are continuously monitored for timeliness, volume, schema changes, and distributions. | Errors are detected before users notice them. |
| Data contracts | Data providers and data users formally agree on schemas and quality requirements. | Clear responsibilities between business functions and IT |
| Source-level validation (shift-left) | Validation moves from the reporting layer into source systems and integration. | Lower error costs under the 1-10-100 rule |
| Regulation | The EU AI Act and audit requirements call for documented data quality and data provenance. | Data quality becomes subject to documentation and proof requirements. |
Practical example: data quality in sales controlling
A mid-sized manufacturer reports its monthly revenue from both the ERP system and the BI system. The figures regularly differ, and controlling spends days reconciling them in Excel before every close. Management has begun to question the sales planning figures.
The analysis identifies three causes: after the CRM system was connected, duplicate customers exist; new products have not been assigned to a product group; and credit notes are posted at different times in the two systems.
| Problem | Dimension | Solution with Bissantz |
| Duplicate customers after CRM integration | Uniqueness | AI-powered data integration detects anomalies during loading and suggests cleansing measures. |
| Products without a product group | Completeness | Verification rules in the ETL process report missing assignments to the sales data owner. |
| Different revenue figures between ERP and BI systems | Consistency | A central DeltaMaster database serves as the single source of truth, while a reconciliation report compares the totals. |
| Anomalies are only detected in the management report | Accuracy | DeltaMaster automatically highlights variances, and controllers can drill down to the individual document. |
The result: Causes are fixed in the source system instead of being overwritten in the report. Controlling comments on remaining anomalies directly in DeltaMaster, and management can focus on actions rather than debating the numbers.
How does Bissantz support data quality?
Bissantz relies on the highest possible data quality as the foundation for reliable analysis and effective business management. After all, intelligent BI is only as good as the data it is based on. For this reason, DeltaMaster consistently relies on structured, validated, and integrated data models, for example from data warehouses or ERP systems. This ensures that all analyses are consistent, traceable, and correct – regardless of how complex the underlying company data may be.
Bissantz BI solutions actively support data quality by:
relying on centralized, redundancy-free data storage (the single source of truth),
automatically identifying variances and highlighting them visually (for example, through the patented two-color logic),
enabling commentable analyses that make faulty or unusual data situations visible directly in the planning context,
creating transparency into data provenance, without a black box.
Data quality is a business-critical factor, particularly in integrated planning, forecasting, and AI-powered analysis. That is why Bissantz does not treat data validation as a preliminary step but as an integral part of the entire analysis and management process – from import and modeling through to decision-making.
DeltaMaster thinks along: Faulty, incomplete, or contradictory data is not processed silently but deliberately made visible – visually, linguistically, and through system support. This turns potentially misleading information into reliable knowledge – and transforms a high standard of data quality into a tangible competitive advantage.
FAQ: frequently asked questions
Data quality describes how well data is suited to its intended purpose. Data may technically exist and still be outdated, inconsistent, or incomplete. Good data quality means having the right data, in the right format, at the right time, without errors. Like a compass, data is only useful if it actually points north.
Data integrity ensures that data remains unchanged and consistent – both technically and structurally. Data quality is broader: it also assesses whether data is factually correct, complete, up to date, and fit for its intended purpose. Data integrity is a prerequisite for data quality, but the two are not the same.
Common causes include manual data entry without validation, missing or inconsistent standards between systems, outdated datasets without regular updates, unclear responsibility for data maintenance, and inadequate ETL processes for data integration.
Data quality is measured across six dimensions: timeliness, uniqueness, accuracy, validity, consistency, and completeness. Specifically, metrics such as error rates, duplicate rates, completeness rates, or deviations from defined reference values are captured and monitored.
A single source of truth is a single, centralized, reliable data source that all users access. It prevents different departments from working with different, contradictory datasets and is therefore a key element of consistent data quality across the organization.
DeltaMaster integrates data quality checks directly into the analysis and reporting process: variances are automatically detected and highlighted, the data foundation is centralized and redundancy-free, and the origin of every metric can be traced transparently. Bissantz also supports the design of quality standards and ETL processes, ensuring that data quality is embedded systematically from the outset.
Summary
Data quality is the silent foundation of all data-driven activities: only when data is accurate, complete, consistent, and up to date can analyses, reports, and AI applications deliver reliable results. It is not a one-time project but an ongoing process, embedded in data models, ETL processes, and an established data culture. With DeltaMaster and its consulting expertise, Bissantz makes data quality an integral part of corporate management—visible, manageable, and sustainably secured.
Related topics: deepen your knowledge
Free of charge for you
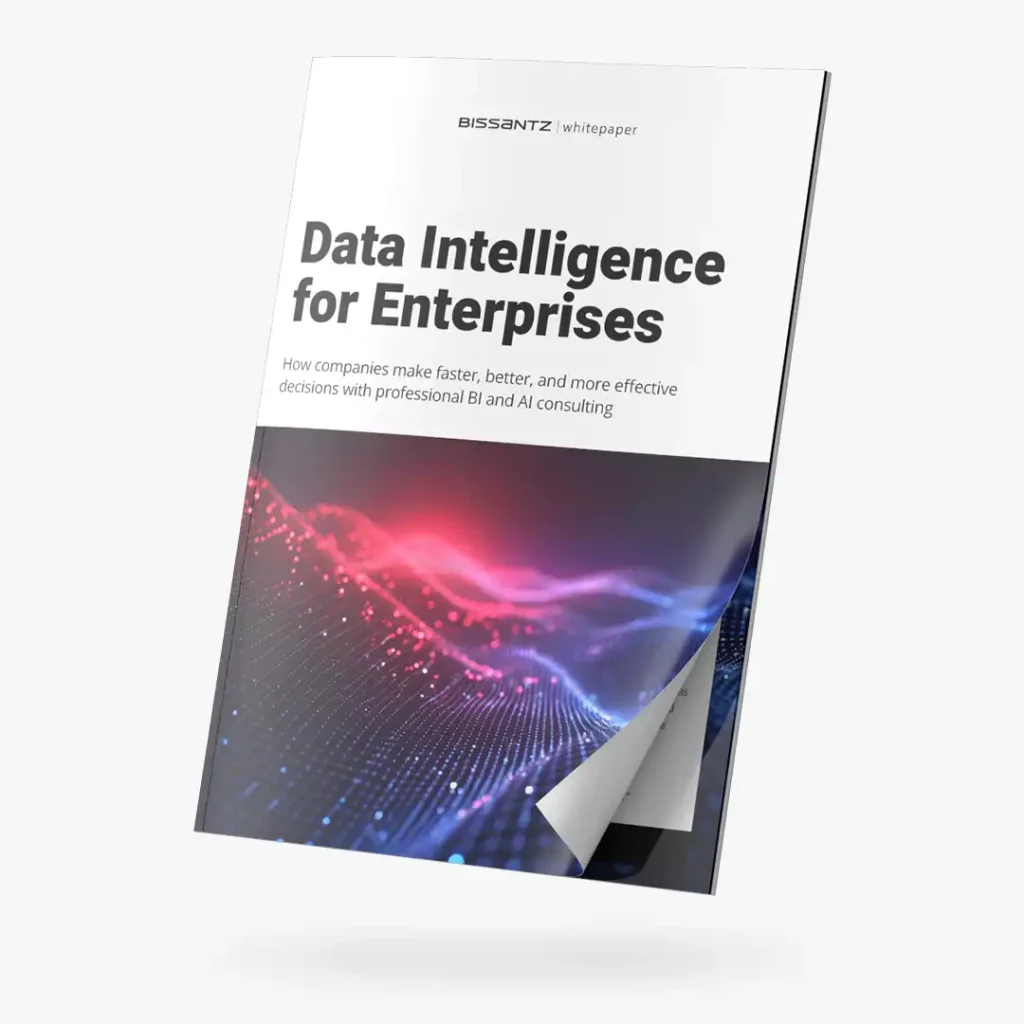
How companies make faster, better, and more effective decisions with professional BI and AI consulting