DeltaMaster.
Award-winning business intelligence software for controlling and data-based management in all specialist departments.
analysis, planning and reporting in one interface
immediately grasp what is important thanks to clear, uncluttered design
create, edit and distribute reports at record speed
one tool for all user groups, from report recipients to power users and data scientists
automation and standardization, across all applications


One software for all tasks.
Leave piles of reports, floods of diagrams and fuzzy data behind you.
With DeltaMaster, everyone sees and understands the next steps to be taken, whether in controlling or in the specialist departments. Integrated modules with artificial intelligence (AI) enable a high degree of automation: the standard reports for performance reviews, variance analyses and forecasts that every company needs are created in just a few minutes. DeltaMaster also contains numerous business management methods for ad-hoc analysis.
During planning, the entry of values is supported by bottom-up and top-down mechanisms, for example data entry at cell or aggregate level, value fixing or multi-level cell comments. DeltaMaster fully automates report distribution so that even hundreds of recipients can be supplied with modified reports. DeltaMaster’s role concept addresses operation and data access in equal measure.
Market leaders and hidden champions trust us.
Analysis.
Dashboarding and analysis are seamlessly linked in our software. Reports and signals are clear and precise, and our notation concept regularly wins awards. Special procedures are available for particular issues, such as geo-analyses, cross-report analyses, forecasts and data mining suitable for specialist users.
Planning.
You can easily create applications for bottom-up and top-down planning – with distributed and decentralized data input. You manage master data and authorizations and record and monitor input, validation and approval. You comment on and simulate plan corrections during the year and on an ongoing basis – closely interlinked with reporting and variance analysis.
Reporting.
Our software offers all the necessary functions for modern, efficient reporting, from report display to report creation and distribution. Graphical tables replace the usual bulky diagrams. For ad-hoc analysis, active report recipients have access to powerful and comprehensible mechanisms for data navigation and a smooth transition from overview to details. Self-service modules enable the development of new applications in the specialist departments.
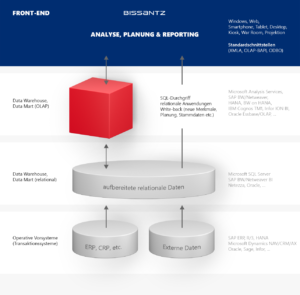
All data in one interface.
Seamless connection to all relevant upstream systems and databases.
How can we help you?
Get in touch with us for more information.
You are currently viewing a placeholder content from HubSpot. To access the actual content, click the button below. Please note that doing so will share data with third-party providers.
More Information