![]()
Greetings fellow data analysts!
Business is complicated enough. Fortunately, analyzing it doesn’t have to be! Rankings, for example, are simple, sleek and effective – the next best thing to an iPod for data analysts. Ironically enough, their simplicity is what makes many people so skeptical. A “no pain, no gain” mindset, we suppose.
Rankings, however, contain an amazing amount of information – if you take the time to read between the lines. When combined with graphical tables, they present and visualize numbers with a powerful punch that will “wow” even the biggest cynics. We’ll show you how in this issue of DeltaMaster clicks!.
Sincerely,
Your Bissantz & Company Team
PS. To learn more about the power of simple rankings, check out the three part blog series by Dr. Nicholas Bissantz at https://www.bissantz.de/bissantz-ponders/powersearch2.
In the February issue of DeltaMasterclicks! we offered a few helpful tips on working with Ranking and PowerSearch. As you now know, these specialty tools quickly help you to pinpoint what is hot – and what is not – within your data. What you may not know, however, is that a basic pivot table also has many hidden talents when it comes to presenting objects in an orderly fashion.
Axis definition
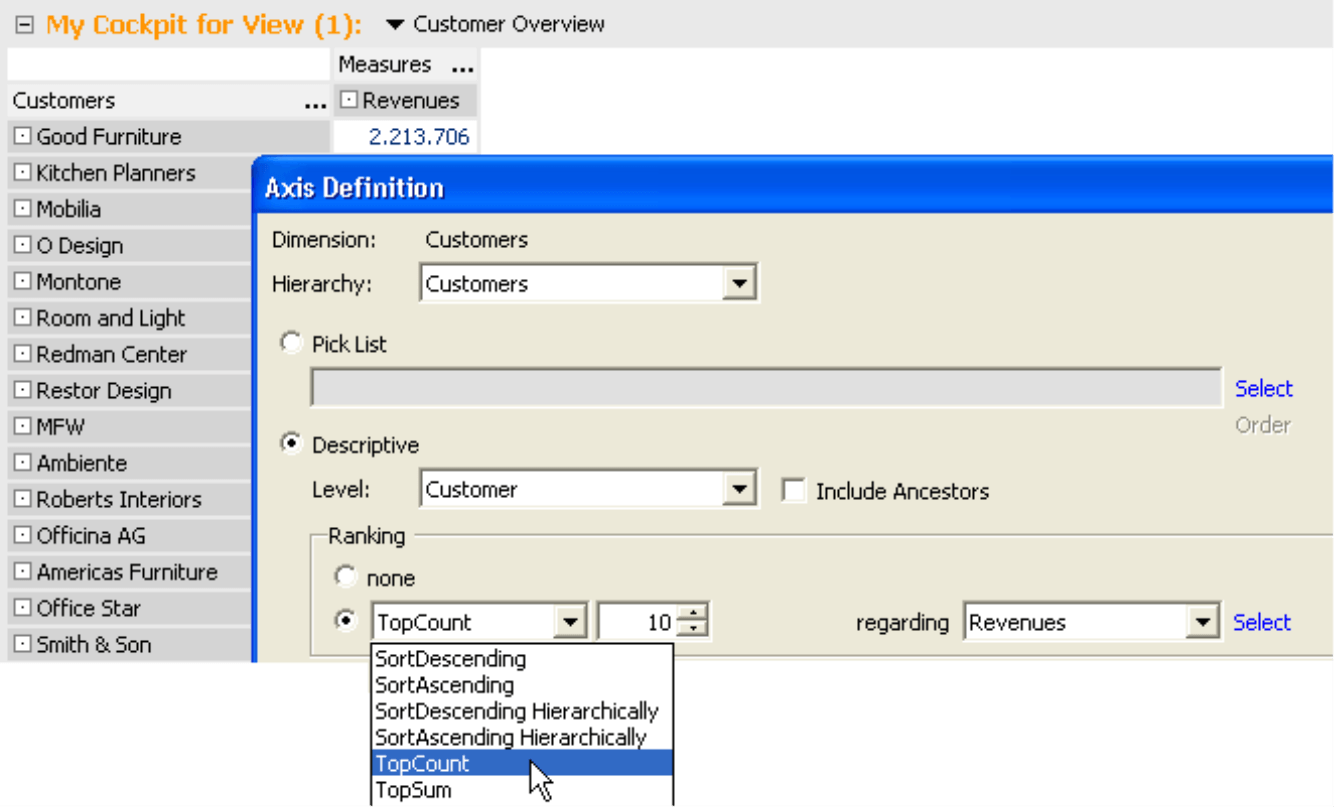
The Axis definition serves as the central hub in the pivot table. You can open this dialog by clicking the ellipsis (…) after the dimension name or the Definition link under Cockpit definition.
DeltaMaster offers different variations for setting up rankings. In each case you need to select which measure it should be Regarding, such as the revenues in the screenshot to your right.
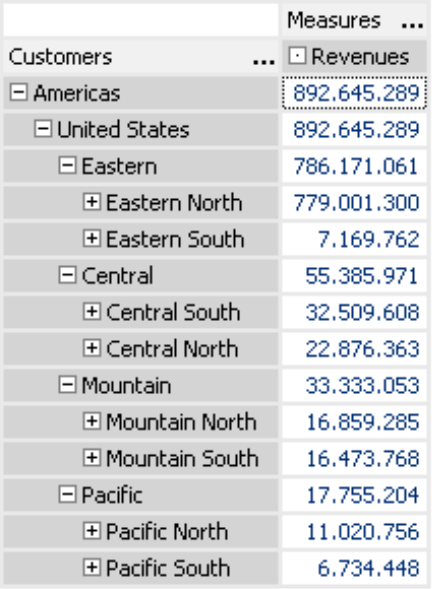
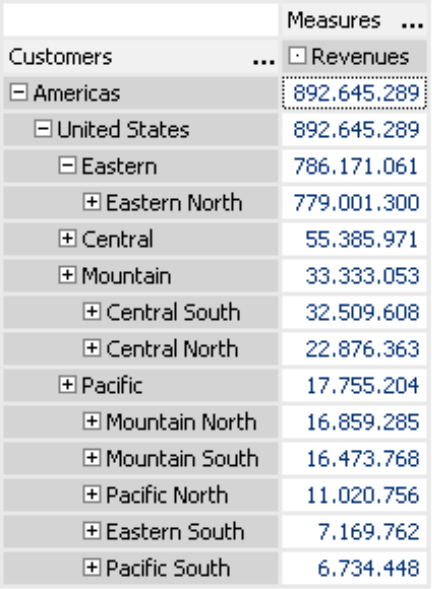
The first four options in the selection list retrieve all members in the cockpit view and don’t require any further settings. Hierarchal rankings are very useful when working with multilevel tables containing, for example, individual customers and customer groups. This option helps you keep an eye on level relationships, since it sorts the customer groups as well as the individual customers within each group by revenue. The following screenshots illustrate the difference. To your left you see a ranking Descending hierarchically, which categorizes the main regions (Eastern > Central > Mountain > Pacific) as well as the subregions that comprise them. To the right, you see a ranking based on pure numbers and with no respect to hierarchies. Here you will note that “Central” subregions are listed under “Mountain”. These results are correct based on the given parameters, but as you can see this constellation does not make sense for every type of analysis.
The six other ranking options in the Axis definition allow you to shorten the list of members so that only those appear that make a noteworthy contribution to the measure that interests you. In your settings you will need to set a limit so that DeltaMaster knows which elements should be included. Options include:
- The number of members (e.g. top ten) – TopCount, BottomCount
- An absolute sum for the member – TopSum, BottomSum
- A percentage of the total value of the measure in the cockpit view – TopPercent, BottomPercent.
“Top…“ sorts the largest members in ascending order, while “bottom” sorts them in descending order.
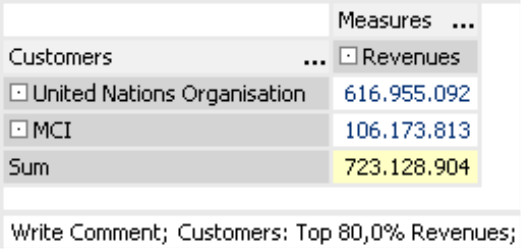
After creating the list, DeltaMaster will display the applied options in a caption as seen in the screenshot to your right. The sum equals 723 million (which can be displayed in the context menu, Column aggregation) and is equivalent to 80% of the 892 million in total revenues. The measure that DeltaMaster uses to create the ranking does not even have to be in the table. You can select the measure of your choice in the Axis definition.
In the Axis Definition you can explicitly set the view in the selected dimension, for example, using a Selection list, or Descriptive through the dimension levels, and so on. Depending on your choice, the settings for the axis may override those that are selected in the My view window. You can also use MDX to define additional cockpit views or ranking rules.
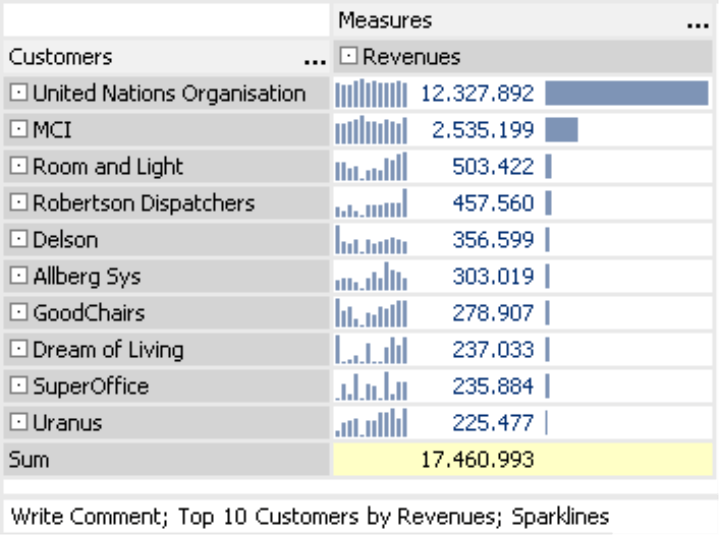
As in Ranking and PowerSearch, you can display bars, sparklines, trend arrows and all other cockpit options in your cockpit to visualize relative sizes. Simply activate the option in the context menu.
Sort cockpit display
So far you have learned how you can set the ranking criteria for structuring the pivot table. These criteria influence the database queries that are executed in the background. You can, however, also sort your data by the values that have already been displayed.
The appropriate commands are located in the context menu of the row and column headlines. Each context menu also contains the option to reset the sorting.
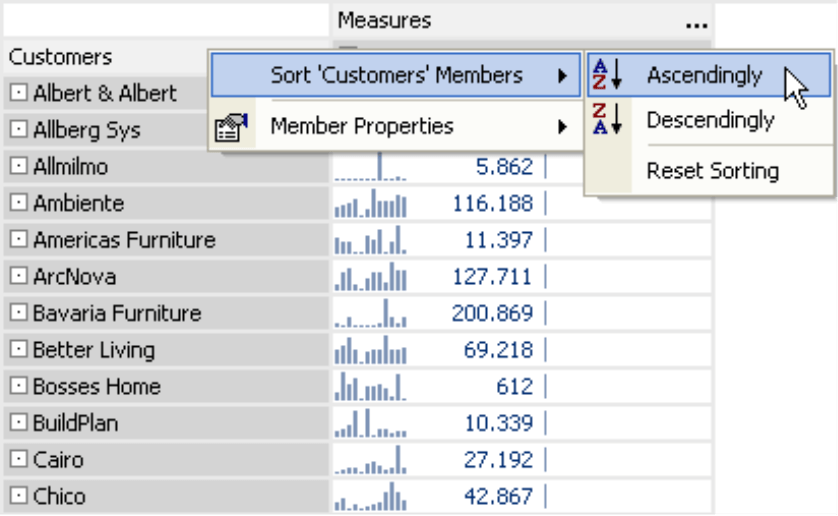
While a Ranking in the Axis definition always refers to a measure, the context menu also allows you to sort members or member properties (attributes) alphabetically by name. This makes it easy to create customer lists in alphabetical order as well as in the order of their business relevance. DeltaMaster marks a row or column that has been set for an individual sorting with a small triangle.
The order that you bring into the table from the context menu only applies for the current view. This “superficiality” means that you can quickly switch among different views because you do not have to query the database to sort the data again. In addition, this superficial sorting does not affect Flexreports that the pivot tables reference. The references conform with the sorting defined in the Axis definition and not in the context menu.
Wizard
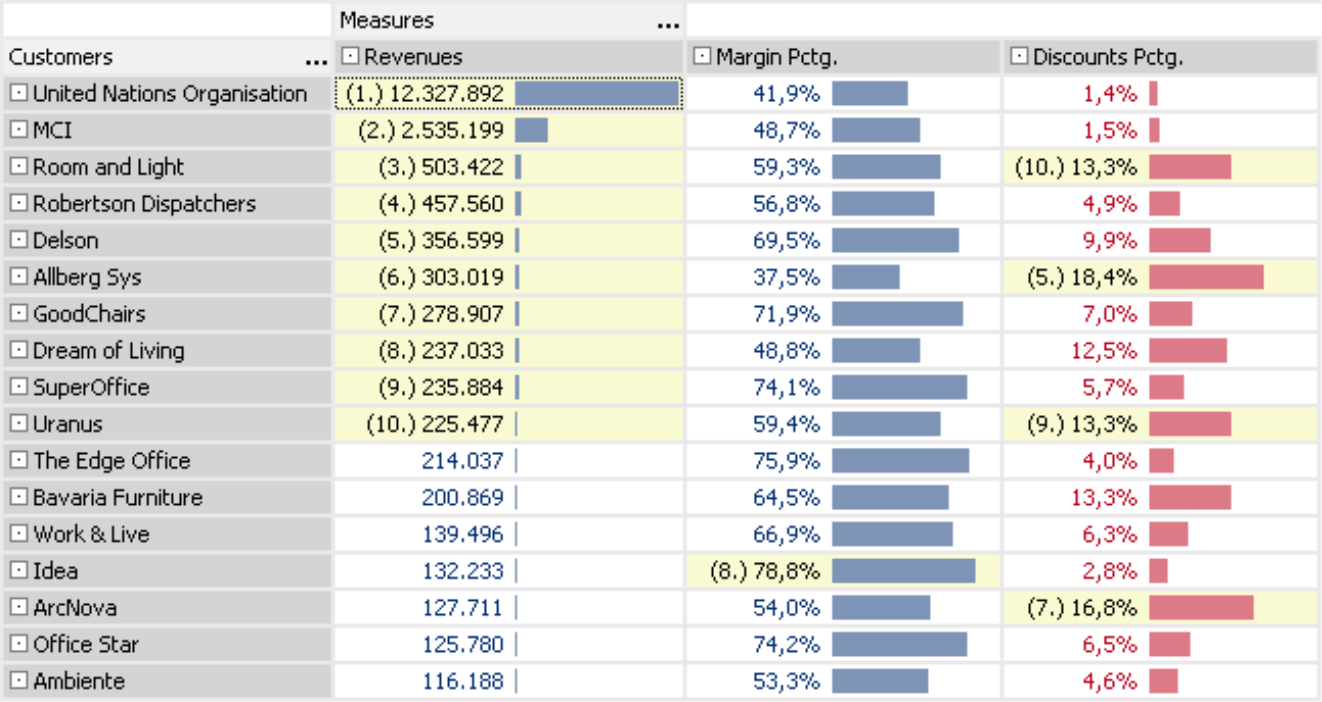
Another helpful tool for rankings is the wizard that marks the top and bottom ten values for the entire table, every column or every row. You can activate this option from the context menu.
In the example on your right, you can see a comparison of three different measures. The highlighted section reveals that none of the top ten customers with regards to revenue belong to the top ten with regards to margin percentage. In fact, it appears that many of the top revenue generating customers need to be enticed with large discounts. The bars, which have been added on a column to column basis, help visualize the gaps.
Pivot navigation
In DeltaMaster 5.3 we presented Pivot Navigation, a completely new concept for analysis and reporting with pivot tables.
The Pivot Navigation allows you to examine interesting trends by adding additional columns to your table step by step – similar to a drill down. What makes this technique so unique is that the granularity only applies for the selected element and not for the entire table. When you extend the table, another ranking comes into play. If you select Automatic navigation or one of the listed levels, DeltaMaster will only display the 10 largest members in descending order by default – which delivers the same results as the Top Count/10 Ranking option in the Axis definition. This is the same suggestion that DeltaMaster offers in the User-defined navigation. You can, however, change this default setting in each subsequent column (see Edit navigation in the context menu of the main member of the column).
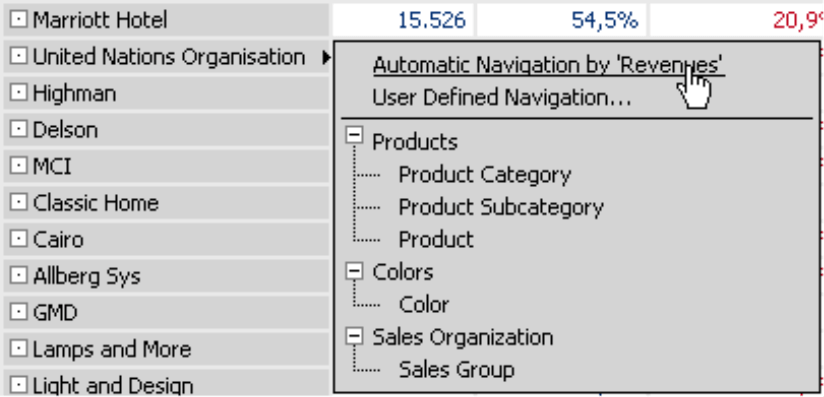
The Pivot Navigation creates a wedge-shaped pattern in the table that often reveals a ranking progressing from general to detailed objects:
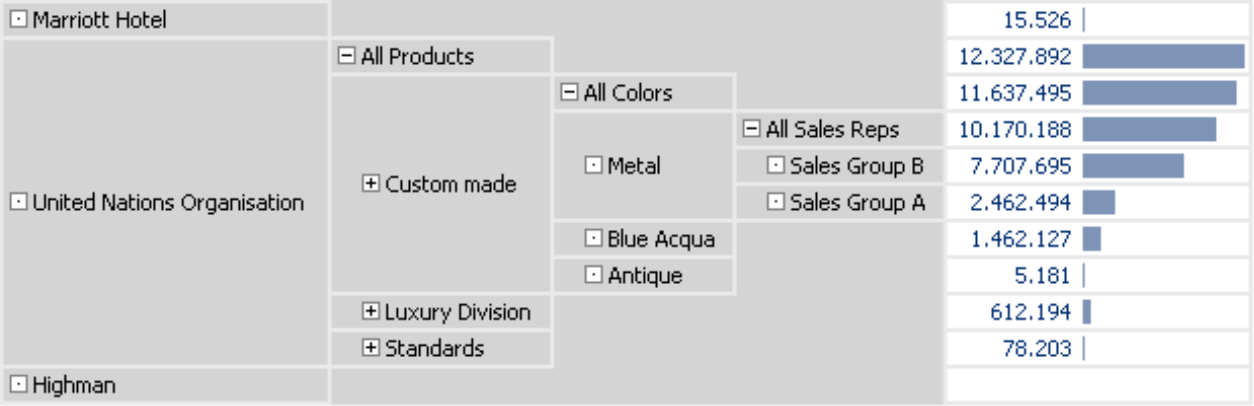
Check out DeltaMaster deltas 5.3 for more information on Pivot Navigation functions.
Questions? Comments?
Just contact your Bissantz team for more information!
