![]()
Dear data analysts,
the American Thomas Alva Edison is considered an exceptionally prolific and efficient inventor. Although his most known work, the light bulb, had been discovered before him (nota bene: by a German named Heinrich Göbel), only Edison’s improvements ensured broad propagation and economical success. There were other areas in which Edison brightened the world, for example his devices for communication and display of stock quotes, the paragons of today’s common news and stock market tickers.
Then and now, the concern was to dynamically provide up-to-date information about companies and markets. Instruments like the Edison Stock Printer allowed to make decisions substantially quicker and more accurate. Because a premise for success on the parquet is to be permanently informed about the ever-changing quotes. There’s not much of a difference to the operational sphere in a company: The key is to sift through and correctly appraise a lot of figures in a very short time.
Our suggestion is the combination of two innovative concepts: ticker plus word graphics. The result is called SparkTicker and is at your disposition in all DeltaMaster user levels from now on.
Kind regards,
Your entire Bissantz & Company team
Since its 5.1.4 release, DeltaMaster puts forward a new view on all user levels, ranging from Offline-Reader all the way up to Miner: the SparkTicker. In an infinite loop, a great number of data is moved in front of the eye of the beholder – unobtrusively but always present, up-to date and in the right context, thanks to sparklines.
Once started, the ticker presents the selected information fully-automated and without any need for interaction. Thus, even the shortest clearance time can be used to catch a glimpse on the figures and their development free of “setting-up time”. And if you want to know more, DeltaMaster will be sure to reveal the details.
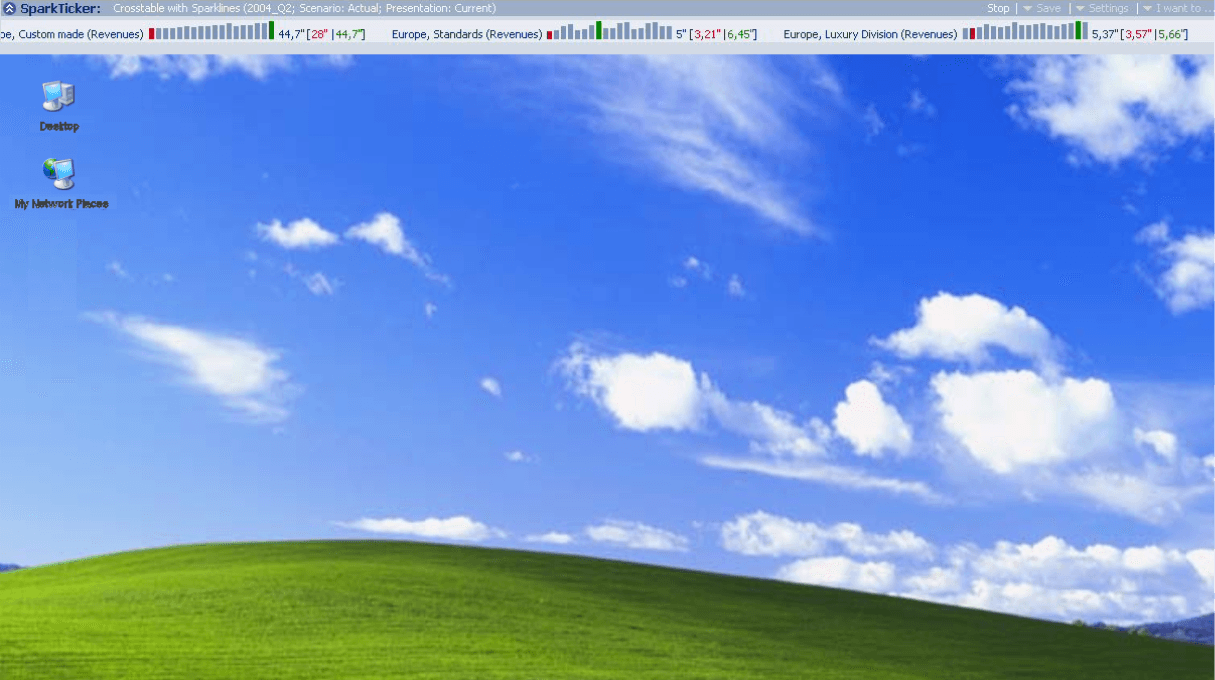
Displaying SparkTicker
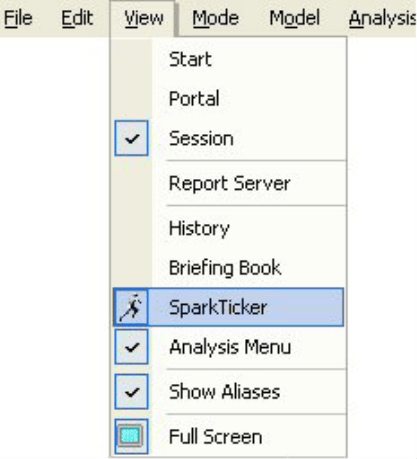
The SparkTicker window behaves as you are used to from other areas of the DeltaMaster user interface. You switch it on and off via the View menu, and with the double arrow symbol in the top-left window corner, you can “fold” it in and out.
Data Sources for SparkTicker
The values displayed in the ticker are taken from the reports stored in the current analysis session. You can determine the reports to be “tickered” in the Settings (in the SparkTicker title bar). This dialog corresponds to the familiar Briefing Book window and lists all saved reports. If no reports have been selected for the ticker yet, you can open the same dialog with the link “Select reports…”.
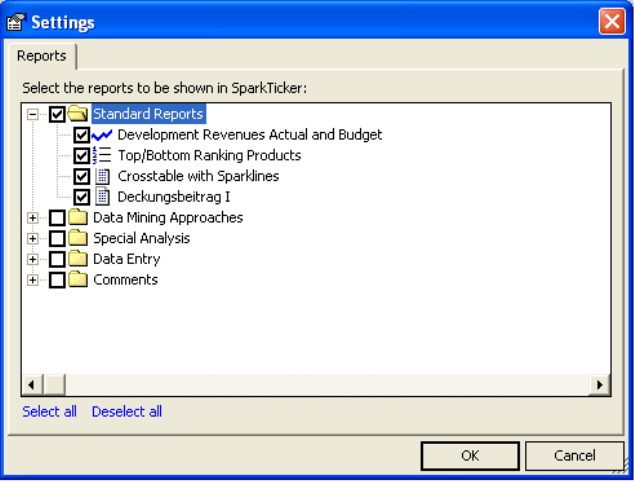
Select the reports whose contents you would like to see in SparkTicker. At present, the following report types are supported:
- Pivot table. If the underlying pivot table contains line or bar sparklines, they will also be shown in the ticker; equally, the length of the sparklines conforms to the table settings. If pivot tables without sparklines are used, the ticker displays the numeric values without word graphics.
- Time series. The line-oriented representation typical for time series will be shown as such in SparkTicker.
- Measure chart and list. This report type knows no history and thus displays the figures without word graphics.
- Ranking and PowerSearch. The output is sorted and without sparklines.
![]()
Gray entries cannot be selected as SparkTicker does not support these report types (yet). For the sake of a lithe representation, we recommend to start with no more than roughly 50 values in the ticker. Confirm with OK after you have selected the desired reports – and SparkTicker starts to move.
DeltaMaster takes care of the compact formatting and rounding of the figures as well as the coloring of the bars and extreme values – automatically and independently from the parameters in the measure settings. In the example above, a revenue figure of lastly 5 million is shown for Europe and standard models, the maximum in the regarded stretch of time was around 6.45 million, and the minimum value about 3.21 million.
Semantic Zooming: Word Graphic size and Magnifier Function
You can extend the compact presentation in the ticker in two ways to gain deeper insights: First, the size of the word graphics can be regulated in three steps. Chose small, medium or large size in the
I want to… menu or in the context menu (you may also use the scroll wheel of your mouse or the plus/minus keys on the keyboard). The enlargement is especially fruitful with bar sparks:
![]()
![]()
![]()
In the largest mode, the values behind the last bar show (from top to bottom) the relative and absolute deviation from the second-last to the last value, the highest and the lowest value of the collection.
Second, the Magnifier function is available for bar sparklines if you haven’t turned them off in the
I want to… menu: If you “touch” a certain bar with the mouse, the ticker creates additional space for further numerical information related to the data item. Again, the amount of additional information depends on the size of the word graphic:
![]()
![]()
![]()
In the small version, the numerical value of the touched bar and its predecessor appears. In the medium version, we additionally learn about relative changes. In the largest version, there is enough space for the absolute as well as the relative differences.
That’s the crux of the so-called semantic zooming: It awards more space with more information.
Fair and Simple Control(ling)
One of the big advantages of a ticker is the fact that the information it offers may be consumed at any time and without further preparation (searching a program, starting it, browsing for a file, loading it, logon etc.). We took great care to guarantee that using our SparkTicker is really simple and intuitive:
- As long as the mouse hovers over the marquee, it stops to allow a better study of the data. If the mouse pointer leaves the window, it continues to move – unless you have stopped the ticker completely with the Stop ticker command (or the space bar when the SparkTicker window is active).
- If you click on the ticker (with the left mouse button) and keep the mouse button pressed, you can manhandle the display to the left and right, allowing to move through the data quickly or “retract” an element that has just passed by.
- You control the speed of the movement by means of the I want to… menu or the context menu (right-click) of the ticker marquee.
- Also in the context menu, you can find two commands to copy the selected sparkline (with the right mouse button) into the Windows clipboard as a bitmap or metafile in order to further process it in your Word, Excel, or PowerPoint documents. As a rule, metafiles deliver better printing quality.
Further SparkTicker features are already at the starting line and will be available in one of the next releases. Among other things, you’ll be able to reduce DeltaMaster to the SparkTicker display to keep it in view even if you exceptionally work with another Windows application. With a double-click you can then…
But let us surprise you!