![]()
Dear data analysts,
it will not be difficult for a management expert to explain the term “profit margin”. To calculate it in various aggregation levels is a different story. And things get especially delicate when you contemplate two margins and face the task to explain where the difference between them comes from. A conventional margin calculation rather tends to cause even more trouble than to give an answer: As it is not capable of unveiling shifts in the sales structure, it may lead to the seemingly paradox result that the margins differ even with identical sales quantities and turnovers.
Fortunately, business economics has an answer to such questions: the margin flow calculation, also referred to as variance analysis or simply deviation analysis. And even more luckily, this functionality is at your disposal in DeltaMaster. It sure would lead too far to discuss the theoretical backgrounds in DeltaMaster clicks!, as it has been done in professional journals like the famous German “Zeitschrift für Betriebswirtschaft” (Magazine of Business Economics). Nonetheless, we’d like to direct your attention to this superlatively interesting function and its implementation in DeltaMaster. Maybe you have already gathered experience with these procedures? Please send us a note, we are curious about your opinion!
Cordially,
Your Bissantz & Company team
The goal of the margin flow calculation is to analyze and explain deviations in margins. It is important to differentiate between three influencing values all coming into effect simultaneously: the quantitative component (e.g. units sold), the value component (e.g. prices and cost per unit), and finally the structural component which is particularly important in practice. It describes from which subsets the sales are compounded, e.g. different products, configurations/variations, or market segments:
- A steel mill produces mass steel, steel ribbon and special profiles. Each product category has further subdivisions, e.g. different manufacturing processes like warm milling, warm rope pressing and cold drawing for the profiles. Budgets are based on the amounts of steel in the various product types which are additionally differentiated after regions and industries (construction, automobile etc.). This quantity structure is valued with detailed budgeted margins, allowing for an in-depth deviation analysis.
- An automobile manufacturer offers the body types “Sedan” and “Station Wagon” as well as the equipment packages “Exclusive” and “Sport” for his upper middle class model. The countries in which the cars are sold, the body and the equipment constitute the model dimensions in which the sales figures are budgeted and from which the unit margins are derived.
- For airlines, the product structure has a negative impact on the margin if a growth in Economy Class results from a change in booking behaviour of previous Business Class customers.
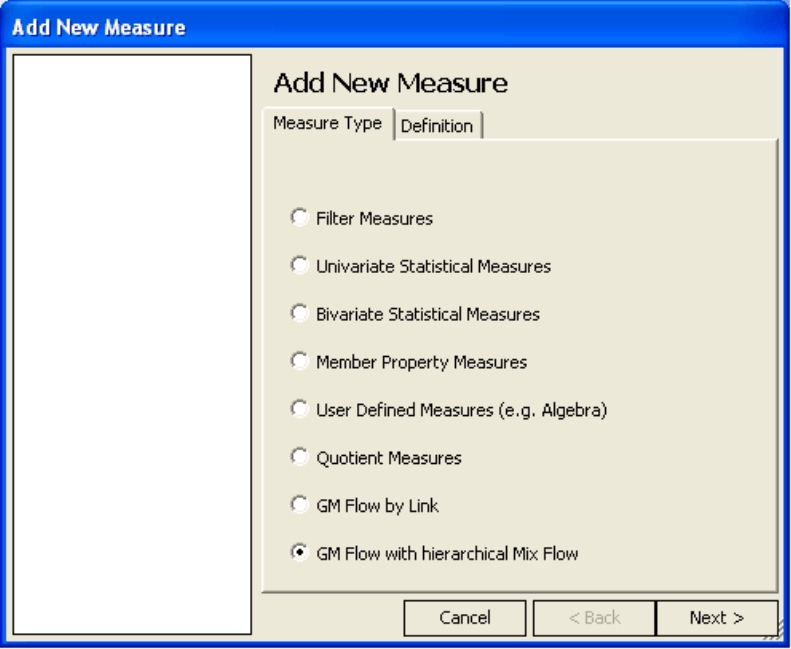
The margin flow calculation is available to you in the form of Measures. So you can start with the Add New Measure Wizard (Model menu). In contrary to the other measure types, the wizard creates not just a single measure but several – to be exact, all values the flow calculation delivers results for. DeltaMaster currently supports two types: Prof. Dr. Jörg Link’s classical approach as well as an extended method with hierarchical structural effects, which we will present in this DeltaMaster clicks! issue.
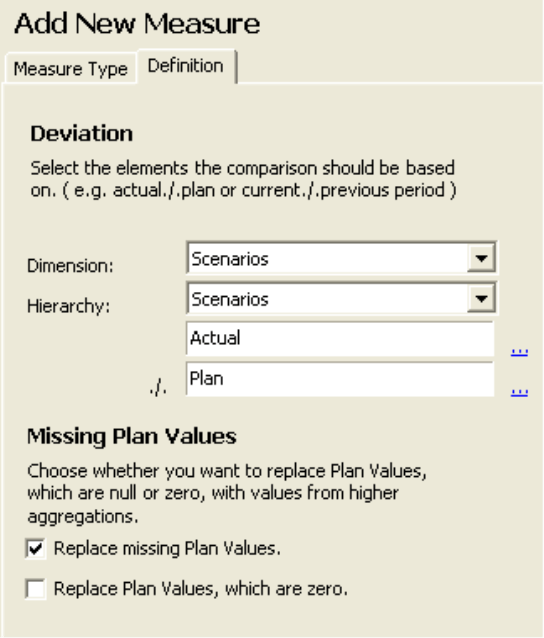
In the top left corner of the Definition dialog, you determine in which dimension the deviation to be examined is located. Most frequently, this will be two scenarios like actual and budget, but differences between two periods (previous year comparison) or similar constellations are just as thinkable for the flow calculation. Since the budget will not be in the same level of detail as the current data in many cases and thus values are missing or set to zero, DeltaMaster offers to calculate with substitute values from higher hierarchy levels instead. If, for example, in our Chair model of an office furniture producer there are no budget values “Chrome Line, Luxury Models, Southern Germany Area I”, the calculation will be based on the value for “Chrome Line, Luxury Models, Southern Germany” or even “Chrome Line, Luxury Models, Germany”.
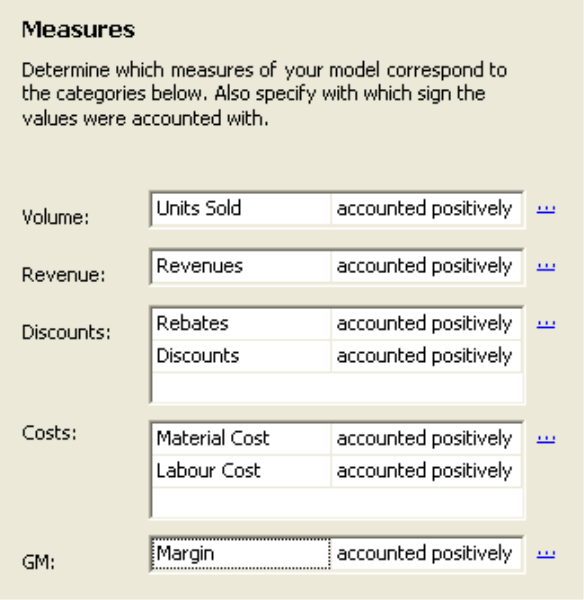
In the Measures section, you assign a treatment to the variables of the margin calculation schema, i.e. you determine in which of them the volume information, the revenues, rebates, costs and margin are stored. Deductible measures are separated into two groups, Rebates and Costs, in order to obtain an assignment according to the causes.
Finally, it is important to decide in which of the dimensions structural effects are to be considered and in which order this should be done. For each selected dimension, DeltaMaster determines its own hierarchical structural effect – called hierarchical because the order of dimensions and levels will lead to a cascade of determinable structural influences. The margins per unit planned for one level (e.g. products) are compared with a reference quantity on a higher level. This quantity is preset through the Method for Comparison; mostly Top element will be the best choice, which means “All Products” in our example.
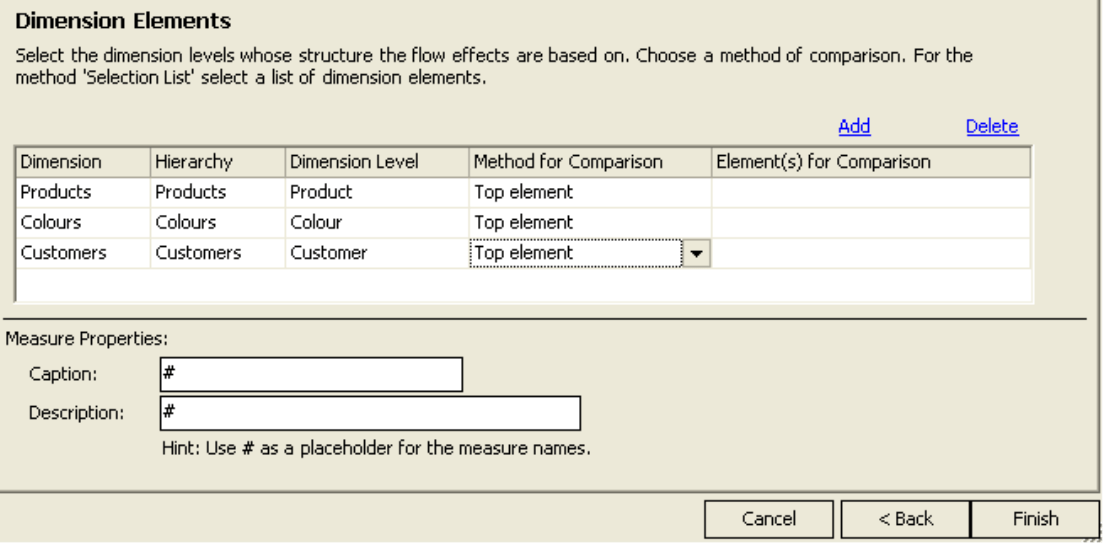
When the algorithm searches for alterations between the products, it computes the difference between the margin per unit planned for a certain product and the average margin for all products. This value multiplied by the deviation in quantity leads to the structural effect to be assigned to this dimension.
With this flexible definition of the variables that are to be taken into account, DeltaMaster’s flow calculation can be used universally for all additive measure schemes in general.
With the given parameters, the wizard is ready to create the required measures. It will also find adequate captions and descriptions on its own. In both text boxes you may enter your own information that will be added to those generated automatically. To assure quick access to the new group of measures, DeltaMaster offers to create a new cockpit of the type measure chart for you right away.
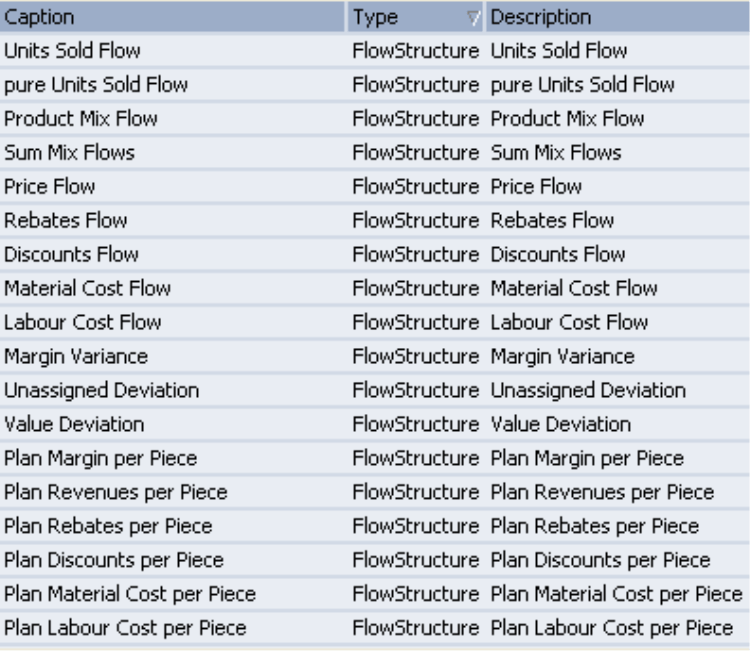
The GM flow calculation with its various structural effects is now modelled. Because the schema is not implemented as an analysis module but as a group of measures, you can integrate each of them into your own cockpits and reuse them in DeltaMaster’s analytical tools, e.g. in a time series or via PowerSearch.
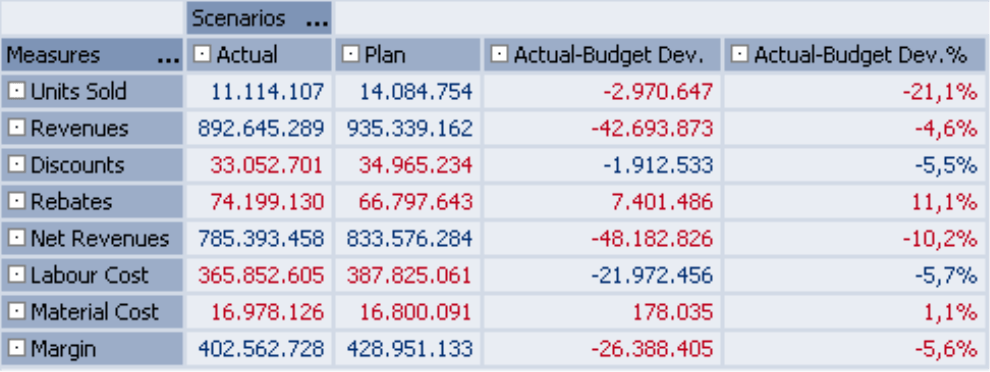
The cockpit created automatically by DeltaMaster ideally complements your “classical” margin presentations. A lot of our clients work with cockpits similar to the one shown above as they neatly display the current and budgeted values including the absolute and relative deviations for the key measures sold units, revenues, rebates, costs and the resulting margin. The (hierarchical) GM flow calculation delivers valuable additional information about how to explain the overall deviation
(-26.388.405 in the table).
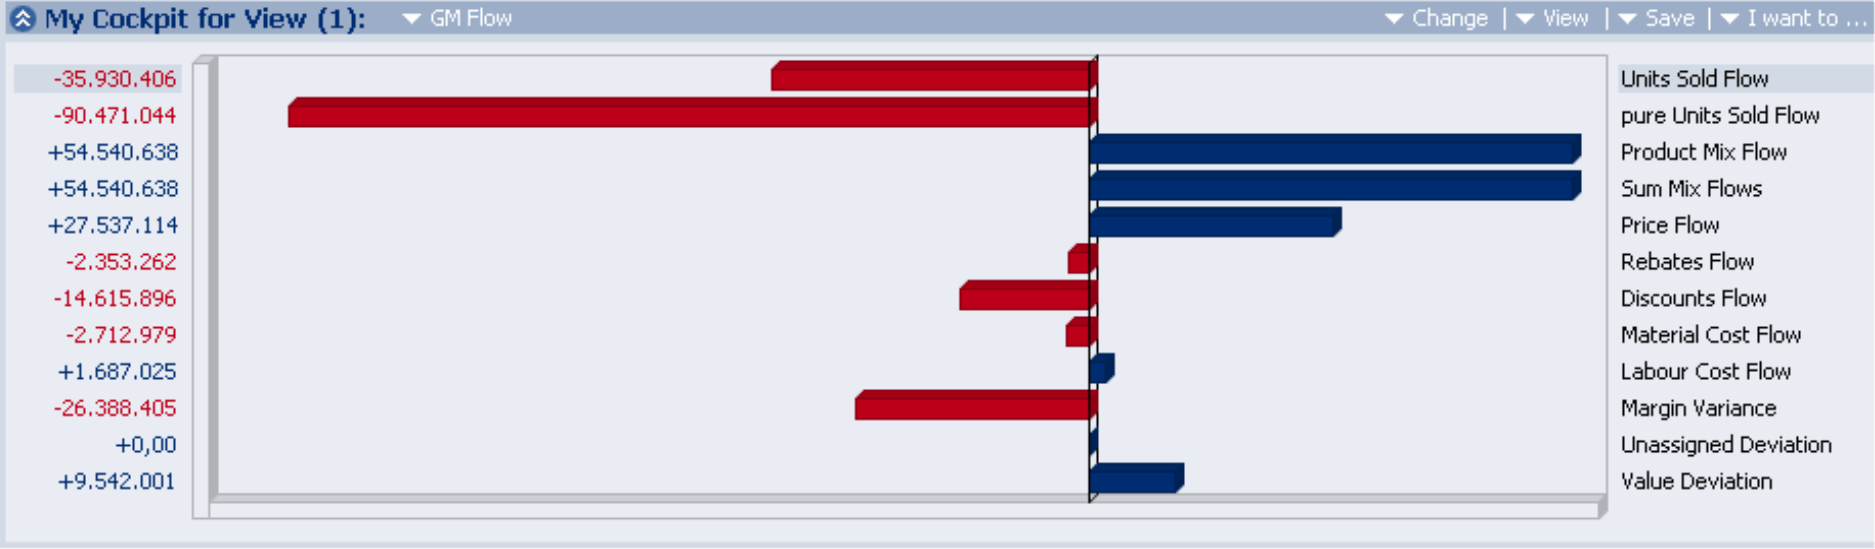
The analysis discovers that the deviation of more than 26 million can be traced back mostly to a change in sold units and rebates: Although sales were below the budget (strongly negative pure Units Sold Flow), we have granted higher rebates and discounts than planned (negative Rebates Flow and Discounts Flow). These two factors are so dominant that the positive effect to the margin caused by higher prices (positive Price Flow) has been more than compensated – thus the observed negative deviation.
It may occur that some amounts cannot be assigned to any flow measure, e.g. refunds/paybacks or credit items. These will be shown in total as unassigned deviation.
Does your company already have flow calculations – deviation analyses, variance analyses, result contribution calculations or whatever their name may be – in use? We will be pleased to introduce them.
