









































How effective information design, DeltaApp, and AI enable management to act.
Why is information available but has no impact?
Companies rarely lack metrics. Dashboards, reports, and KPI cockpits are abundant. Yet in daily work, what leadership needs is often precisely what’s missing: clarity, prioritization, and clear guidance for action.
Leadership today rarely fails due to missing data, but because information has no impact. Numbers must be designed to provide orientation, focus decisions, and trigger action. This article shows how effective information design, DeltaApp, and AI evolve proven business intelligence from reporting to management systems.
Seeing is not understanding: Why charts fail
Charts are still considered a proven means of conveying numbers. But from the perspective of perception research, this is deceptive. A chart is not a picture, but a visual scene that must be interpreted. Colors, shapes, legends, and numbers compete simultaneously for attention.
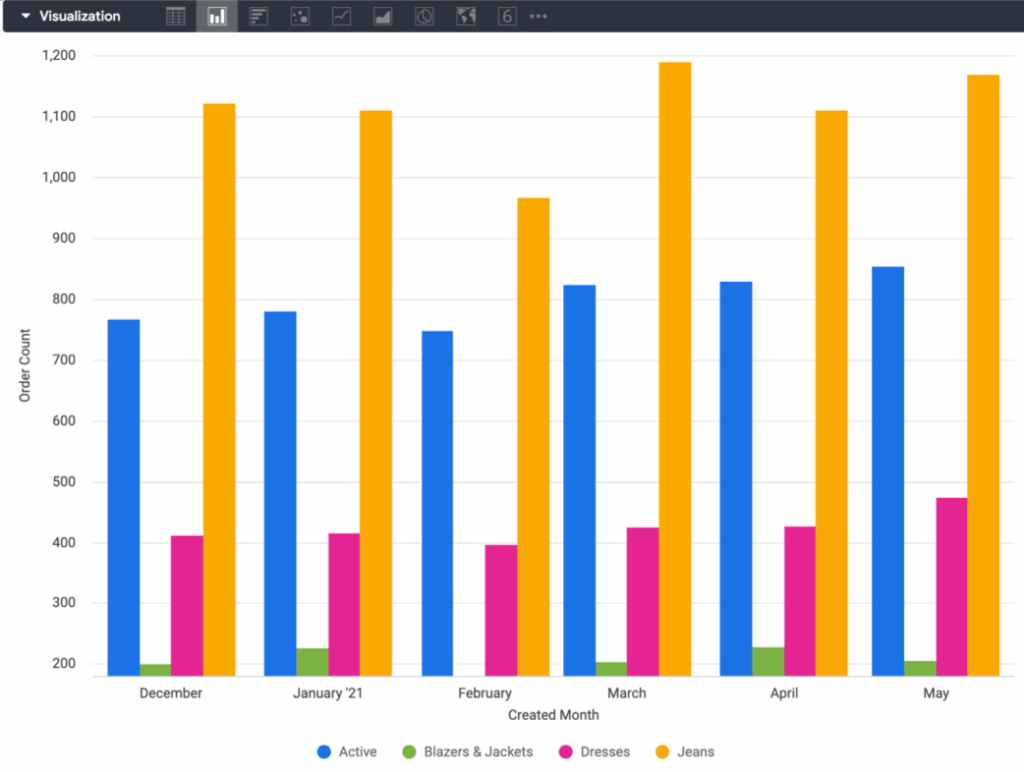
Since seeing and thinking access the same limited resources in the brain, overload doesn’t lead to better understanding but to cognitive paralysis. Decisions are delayed, meetings become explanation sessions. More visualization therefore doesn’t automatically mean better information.
Information design reimagined: See, understand, act
Bissantz has pursued a consistent approach for years: it’s not about omitting information, but preparing it so that even complex matters can be shown completely and without overwhelming the brain. What matters is not the available screen space, but the bottleneck of attention.
The basic principle is: Seeing, understanding, and acting must be designed as a connected process. Information must not only be correct, it must be effective.
DeltaApp: Sequential instead of simultaneous
DeltaApp expresses this approach—and the principle of haptic reasoning. Instead of showing everything simultaneously, it guides step-by-step through decision-relevant information. Reduction to two columns prevents visual overload; clear prioritization replaces competition for attention.
Numbers are depicted using typographical scaling: Larger values are shown in larger type, smaller values in smaller type. Color is reduced and clearly deployed, carrying meaning—not decoration. Perspective changes occur through simple gestures; drill-downs reveal causes where they’re decision-relevant. This creates an analytical dramaturgy that follows thinking instead of blocking it.
How Leica leads with DeltaApp
At Leica Camera AG in Wetzlar, DeltaApp was established early as the primary leadership instrument at board level. The then-CFO Dr. Thomas Riegler consciously decided against conventional, static reports and for a radically focused approach to numbers.
In management practice, this meant: no piles of reports, no prepared presentations. Instead, DeltaApp was used live in meetings. Anomalies were identified together, causes immediately analyzed, and decisions directly derived. Confidence emerged not through completeness, but through clarity.
One sentence captures this attitude: “I see more when I see less at once.” Focus on the essential here isn’t just a design principle, but a conscious leadership decision—in harmony with Leica’s DNA.
Key takeaways for decision-makers
- Leadership is based directly on the numbers: Decisions emerge live in meetings, not subsequent to reports.
- Clarity replaces coverage: Focused view of essentials becomes the foundation for responsible decisions.
- Meetings lead to results: Discussions shift from understanding numbers to consequences and next steps.
How auto dealerships manage with DeltaApp
Large and medium-sized automotive dealerships in Germany also use DeltaApp as their central access to corporate management.
The focus is on making decisions earlier, closer to operations, and thus able to act while room for maneuver still exists. DeltaApp serves as a handheld management tool: usable between appointments, in the dealership, in conversation. Conspicuous developments become immediately visible, causes can be analyzed with a few gestures and translated into concrete next steps.
Particularly in the demanding environment of auto retail, sequential, haptic thinking unfolds its strength. Complexity isn’t reduced, but made manageable so that action is motivated and effective.
Key takeaways for decision-makers
- Management is possible anytime: Relevant metrics are available where decisions are made and action is taken.
- Earlier detection creates room for action: Leadership can intervene while options still exist.
- Complexity becomes actionable: Causes can be analyzed step-by-step and measures can be derived.
BI with AI: From management information system to management system
Artificial intelligence can effectively extend business intelligence—when properly deployed. Language models are very well suited for text processing, but not for calculation. In controlling, this is a hard boundary.
Bissantz therefore insists on a clear architecture: AI doesn’t work directly on numbers, but rather on results that have been fully and reproducibly calculated beforehand. This is made possible by the Deterministic Analytics Engine (DAE). It ensures that results are calculated rather than guessed—traceably and without hallucinations.
OOn this basis, AI shows its true strength: it links metrics, condenses complex situations, makes risks visible, and translates analysis results into concrete, situation-specific action recommendations. This transforms BI into a management system that doesn’t just inform, but prepares decisions and supports action.
Effective information as a management system
In the end, it’s not about more data, more dashboards, or more automation. It’s about a management system in which information is designed to provide orientation, focus discussions, and enable consistent action.
Or put differently: Success doesn’t emerge because people see more numbers, but because numbers are designed so people can hardly help but act correctly.