![]()
Greetings, fellow data analysts!
It’s often the little things in life that make a big difference. How on earth did we ever survive back in the days before Blackberries, one-button coffee makers, or our beloved iPods? These and other modern necessities have one thing in common. They simplify our lives by saving us time or using it wisely. After all, everyone has it – but most of us would like more. And until someone invents a way to get more than 24 hours out of a day, it’s all about finding new ways to save a few minutes (or seconds!) wherever possible.
DeltaMaster, too, has many little amenities that save valuable time in analytic reporting. That’s why we won’t waste another second of your time to introduce yet another practical, time-saving feature – namely, time-analysis members!
Best regards,
Your Bissantz & Company Team
![]() Regardless of the analysis model in use, we often find ourselves on the pursuit of changes over a period of time. We may compare current revenues to the previous month or year, contrast the capacity utilization of the current quarter to the previous one or analyze the cumulated personnel costs of the current and previous years. To support us in this task, DeltaMaster offers Time analysis members, which we can define on an auxiliary axis (i.e. dimension) under names like “Presentation”, “Period view” or “Time utility“. With its help, you have a second “switch” to access other time periods from the current one as well as to investigate variances or aggregations.
Regardless of the analysis model in use, we often find ourselves on the pursuit of changes over a period of time. We may compare current revenues to the previous month or year, contrast the capacity utilization of the current quarter to the previous one or analyze the cumulated personnel costs of the current and previous years. To support us in this task, DeltaMaster offers Time analysis members, which we can define on an auxiliary axis (i.e. dimension) under names like “Presentation”, “Period view” or “Time utility“. With its help, you have a second “switch” to access other time periods from the current one as well as to investigate variances or aggregations.
The cockpit to the right shows gross margin figures for June and May 2007, their absolute and relative variances as well as the figures and variances compared to the same period a year ago (June 2006) for our fictitious company “Chair AG”. The period references in these columns are based on the time analysis members from the presentation dimension and were selected and arranged in the Axis definition of the pivot table.
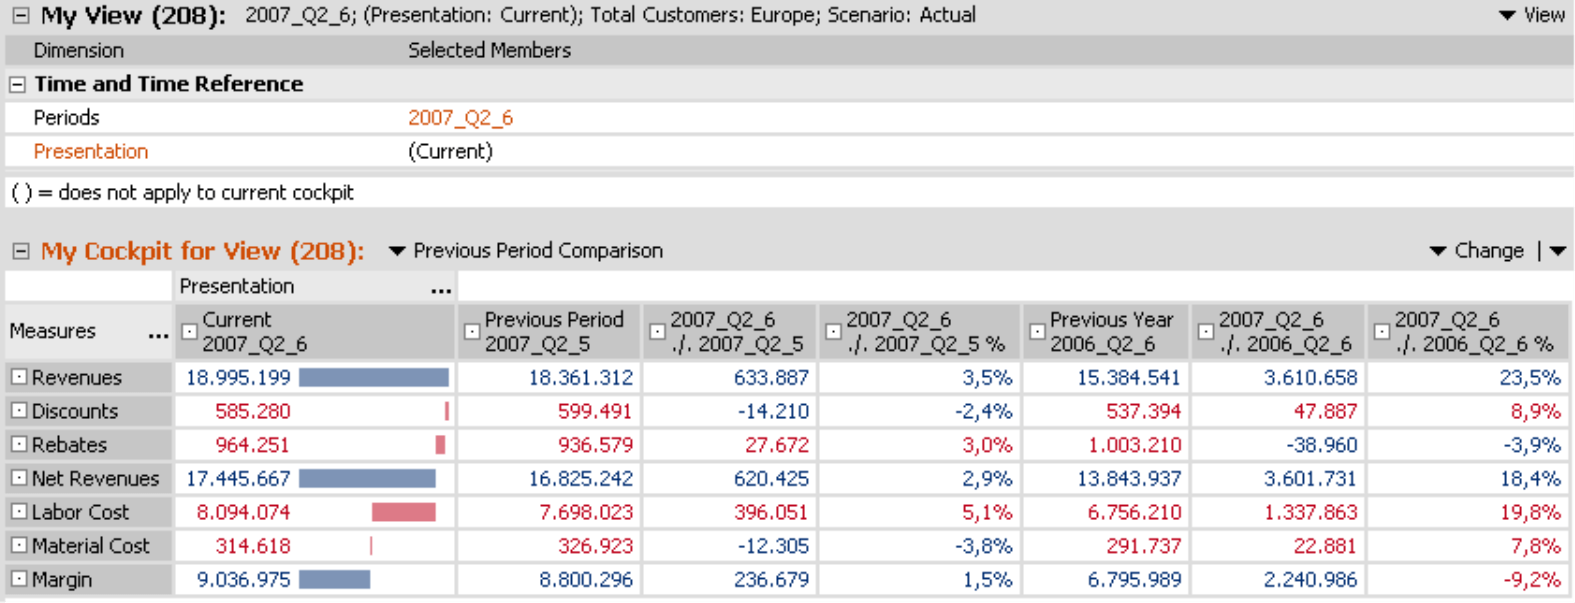
The advantage of time analysis members is that all measures are only stored once as “current” (i.e. period values) in the database. As a result, we can cope with all other time-based operations directly in DeltaMaster and without needing to access the database. With this commonly practiced modeling trick, we can analyze every measure in our model over time with one go – and we do not need to create filter values or other individual measures. As a result, the example above gives us an overview of all KPI’s including the calculated “DeltaMaster measures“ for net revenues and margin. The only requirement is that one of the dimensions must be marked as a time dimension. If we have not done that already, we simply need to set Time as the Dimension type (in context menu of the respective dimension in the My view window).
Auxiliary axis
We recommend allotting a separate dimension, which we will call “Presentation”, for period references in the data model. (In theory, all other dimensions could accommodate time-analyis members, but such a model design is not recommendable as redundancies would be inevitable.) This type of presentation dimension usually only has a single member, such as “current” or “period value”.
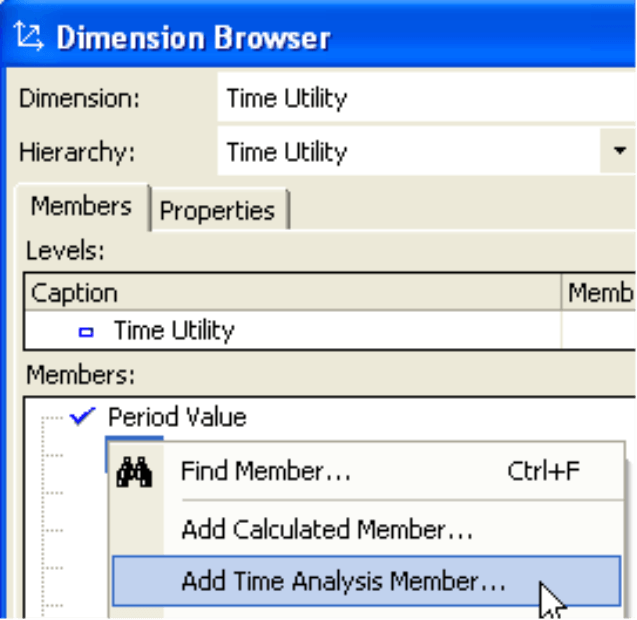
To define the Time analysis member, we use the editor called from the context menu or the I want to… menu of the Dimension browser. Here we can create multifaceted references to other periods.
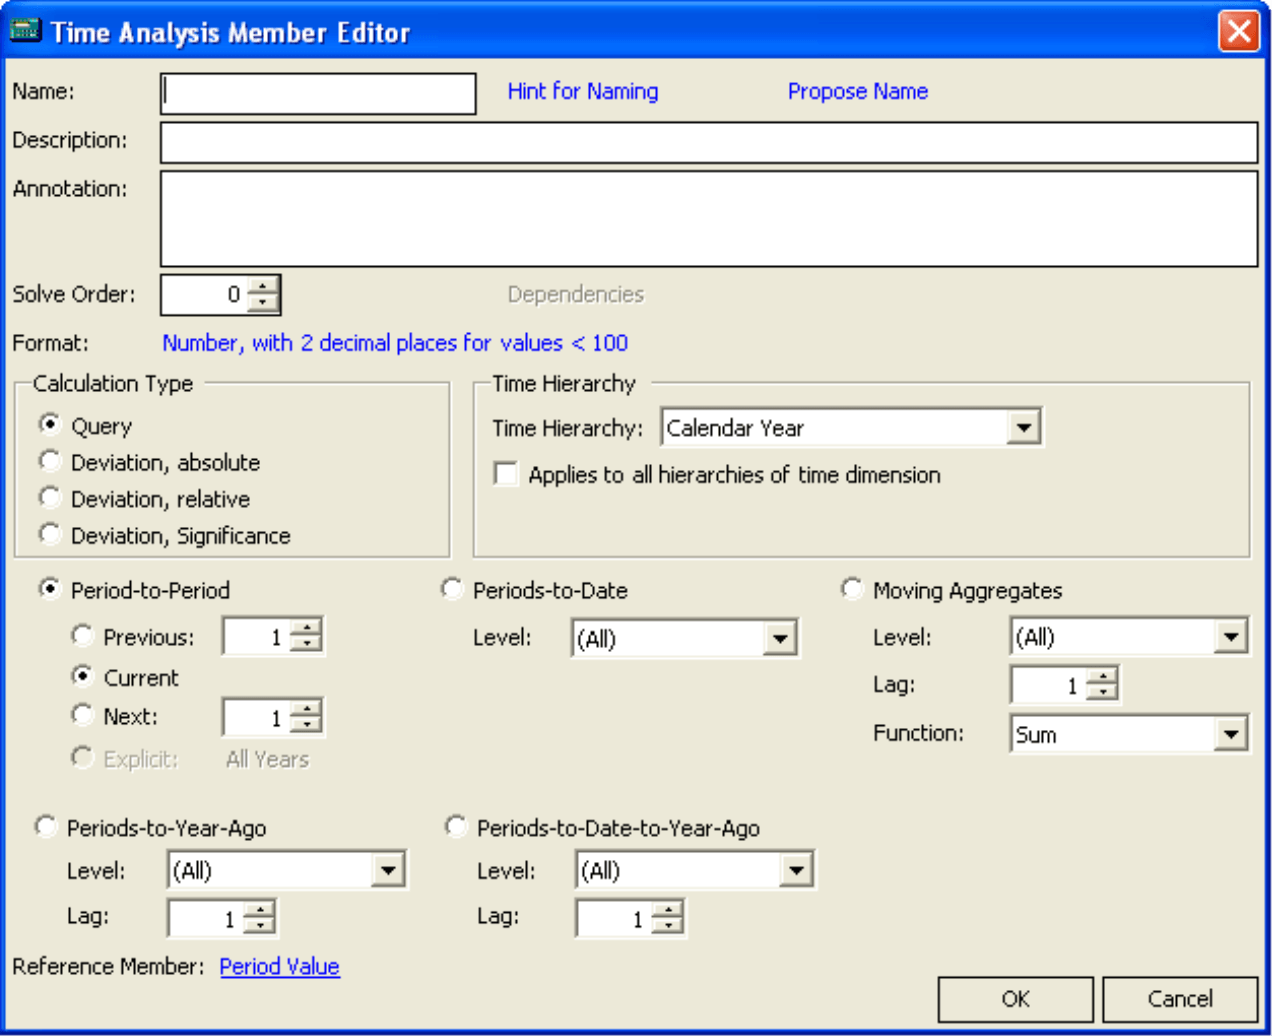
We will need to enter a Name, which can contain variables that DeltaMaster replaces with the referenced period when displayed in cockpits and reports. This function will be explained in detail on page 5.
The Annotation and Description, which is displayed as a tool tip in the Dimension browser, can be used for documentation. Solve Order determines the sequence of the calculation, which can play a major role in some cases. The settings for this parameter depend on the underlying database. The Format of the displayed numbers (e.g. the desired number of decimal places) is also set in this dialog box.
Calculation types
Time analysis members allow us to access other time periods from the current one. A “time period” can be a month or a quarter; it simply means any member on a time axis. There are four calculation types for accessing “parallel” time periods:
- Query delivers the value for the referenced periods for the respective measure.
- Deviation, absolute determines the absolute difference between the value for the period shown in the view and the one resulting from the “Presentation“ dimension: “current value – referenced value“.
- Deviation, relative returns the relative difference or the percent variance based on the period shown in the dimension: “(current value – referenced value) / referenced value“.
- Deviation, significance, the product of the absolute and relative variance, helps to correctly classify deviations. For example, a high percentage variance would not be not alarming if the underlying figures were only small absolute values. On the other hand, a large absolute difference may still be acceptable if it is small as a percentage. Although significance measures are almost impossible to interpret as far as content is concerned, they help steer our attention to the really important information.
Selecting periods
In the lower part of the window, we determine the element to be referenced by the Time analysis member. The idea is always to “shift” in relation to the time period selected in the time dimension.
- Period-to-Period delivers values for time periods on the same level as the initial time period. If the view shows a month, DeltaMaster will deliver the values for a previous or following month (or the variance depending on the calculation type). If we have selected a quarter, we will see the figures for previous or following quarters. We can even create a Time analysis member for the current period and add a variable to its name to display the “current” time in reports and analyses. Explicit allows us to select a member that should remain static when the view is changed (e.g. for comparisons).
- Periods-to-date aggregate the values that are on the same level as the view and have the same parent member. In other words, the level determines within which branch of elements DeltaMaster performs the cumulation. In a hierarchy with the levels “All – Year – Quarter – Month“, we would typically choose the year. The period cumulation is only possible for the “Query” calculation type.
- Moving aggregates such as an average of the past six months, a sum of the past three months, or a twelve-month high also require an entry regarding the level. The aggregation takes place through as many members of the given level as specified in the Gap. For a rolling six-month average, we would select “month” as the level and six as the gap. Rolling aggregations are only possible for the Query calculation type. To create calculations across different levels, read DeltaMaster deltas! 5.2.1, Nr. 25 for more information.
- Periods-to-year-ago refers to the member located in a previous period on the same level and in the same “place” as the current selection. If the gap is set at 2 and August 2007 is the current view, we will get August 2005; if Q3 2007 is the current view, we will get Q3 2005. In the editor, we simply tell DeltaMaster on which level it can locate the years. In other words, to determine the parallel member, DeltaMaster first looks up to the level that is selected in the editor, then moves as many steps as stated in the Gap on this level, searches in the hierarchy below to the level of the initial member and searches for the same placement as the initial member – for example, the eighth one for August.
- Periods-to-date-to-year-ago works in the same fashion to determine the parallel member. Instead of selectively delivering the associated value, however, it aggregates the values from the first member to the current value.
Period-to-period values and deviations can also be calculated when several time periods are selected in the view (multiple selection).
Naming time analysis members
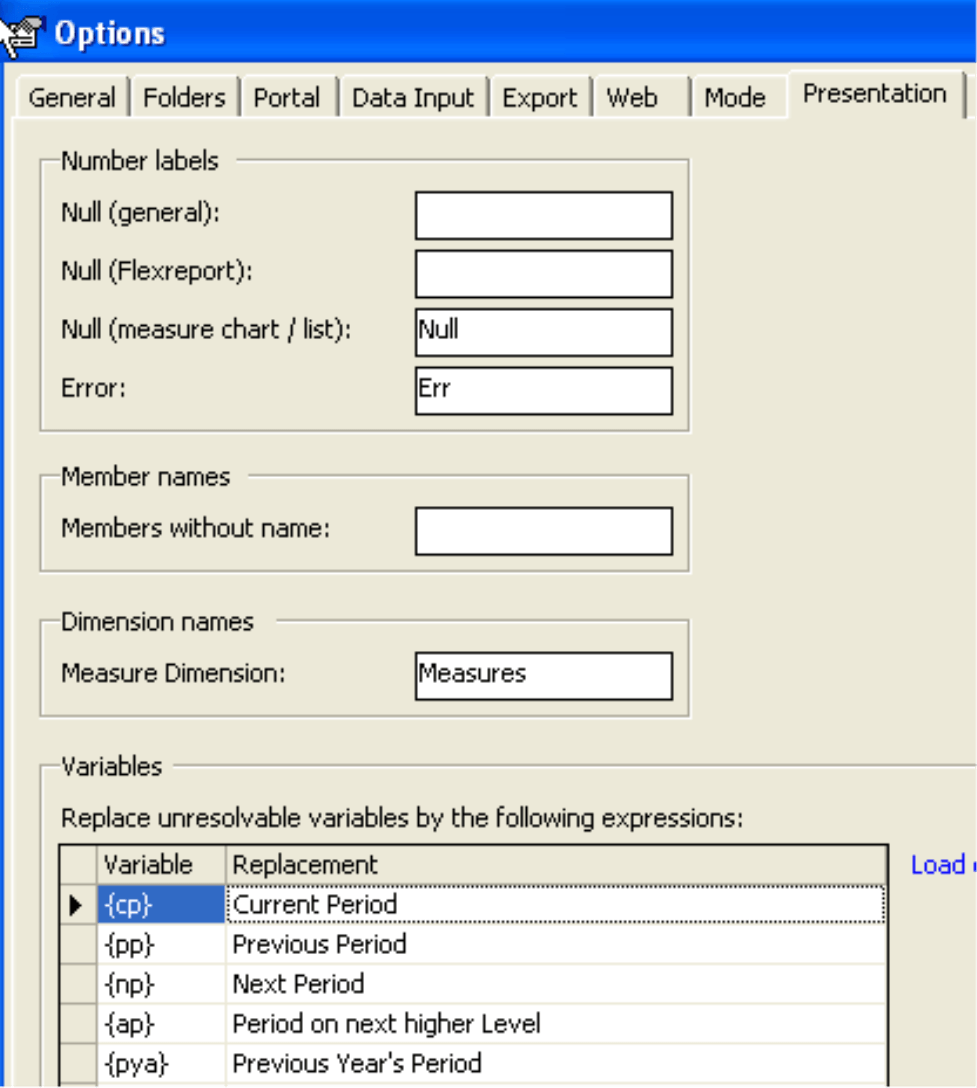
We can add variables to the names of time analysis members to improve the readability of our reports. Instead of abstract column headlines such as “Current” and “Last month”, DeltaMiner would list ”August 2007“ and “July 2007”. The following table shows the list of supported variables.
| Variables | Explanation | Examples (Selected period is “2007_Q3_8“) |
| {cp} | Current period | {cp} = 2007_Q3_8 |
| {pp} | Previous period; equivalent to {pp1}. | {pp} = 2007_Q3_7 |
| {ppX} | Previous period with gap X. | {pp1} = 2007_Q3_7
{pp6} = 2007_Q1_2 |
| {np} | Next period; equivalent to {np1}. | {np} = 2007_Q3_9 |
| {npX} | Next period with gap X. | {np1} = 2007_Q3_9
{np6} = 2008_Q1_2 |
| {apY} | Ancestor period on level Y. The levels are counted in the hierarchy “from the top“ starting at 0. | {ap0} = All years
{ap1} = 2007 {ap2} = 2007_Q3 {ap3} = 2007_Q3_8 |
| {apY,X} | Ancestor periods on level Y and with gap X. The levels are counted in the hierarchy “from the top“ starting at 0. A positive gap goes from the chosen time period in the past. | {ap1,0} = 2007
{ap1,1} = 2006 {ap1,2} = 2005 {ap2,0} = 2007_Q3 {ap2,1} = 2007_Q2 {ap2,2} = 2007_Q1 {ap2,-2} = 2008_Q1 |
| {pyaY,X} | Period to year ago on level Y and with gap X. The levels are counted in the hierarchy “from the top“ starting at 0. We would normally use the one containing the years (in this case 1). | {pya1,1} = 2006_Q3_08
{pya1,2} = 2005_Q3_08
|
If desired, DeltaMaster can automatically Propose a name: the selected calculation type and the period reference will be taken into account for this. The recommendation for relative variance compared to the previous period, for example, is “{cp} ./. {pp1} %“, which would, for August 2007, translate to “2007_Q3_8 ./. 2007_Q3_7 %“ using the terminology above. This type of labeling is much more informative than simply saying “Variance to previous period”. If we defined a rolling aggregation with a gap of 3 and the function “average”, DeltaMaster would suggest the name “Ø ({pp2} through {cp})“ and the report would display “Ø (2007_Q2_6 to 2007_Q3_8)“. Due to the longer names, the columns in the pivot table will be wider. We can prevent this effect, however, by adding two empty spaces in the name, which will prompt DeltaMaster to create a line break in the pivot table. This trick was used in the first illustration on page 2.
If the period offset leads to elements not available in the database or the variables cannot be resolved for some reason, DeltaMaster will display a substitute caption, which is stored under Extras, Options, Presentation.
These placeholders are available in:
- Pivot cockpits and analysis results
- Flex report cells
- Report and briefing book titles (read DeltaMaster deltas! 5.3.1, Nr. 8 and 13 for more information).
Multiple hierarchies in the time dimension
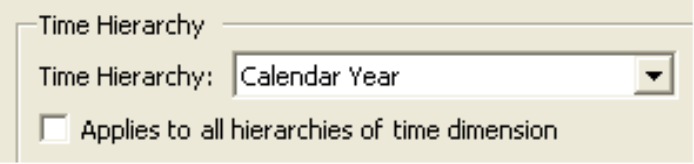
If a time dimension contains several hierarchies, it makes sense to create Time analysis members for all Time hierarchies. In this case, the editor for Time analysis members contains a separate area in which we select the hierarchy in which the calculated member should be valid, or if it should apply to all hierarchies, no matter which of them is currently active. For the latter option, the hierarchies need a similar structure, i.e. the same number of levels and an identical lowest level (e.g. months).
Questions? Comments?
Just contact your Bissantz team for more information!
