![]()
Dear data analysts,
physicists define density as the ratio between mass and volume. Following this formula, we speak of information density when we are interested in the amount of information – how many figures, measures, data points – represented in a certain space or area. In order to improve the information density, i.e. to increase it, arithmetics allow only two alternatives: increase the numerator by showing more values, or reduce the denominator by downsizing the required space.
As a concept working on both factors, you have already got to know sparklines that hone the information density by providing additional specifications about a referenced value. Another interesting option is to think about ways to move more values into the field of vision – and this is what DeltaMaster’s combination cockpits are made for. By their help, you subsume several cockpits and analysis templates into a single cockpit and thus increase the information density of your workspace.
As usual, we will be happy to answer all your questions about this and other issues!
Cordially,
Your Bissantz & Company team
In many DeltaMaster analyses you can choose between a tabular and a graphical view or display both variations at the same time next to each other. A prominent example for this is the ABC analysis that by default shows the element table left of the concentration curve. As this is a pure “matter of view”, both alternatives naturally refer to the same matter of analysis. Contrary to this, bringing various issues together into one screen is a job for our combination, or shortly, combi cockpits.
As a kind of „cockpit from cockpits“, a combi cockpit puts other already existing cockpits or analysis templates together in order to give a greater perspective. Here are some examples:
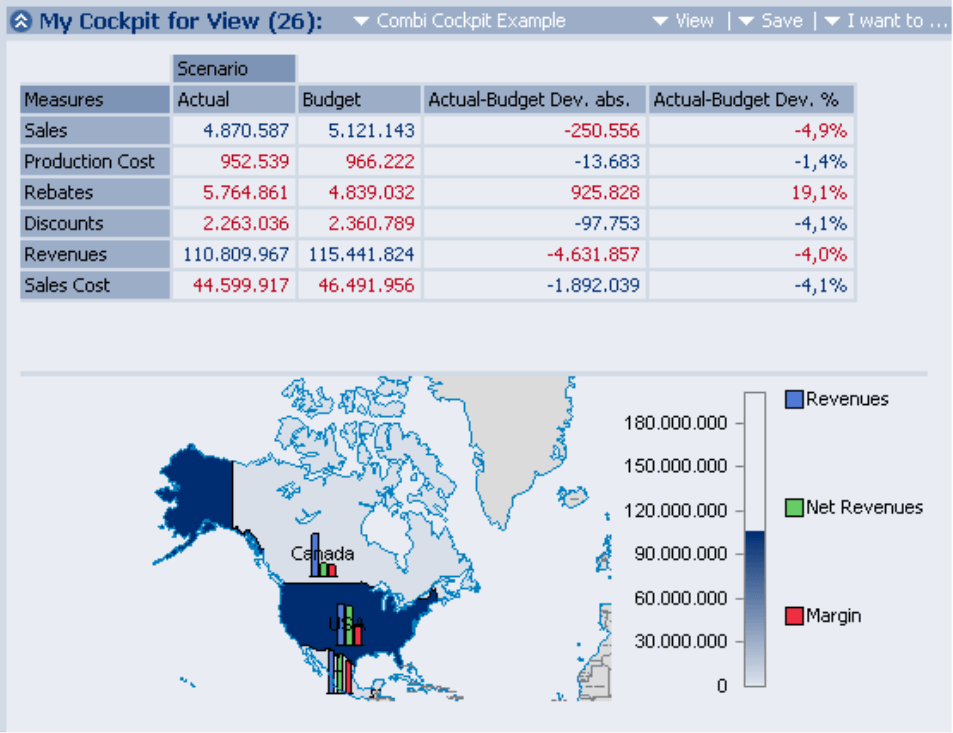
- A detailed budget deviation comparison should be combined with a regional revenues overview. The combi cockpit consists of a flex report (cockpit) and an analysis result (geo analysis). A change of the current view impacts both components at the same time.
- Friends of the “Balanced Scorecard“ concept recommend to group the multiple corporate goals into perspectives, typically finance, customer, process and innovation/learning. These should be contemplated in parallel and equipped with their respective figures and ratios. Such “scorecards” from different company segments can be created as individual cockpits and then linked to a combi cockpit.
You create a cockpit of the combination type just like the other types, using the function Create cockpit in the Change menu.
Designerware
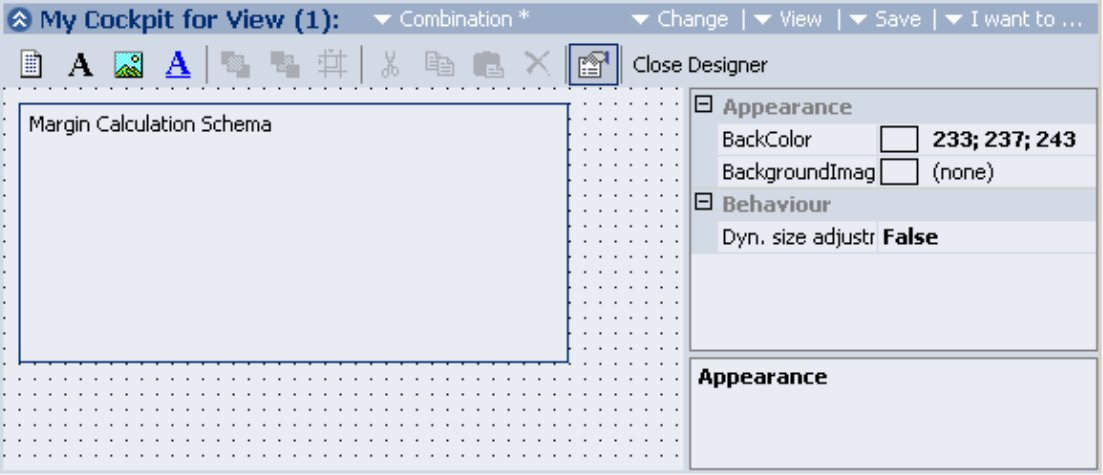
The new cockpit is initially empty and will be displayed in design mode in which you can fill it with its contents. On the upper part of the window you can see a toolbar that enables you to insert, align and copy the desired components of your cockpit. On the right side is the properties window that, as an alternative, allows you to determine all parameters of the active object (e.g. position, size, or colors) precisely.
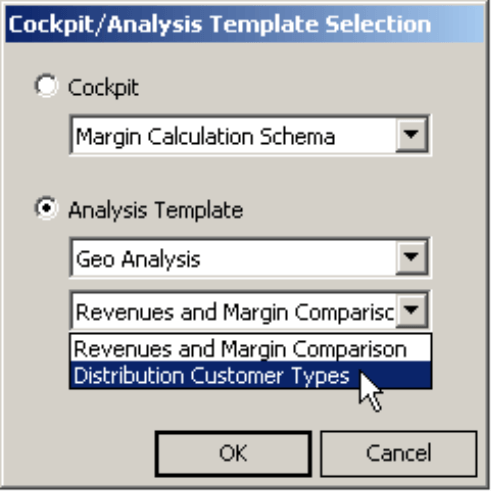
Click on the symbol Add Cockpit/Analysis Template and then drag a rectangular frame in the empty grid with the mouse at the position you want your new object to appear. A dialog appears and lets you choose which of the existing cockpits or analysis templates you want to use.
Analysis Templates
This is where the concept of analysis templates gets relevant. Reason enough to take a closer look at it.
- Cockpits and (cockpit) reports The values displayed in the cockpit follow the active view at any time. If you save a cockpit as a cockpit (and not as a report), you conserve its structure, its definition, formatting options and other things, but not the view. When you reopen this cockpit at a later point, DeltaMaster delivers the same figures including all formats etc. from the time you saved the cockpit, but with other values, according to the now current view. Only if you save the cockpit as a report, the associated view will be restored when you open the report later.
- Analysis templates and (analysis) reports The same separation of definition and view can be found in the built-in analysis methods: When you save an analysis result as a report, you preserve the current status including the active view. If you reopen the report, DeltaMaster switches to the saved view. In contrary, in the analysis template only your settings for the analysis method are saved, but without any link to a view.
As a conclusion, we can state: Cockpit reports and analysis reports will always be saved with their respective views. However, the cockpits themselves as well as analysis templates are always neutral in respect to a view.
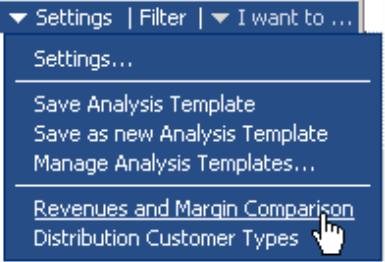
As the analysis settings vary greatly depending on the method, the templates are saved, organized and called per method. You can find the relevant commands in the settings menu or on the analysis templates tab in the settings dialog of each analysis method.
Dynamic Combi Cockpits
Via the I want to menu, you close the designer window and quit the editing mode. The cockpit is now displayed “live” with the values of the active view. Subsequent modifications in the basic cockpits or analysis templates will impact the combination cockpits in which they are used. To make the new cockpit available permanently, do not forget to save it – again, either as a cockpit to display all values according to the current view, or as a report with a preset view. This way you can provide your internal “customers” with attractive, information-dense management reports.
