![]()
Greetings, fellow data analysts!
There are certain words in a foreign language that are just difficult to translate. The German word “schadenfreude,” for example, simply has no punchy English equivalent. Most people, therefore, prefer to use the original term instead of paraphrasing it into ‘the pleasure taken from observing the misery of others’.
In an artificial language such as MDX – the standard query language for OLAP databases – that can be a bit more challenging. Defining a measure like production costs (for the sake of simplicity, the sum of labor and material costs) is relatively easy in English. In MDX, however, you have to formulate that in a very roundabout expression. The reason is that MDX doesn’t understand hierarchies in measures.
That’s where DeltaMaster comes to the rescue! In this case, you can still create the desired hierarchies with just a few clicks of a mouse. We’ll show you how in this edition of clicks!.
Best regards,
Your Bissantz & Company Team
Hierarchies are commonplace in the dimensions of OLAP models. You can summarize characteristics such as customers, products, suppliers, materials, accounts, cost centers, routes, equipment, contracts and time into groups. You then use these groups to create hierarchies, often times with multiple levels, so that you can later search for general or detailed structures depending on the question at hand. The MDX query language provides a powerful way to navigate through multidimensional data and clearly articulate which calculations should be run on which data. DeltaMaster automatically generates these MDX expressions and queries the OLAP database exactly as you state it should. You can also create your own MDX queries to execute very individual tasks.
MDX is a highly eloquent language for hierarchies in ‘normal’ dimensions. However, it does stutter at times – of all places in measure dimensions, which are absolutely crucial in analytic applications. MDX simply cannot deal with hierarchal relationships among measures. In other words, it cannot portray parent-child relationships among measures. As a result, if you use MDX to access an Infor PM OLAP (MIS Alea) or IBM Cognos (Applix) TM1 database, their measure dimension appears flat because the hierarchy has been dissolved. Microsoft Analysis Services, in comparison, doesn’t use measure hierarchies at all. Either way, the measures are positioned on the same level as if they had nothing to do with each other – even when the business relationships are very clear and easily describable.
In cases like these, it’s a good thing that you have DeltaMaster! DeltaMaster enables you to close the linguistic gaps in MDX, generate the desired additive relationships yourself, and render this in your reports. For example:
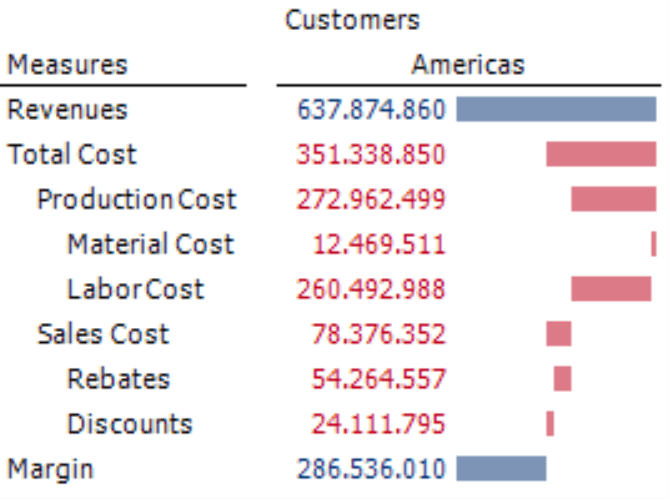
DeltaMaster automatically applies indentations to emphasize hierarchal relationships. In this waterfall chart, DeltaMaster outlines the value relationships of the broken-down parts. The bars of parent measures (for example, ‘production’ or ‘sales’ costs in the chart on your right) are divided up and presented proportionately in the indented child rows.
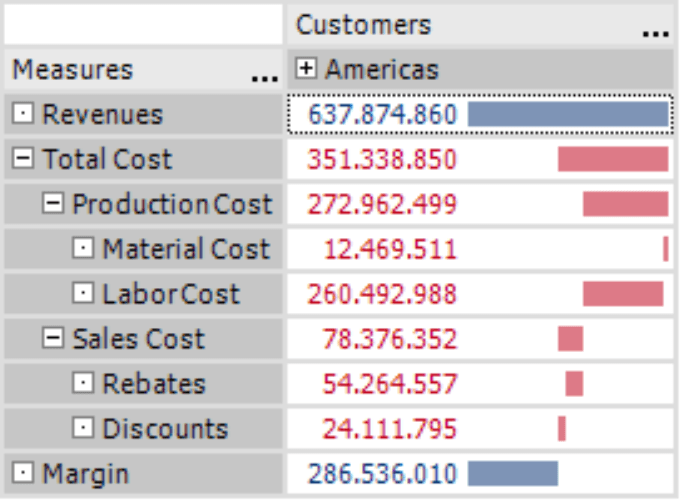
In the interactive user modes, you can expand and collapse the measures by clicking the plus or minus signs in the pivot table – just as you would in a regular dimension.
If you are using DeltaMaster in Pivotizer mode and higher, you can create hierarchal relationships and perform all of the steps described from here on forward.
Defining sum measures from the database or in DeltaMaster
Let’s use an example: different cost types that can be added together. In the ‘Chair’ reference model, you could condense ‘Material cost’ and ‘Labor cost’ into ‘Production cost’.
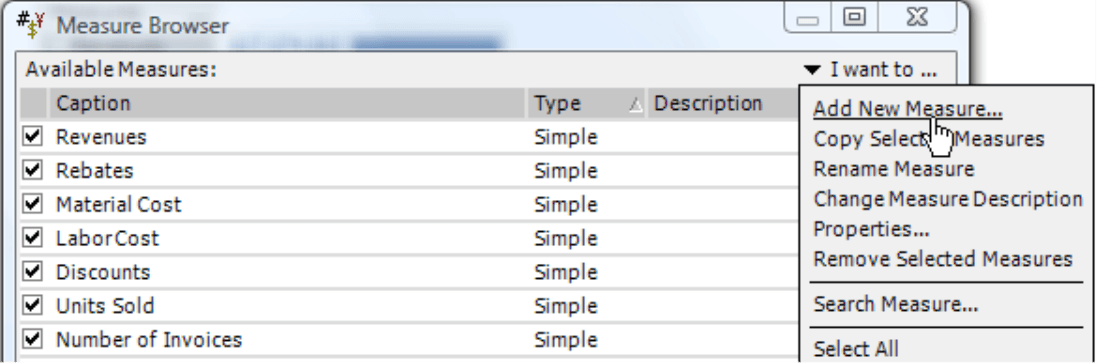
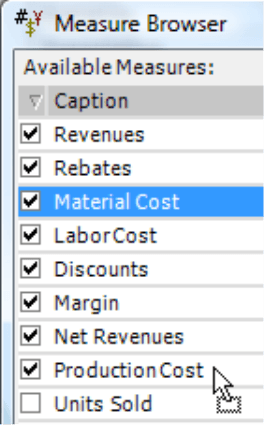
Since this sum is still unknown in your application, you will need to define it as a new measure. Simply open the Measure browser (Model menu) and Add [a] new measure (I want to… menu).
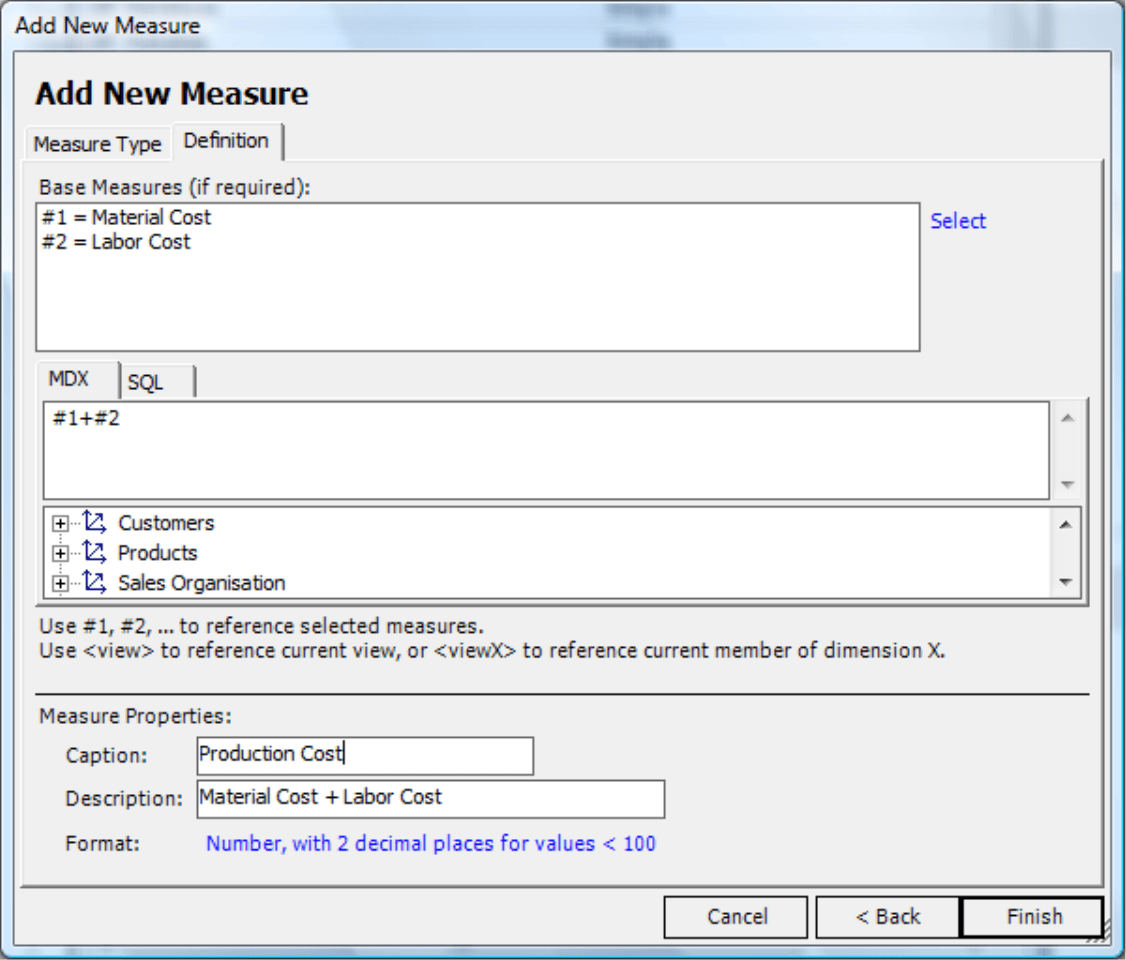
This new measure is user-defined. You can define it very simply as the sum of material and labor costs as shown in the screenshot on your right.
Please note that this step is not mandatory to create relationships between values. You could have just as easily worked with ‘Production cost’ which are defined directly in the database. However, since the ‘Chair’ reference model does not contain this measure in the database, you had to first create it yourself.
Building hierarchies
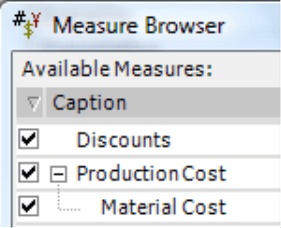
To place the desired hierarchy in the Measure browser, press and hold the Alt key on your keyboard and use your mouse to drag and drop the components to the sum measure. The screenshot on your right shows the first step: dragging ‘Material cost’ into ‘Production cost’.
If you now drop the measure in question (i.e. ‘Material cost’), DeltaMaster will place it in a hierarchy that is subordinate to the measure where you have dragged it (i.e. ‘Production cost’). Since there previously was no hierarchical level under production costs, DeltaMaster will add it automatically.
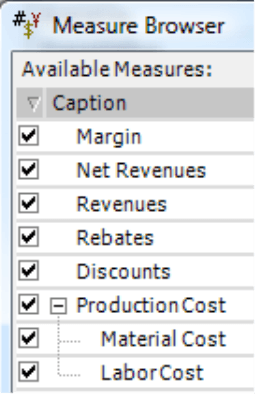
To add the second subordinate measure, you simply repeat the same procedure. Press and hold the Alt key on your keyboard and drag and drop ‘Labor cost’ onto ‘Production cost’.
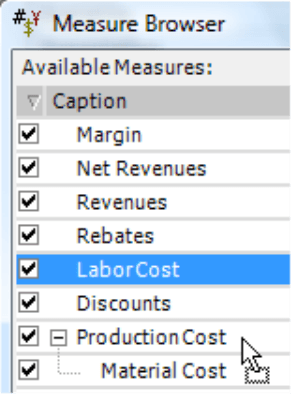
If the hierarchical level already exists, the newly added values will be always placed at the very end. To sort the measures within the level, simply drag and drop them – without using the Alt key – to the desired position.
You can use this same procedure to create multi-level hierarchies. Each time that you drag and drop a measure while pressing and holding the Alt key, DeltaMaster will first create the level (if it does not already exist) and then position the moved value into a lower level. You can also add measure hierarchies in other hierarchies in order to create entire measure trees with multiple levels.
In the example on your right, we have also defined ‘Sales cost’ based on ‘Rebates’ and ‘Discounts’ as an additional hierarchy.
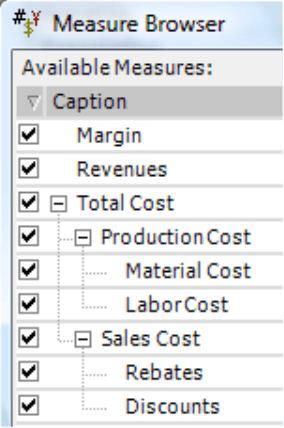
If you drop a measure or a measure hierarchy into a dimension, DeltaMaster will not display it individually in the Measure browser. It will, however, display its structure. Each measure can only be used in a single hierarchy. Therefore, if you want to use the same measure in several measure hierarchies, you will need to create a copy as a user-defined measure.
Usage is restricted to sums!
When you use this approach, DeltaMaster presumes that all of the compiled measures should be added together. Therefore, you need to ensure that this visual sum is really defined as a sum in the database! Organizing measures into hierarchies simplifies the overall handling (e.g. expanding and collapsing levels) and their visualization in reports; it does not, however, imply new calculation rules. In general, you could create hierarchical relationships with any measure you please. In only makes sense, though, when the relationship is mathematically correct and backed by business rules. In other words, the sum of the child nodes must equal the value of the parent node. DeltaMaster cannot monitor the content of these relationships. Therefore, it is up to the report editor to apply the hierarchal levels correctly.
Building hierarchies
You can remove a measure from the hierarchy by pressing the Del key or selecting the Remove selected measures option in the context menu. The measure, however, will remain in the model. Before DeltaMaster will delete a measure from the application, it will first ask you to verify if you really want to remove it permanently. It will not perform this security check when dissolving a hierarchy because the measure in question only appears at a different location in the list. Therefore, even if you use the exact same key to remove a hierarchy and delete a measure entirely, you will definitely notice the difference.
Questions? Comments?
Just contact your Bissantz team for more information!
