![]()
Dear data analysts,
The automotive industry sees hybrid engines, the combination of combustion engine and electromotor, as a technology for the future. The Toyota Prius was the first hybrid vehicle to go into mass production. Its sales figures testify to the growing interest, with around 175,000 units sold in 2005. The advantages of hybrids are low levels of energy consumption and emissions, as well as an increase in the level of performance. This increase is thanks to the engine’s flexible capacity for developing torque.
DeltaMaster also uses several “engines” at the same time. You already have the proven OLAP technology: now you can attach the integrated SQL engine as needed to get relational access to your data. In this issue of clicks!, we want to show you how to make truly effective use of this “dual engine.”
Kind regards,
Your team from Bissantz & Company
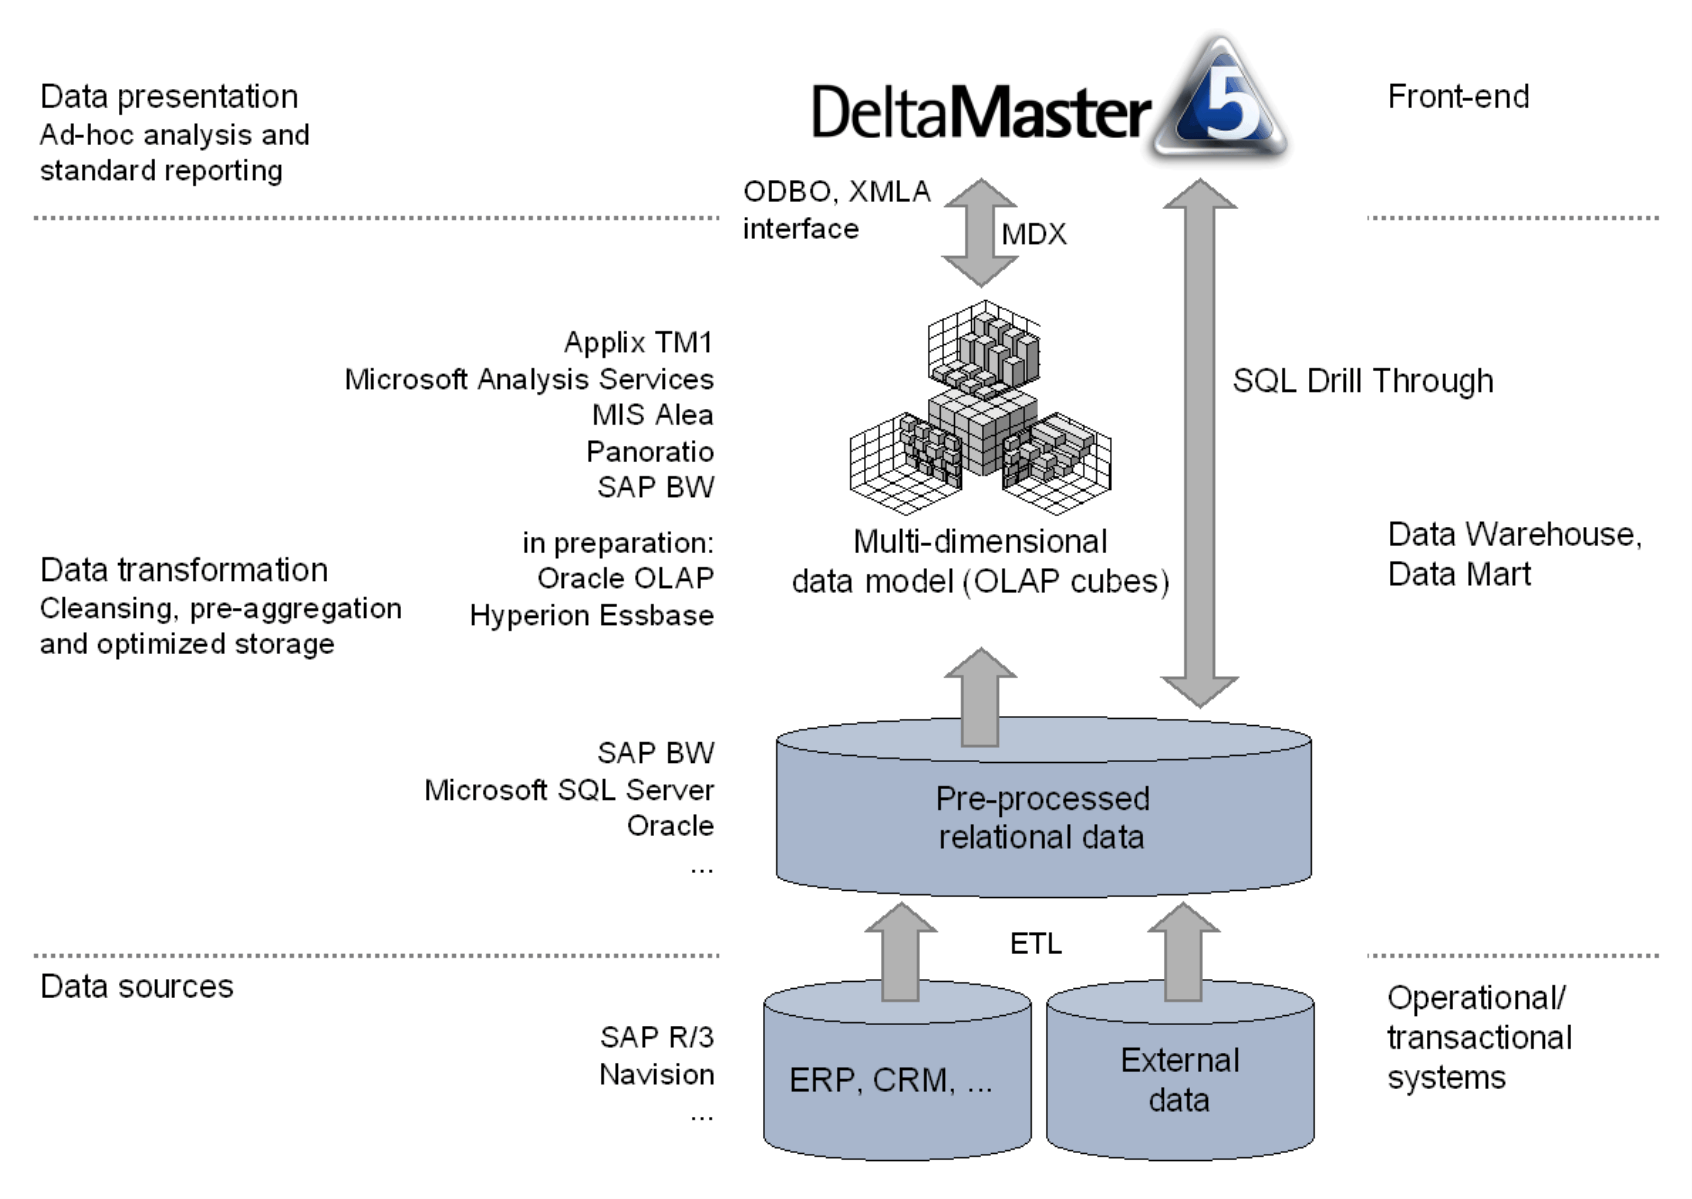
Let’s begin with a little theory. A basic principle behind Online Analytical Processing (OLAP) is to condense data on various levels and view it in aggregated form. In order to bring the greatest possible flexibility to your analyses and reports, you first transfer the relevant data set from the operative application systems – such as the merchandise management or ERP systems – to a relational database. Here, the data is prepared so that it can be built into multi-dimensional cube structures. The OLAP databases then draw on this “intermediate layer.” In the final step, you access the OLAP databases with the front-end of your choice, DeltaMaster. The following schema gives you an overall picture of the architecture[d1]:
You may already have analyses and reports based on OLAP, but time and again, you’ll find yourself needing to access relational data. You may want to call up the uncondensed individual data records that are the basis for your analyses and reports. Or perhaps you want to store analysis results in the database for further processing. Then again, you might want to centrally manage user input, such as plan figures and comments. You’ll typically come across situations like the following:
- During an analysis, you’ve spotted an unusually high order sum.A look at the original source data reveals that the figure was obviously entered incorrectly.At the same time, you get the order number needed for carrying out the correction.
- You’ve used DeltaMaster‘s data mining methods to identify a small customer segment where you expect high returns in the future, but which will need a lot of effort from the sales team.In order to target these customers, your field sales staff will need all the customer and contract numbers.If the file name of or path to the contract documents has also been saved, you can make the documents directly available from the DeltaMaster application.
DeltaMaster’s route into the relational system is called SQL Drill Through, and is named for the query language used. Here too, DeltaMaster has especially powerful integrated mechanisms at its disposal. That’s why we, too, can say we have a “hybrid motor:” DeltaMaster can operate both with multi-dimensional OLAP cubes and with the relevant tables of a relational database. The combination of the two results in particularly flexible working.
Relational Data in DeltaMaster
DeltaMaster applications allow for relational data to be introduced in various different places:
- In the SQL Drill Through module, for retrieving individual data records;
- For writing back virtual and user-defined hierarchies;
- In the Association Analysis (see also DeltaMaster clicks! 06/2005) and Selector: these analysis methods do not benefit from the advance condensing typical of OLAP, and therefore work with relational data; and
- For saving text comments, for instance in Planning applications (see also DeltaMaster clicks! 04/2006).
A prerequisite for all variants is that the relational model is attached to your analysis model. In this edition of clicks!, we want to go in-depth on the first two points listed above.
Well-Connected
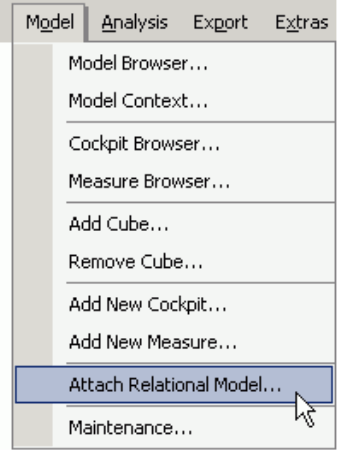
There are two ways of attaching the relational model: you can either do it when creating a new analysis model by activating the relevant option in the assistant, or afterwards using the command in the Model menu. Either way, a dialog appears. Here you have to select one of DeltaMaster‘s three methods of accessing the metadata, the structural information required for working with relational data.
- The DSO (Decision Support Objects) interface is particularly comfortable to use. DeltaMaster uses the DSO interface to read the structures of the relational database directly out of Microsoft Analysis Services 2000, with the result that there’s no need for any further configuration.In Analysis Services 2005, relational models are attached via AMO (Analysis Management Objects). This interface will be available in the upcoming DeltaMaster 5.2.
- For all other databases besides Microsoft Analysis Services, such as Applix TM1 or MIS Alea, the structural information can be formulated with the aid of an XML file.Our consultants will be happy to help you create the right configuration.
- The Import Wizard tool, one of our own products, serves to import data in various table-type formats, prepare the data and save it as multi-dimensional cubes for Microsoft Analysis Services or MIS Alea.The structure definitions collected in this process can also be used for attaching the relational model.
DeltaMaster saves details of the attached relational model in the analysis model (.dam) or analysis session (.das). This way, setup only needs to be performed once. Attaching the relational model is not the same as logging in. The relational database also requires an authentication. In principle, you’ll be asked again for your username and password. However, this step is by-passed if your system environment is configured for “single sign-on.” With Microsoft databases, you can deal with the matter quickly by selecting the “Windows authentication” option.
Displaying Relational Data – The SQL Drill Through Module
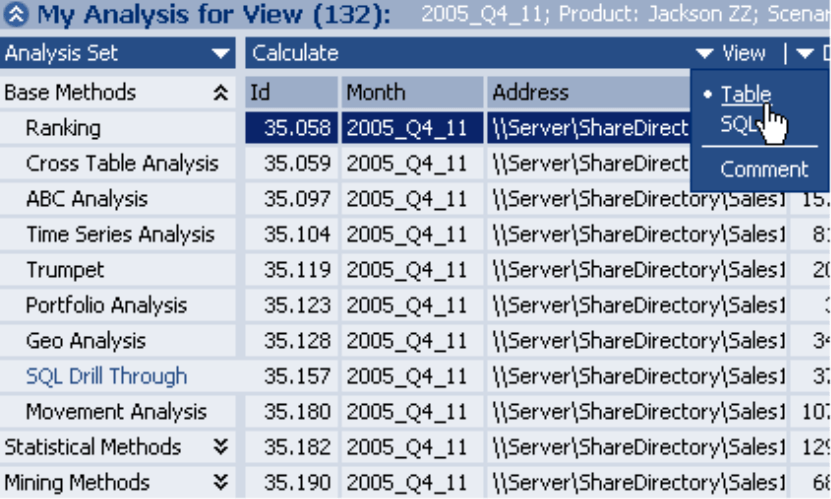
The SQL Drill Through module in the Base Methods enables you to display relational data. First define the Settings, which we’ll look at in more detail in a moment. The module then shows all data records belonging to the current view as a table. Alternatively, you can call up the SQL expression DeltaMaster used to export the data, copy the expression and transfer it as a query to your database interface (Query Analyzer, for instance).
You can perform the most important Settings for the SQL Drill Through on the Fields tab card, which you can also reach via the Select Fields [d2]menu.
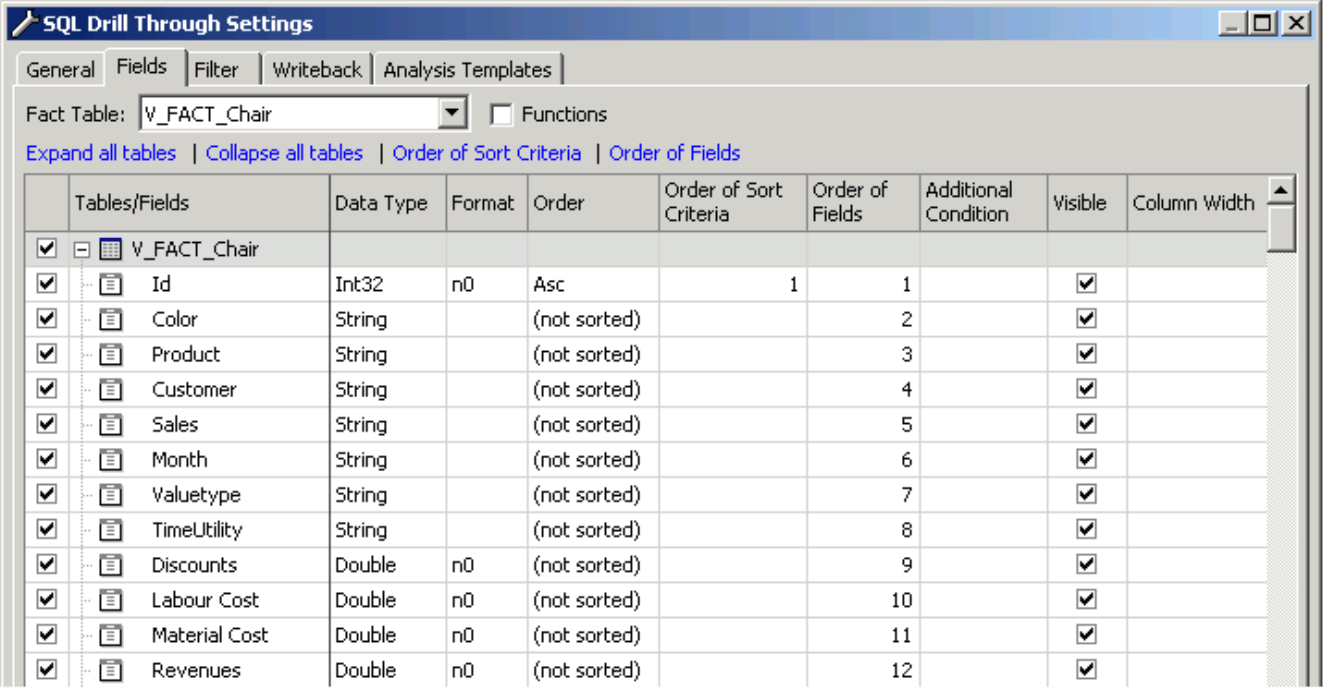
First, specify the Fact Table for which you want to see the relational data. DeltaMaster then lists all the fields of the Fact Table and their Data Type. Following on from the fact table, the dimension tables and their fields appear: these fields can also be used for SQL queries.
By selecting the checkboxes in the far left-hand column, you specify which fields are to be included in the query. Putting a check next to the name of a table activates all the fields of the selected table.
In the Format column, you can define for each field how you want the values to be displayed. For example, you can specify how many places you want after the decimal point. If you want, you can sort the result data according to one or multiple criteria. You can specify the desired direction (ascending or descending) by using the selection field in the Order column. If you have specified several fields for sorting, the final display will depend on the order you have set, either by entering ordinal numbers in the relevant columns, or by using the link Order of Sort Criteria and dragging and dropping.
The Order of Fields, i.e. the order in which DeltaMaster presents the data record fields from left to right, can be regulated in exactly the same way: either place ordinal numbers in the relevant columns, or use the link of the same name to create the order by dragging and dropping. As an Additional Condition you can specify SQL expressions to be inserted in the WHERE clause of the SQL expression to be generated. This way, you can also determine entirely individual filter criteria.
You can use the Column Width, given in pixels, to influence how the table appears on the screen. This feature is especially practical when you have long text fields: DeltaMaster wraps the text at the specified point, putting it into several lines instead of just one. If you leave the field empty (as in the default), or enter 0, DeltaMaster will adjust the column automatically.
The Functions option shows an additional column which you can use to group the result data sets according to individual fields and to aggregate the values, for example by totaling or averaging them. This will only make sense in particular application cases, or if you want to check the OLAP model. After all, you generally want to use the SQL Drill Through for accessing individual data records, whereas you’re better off leaving summaries to the OLAP model.
Even when you’re interested in disaggregated, individual data records, it’s often the case that not all the entries are of importance. You have already made a pre-selection in the form of the current view: the SQL Drill Through is embedded in the DeltaMaster analysis chain and thus takes account of the currently valid analysis view. If you want to further limit the amount of returns in order to concentrate on the essential, you can do one of the following: you can restrict the quantity of data records to be returned on the General tab card or you can define Filters for the SQL Drill Through, just as in many other modules, so that only certain ranges of values get shown.
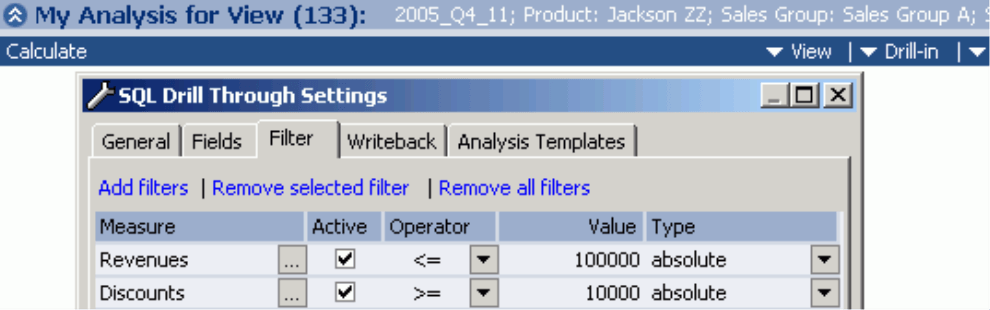
The interaction of these options makes DeltaMaster a highly adaptable viewer of relational data.
Registered Delivery with Advice of Receipt
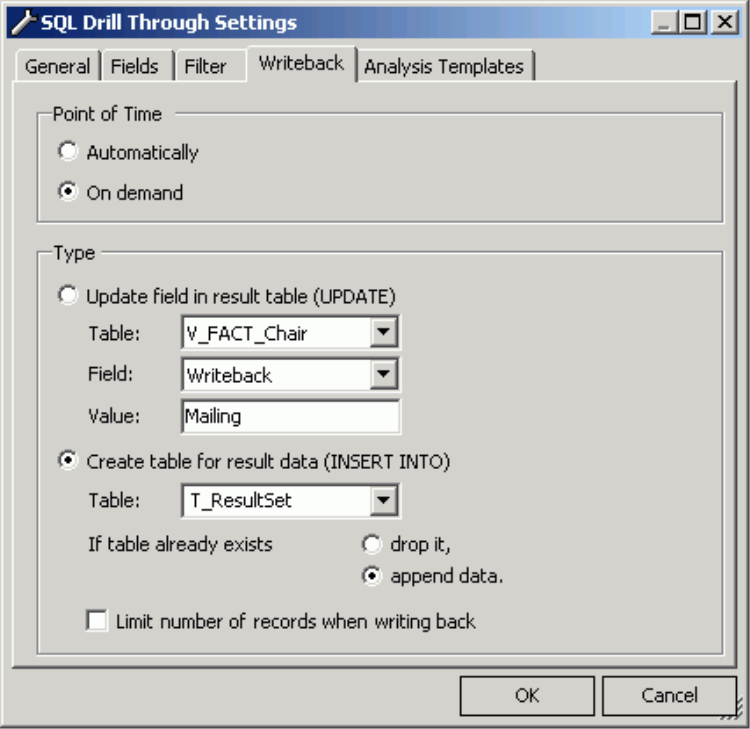
The data records presented in the SQL Drill Through table view can also be saved back to the relational database. This means that other application systems can go there to “retrieve” them for further processing. You have the choice between two variants:
- If you use “Update,” DeltaMaster selects the data records of the result quantity in a field reserved for this purpose in the Fact Table.Enter text or a figure of your choice as the Value. This is then entered in the relevant field of all the data records.This way, for example, you can designate the customers who are to be addressed as part of a mailing.
- If you select “Insert Into,” DeltaMaster writes the data records of the result quantity to a separate table as shown.If this table does not yet exist, DeltaMaster creates the relation automatically.If it does already exist, you can decide whether DeltaMaster should delete the existing data records before pasting in the new ones, or whether the new ones should be “appended” to the existing contents of the table.The latter allows you to determine individual records for multiple views and export them one after the other.
Writing Back Hierarchies
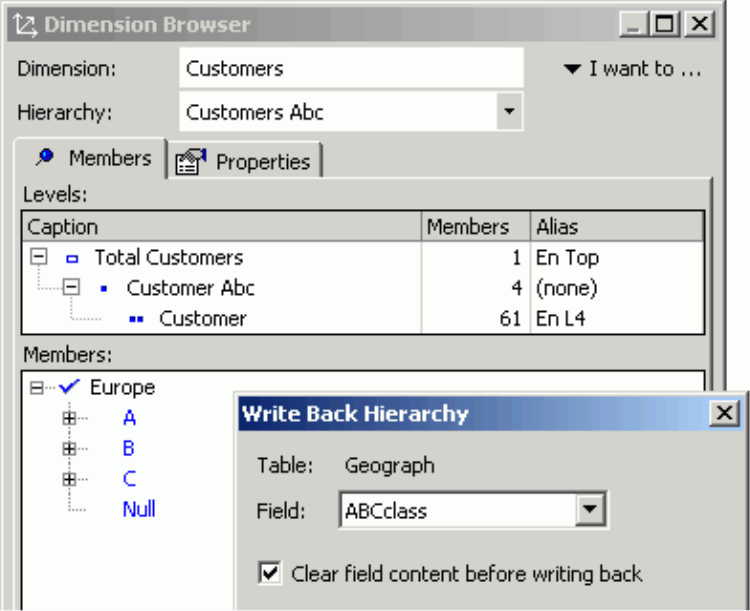
If you want to label data records in the relational database, it is not absolutely necessary to call up the individual entries first. Virtual hierarchies which you might have created from an ABC, Portfolio or Distribution Analysis, and user-defined hierarchies, also constitute a classification that can be written back.
Go to the desired hierarchy in the Dimension Browser and call up the Write back Hierarchy function from the I want to menu. Then select in the dimension table the field in which the label in question is to be entered.
Model Symmetry
The Model Browser (in the Model menu) makes especially clear just how closely connected the OLAP and relational models are in DeltaMaster.
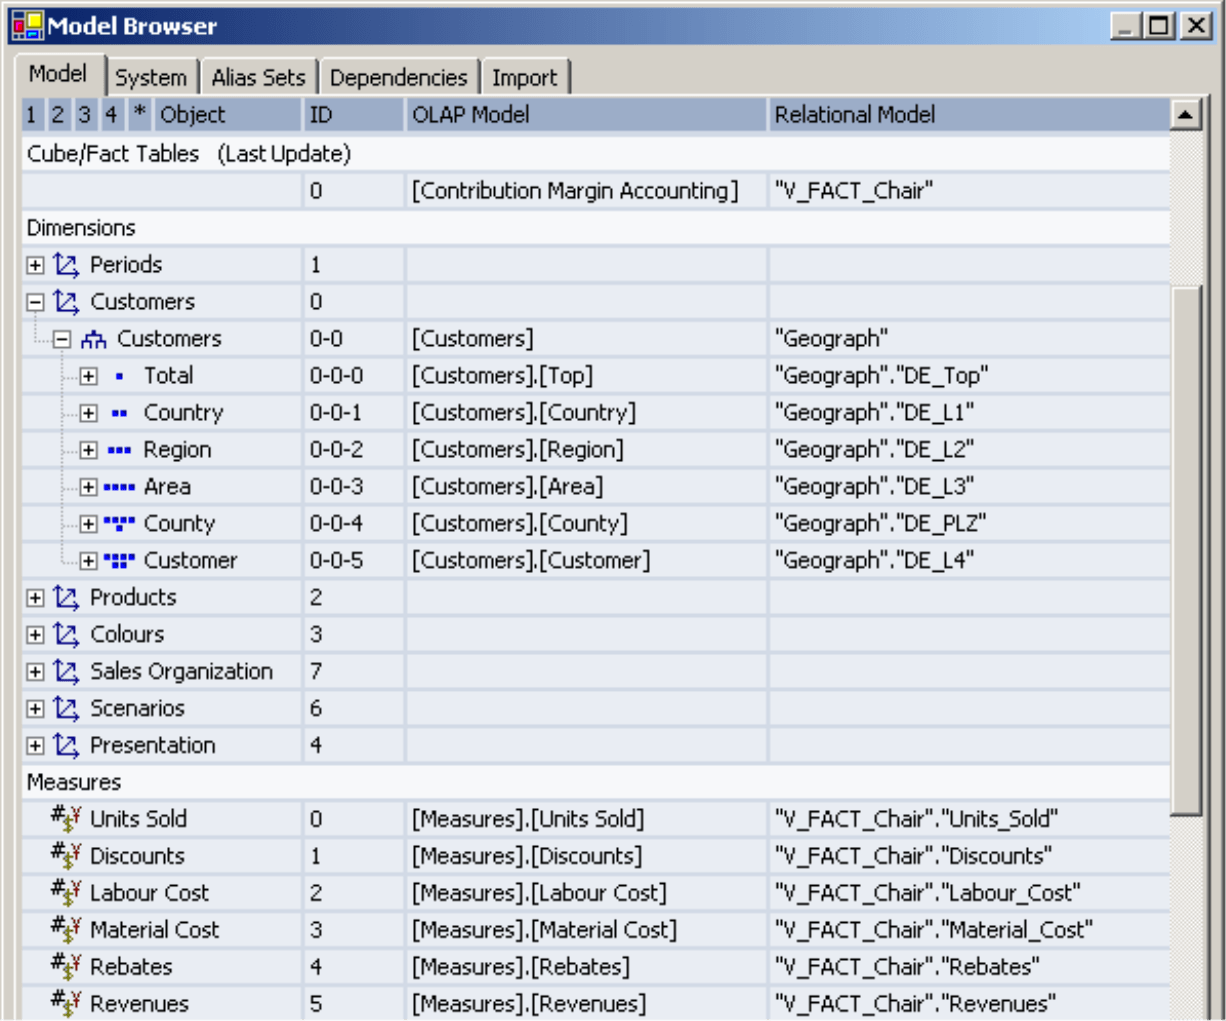
The terms used in your analysis application, like the names of dimensions and key figures, are placed alongside the relevant OLAP objects and the constructs of the relational database they come from. For example, the cube named “Gross Margin Analysis” traces back to the fact table “V_FACT_Chair”. The analysis object “Customers (Top)” corresponds to the dimension level “[Customers].[Top]” in the OLAP model and the field “DE_Top” of the dimension table to “Geograph” in the relational model.
