![]()
Greetings, fellow data analysts!
Mr View says, “I determine what this report reports.” – “I beg to differ, I can handle my views on my own. After all, I have my own axis definition!” Mr Report contradicts. With this imaginary dialogue, we have assigned a voice to two DeltaMaster components that go hand in hand whenever pivot tables are asked for: the View and the Report or Cockpit windows. And even if it sounds like a little dispute: In perfect unity, both are responsible for the final structure of our table or chart and for its values. The difference of opinion mentioned above is quickly arbitrated when the tasks are clearly allocated. And that’s exactly what this edition of clicks! is about: We’ll show and explain how your View and Axis definition work together – in harmony!
Best regards,
Your Bissantz & Company Team
If you regularly work in DeltaMaster’s Viewer level or higher, you probably are already familiar with the View function, which lists the dimensions of your data model. Here you can select the desired dimension members, in other words, the different types of business information that will be referenced in the underlying report. The view and report (or cockpit) are linked to each other. As a result, if you change your view in the time dimension from December 2008 to January 2009, you will immediately see this change in the report or cockpit.
If you regularly use DeltaMaster in Pivotizer level or higher, you probably also know that you can also select members in pivot tables under the Axis definition.
How does this selection differ from that in the view? How does this affect how you work with the table? We will explore these and other questions in the next few pages.
‘In’ or ‘on top of’ the report
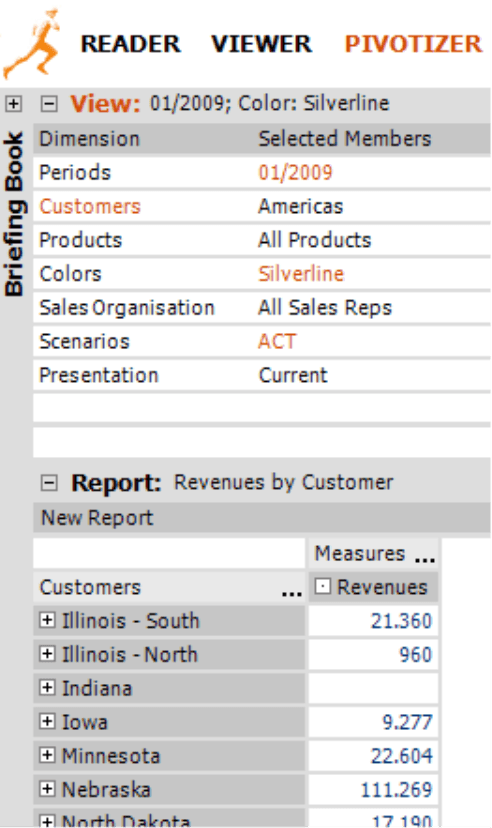
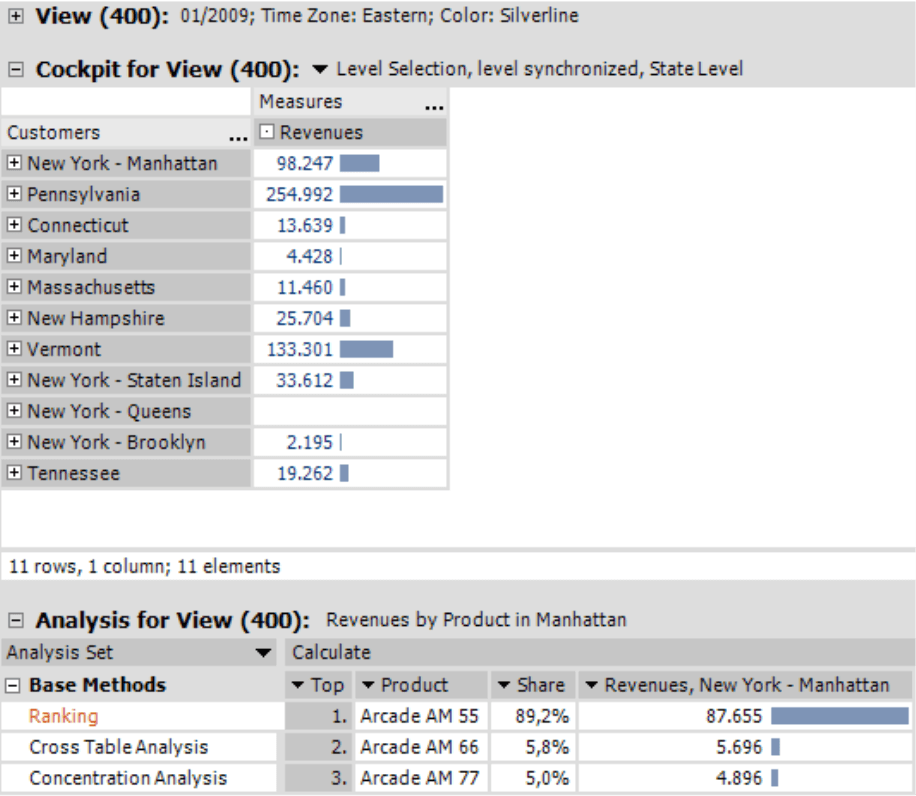
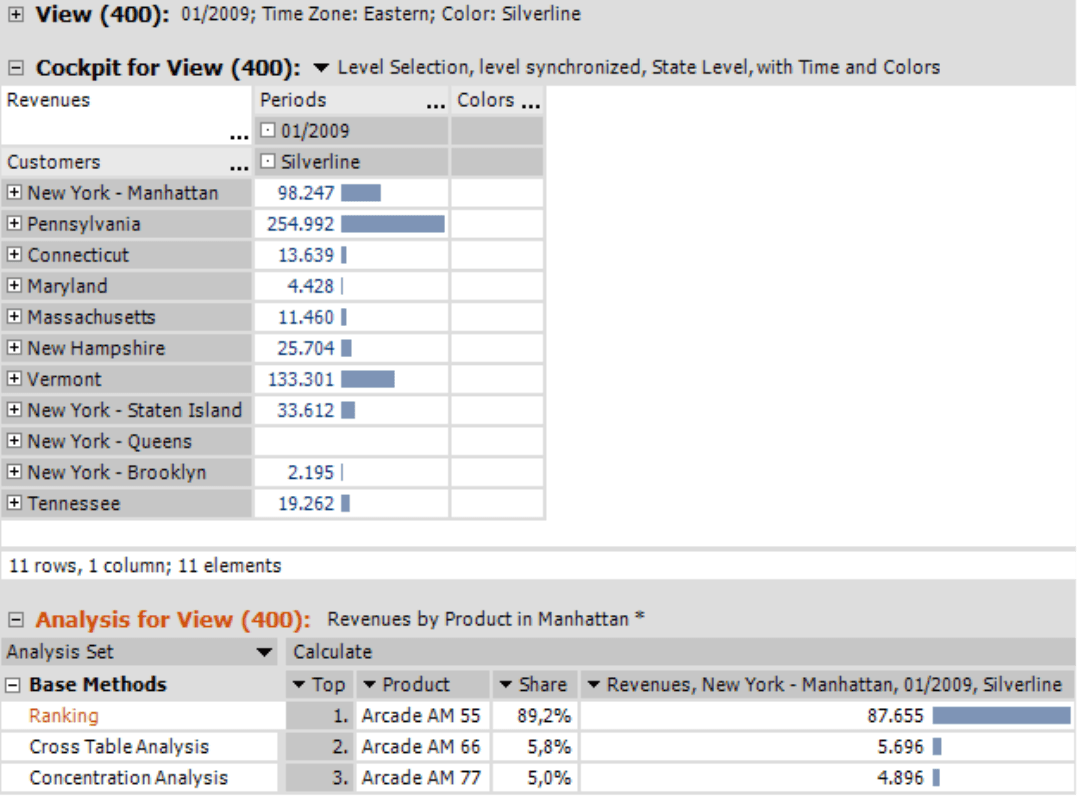
Although your selection in the View influences which values will be displayed, the selected members will not necessarily appear as rows or columns in the pivot table. Therefore, by selecting a member in the View, you are describing the context in which the reported values will be seen. This is one fundamental difference. DeltaMaster will display the view description as a text row above the report. The illustration above shows a simple pivot table from our ‘Chair’ reference model. It shows the January 2009 revenues for the ‘Silverline’ color – yet, the report does not contain any references to time or colors. The customers, however, are listed in the axis, which is why DeltaMaster has highlighted them in orange in the View window.
Selection options in the axis definition
The Axis definition, which you can open by clicking the ellipsis (…) after ‘Customers’, offers four different ways to select members:
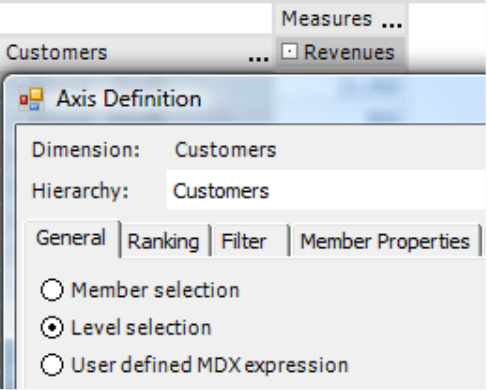
- Choose Member selection to explicitly select the desired members using the Dimension browser – just as you would in the View window. This type of selection is sometimes referred to as a ‘pick list’.
- Use Level selection to choose members based on their respective hierarchy level, for example, all members on the product group or customer level. You can synchronize this option with the current view, which we will explain further below in detail.
- A user-defined MDX expression allows you to describe the desired number of members using MDX query language.
- The Tuple selection comes into play when you are working with nested dimensions (i.e. when you want to combine members from several hierarchies on an axis). This option is not listed in the screenshot on page 2 because our sample table does not contain any nested dimensions. For more information on the Tuple selection function, please refer to DeltaMaster clicks! 1/2009.
Generally, the settings in the Axis definition overrule those in the View window. This always applies for the Member selection, User-defined MDX expressions and the Tuple selection. In these cases, DeltaMaster will ignore the respective dimension; this is signalized in the View window through parentheses.
Synchronizing the member selection with the view
The Level selection is an exception because it can either dynamically follow the view or overrule it. You can define this setting in an option stored on the General tab in the Axis definition.
- If you do not want to synchronize [the selection] with the current view (option = deactivated), DeltaMaster will display all members of the selected level(s) in the table regardless what is selected in the View window. The members appear as individual rows or columns in the report.
- When you synchronize [the selection] with the current view (option = activated), the View window will determine which members are to be displayed.
Which members DeltaMaster lists in the pivot table, however, depends on two factors: the levels that are selected in the Axis definition, and those that belong to View members. Only members on the levels defined in the Axis definition will be displayed. You could create a selection on a higher level in the View window but the subordinate members – and not the higher level itself – will be placed in the report. DeltaMaster can display View members on levels that are lower than those in the Axis definition if you activate the second option (i.e. Synchronize with the current view levels – see below for more information).
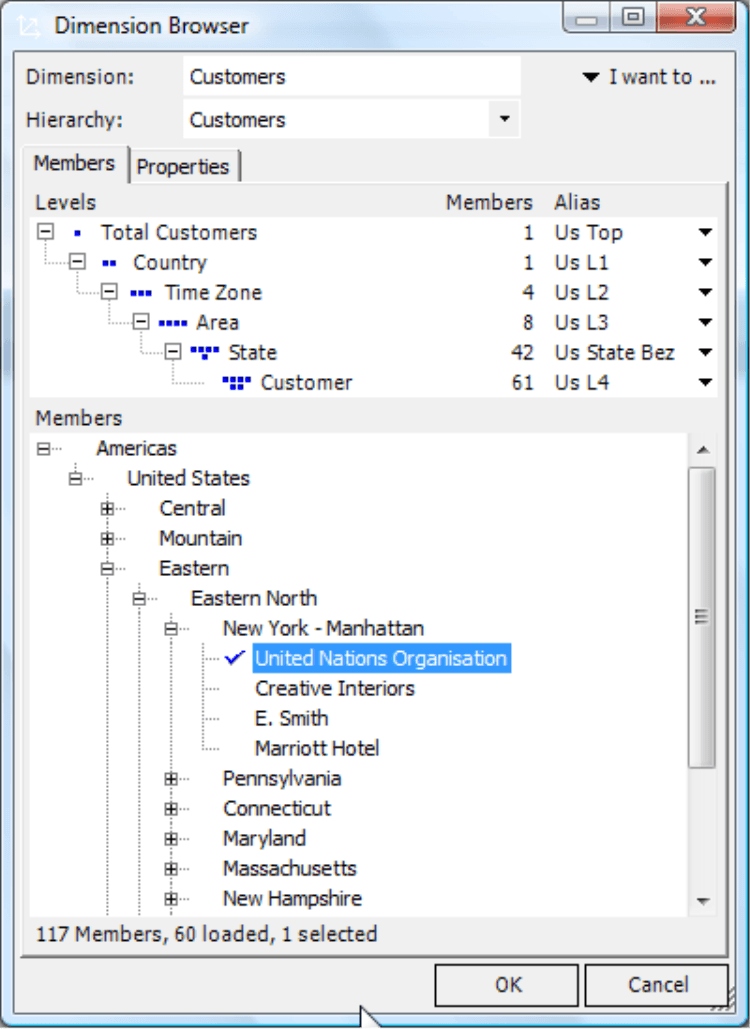
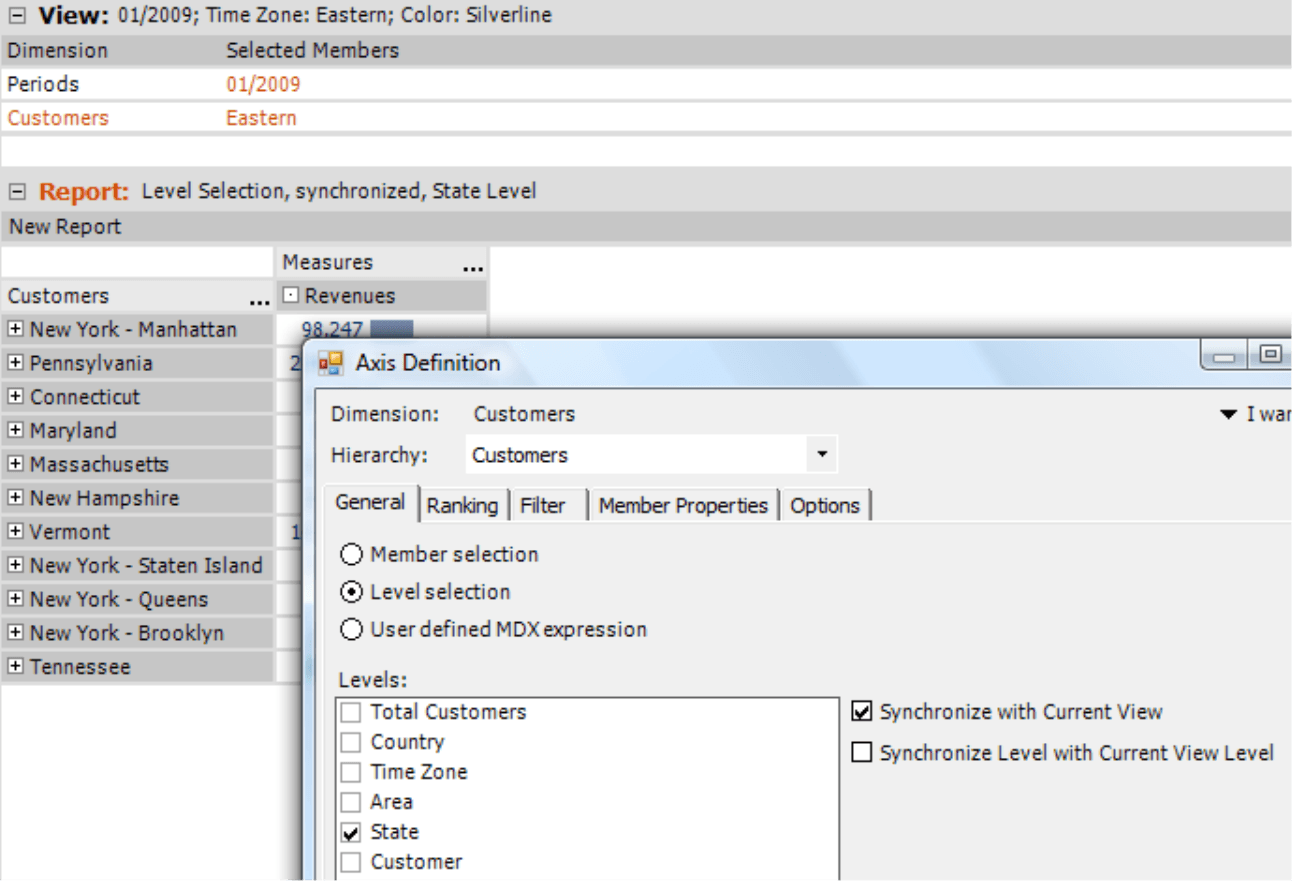
Let’s look at an example. The screenshot on your right shows the customer dimension of our reference model. ‘Customers’ has six levels as we can see in the dimension browser.
In our pivot table, we have activated the Level selection and deactivated the synchronization. As a result, DeltaMaster will not apply the ‘Eastern’ selection in the View window and has placed it in parentheses accordingly. The table shows all members on the ‘State’ level.
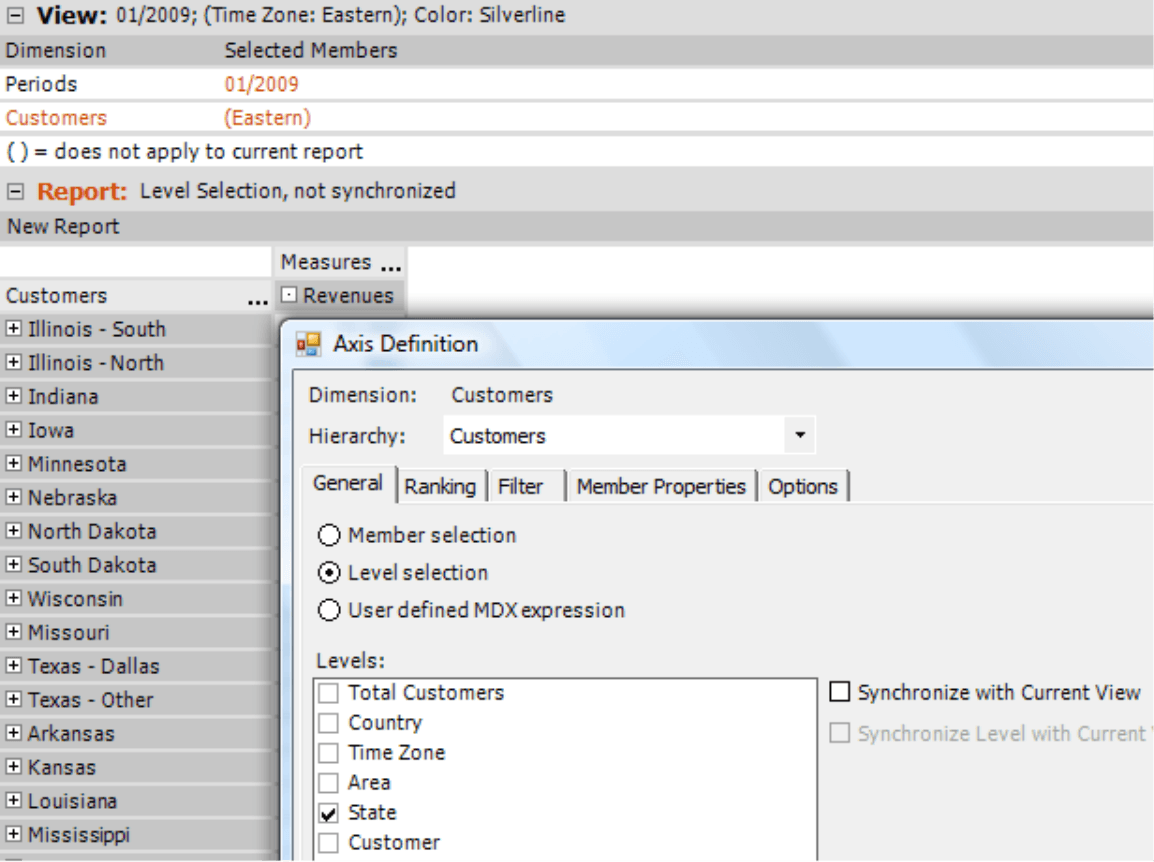
In the report on your right, we have kept the ‘State’ level but synchronized the View selection so that ‘Eastern’ is activated. As a result, the pivot table only shows the members of the states in the ‘Eastern’ time zone.
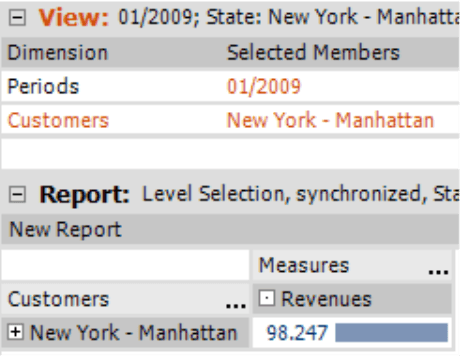
If we change our View to show the state for ‘New York – Manhattan’, DeltaMaster will list this single member.
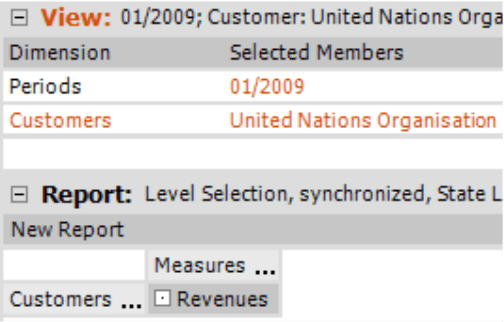
If you select ‘United Nations Organisation’, the table will remain empty because the individual customer in this case is positioned lower than the state in the hierarchy. As a result, this information cannot be displayed in the table.
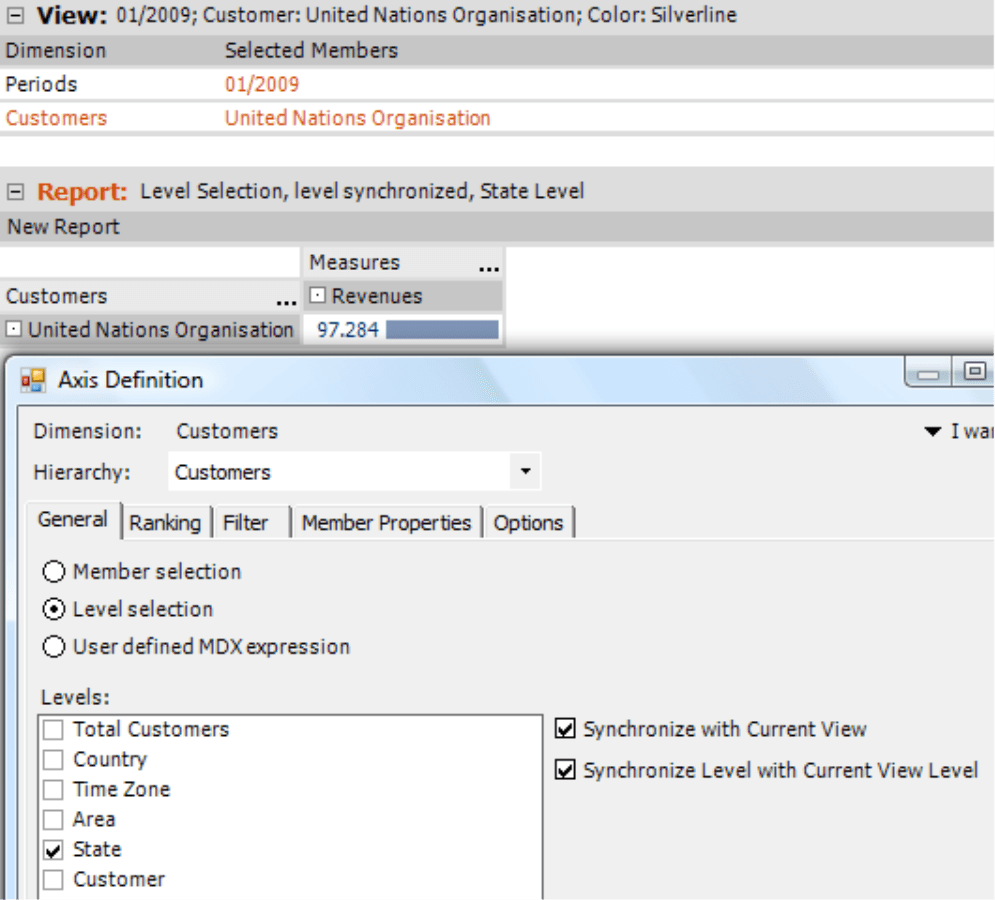
Synchronizing levels with the current view Level
You can change the behavior for members on lower levels (as described above) using the second option on the General tab. If you also want to Synchronize the level with the current view level, DeltaMaster will also display the View members in the pivot table provided that they are located on a level that is lower than the one defined in the axis definition. This option takes effect as needed – as if you had reserved this axis for a lower level.
Effects
Therefore, when you are working with pivot tables, it does make a difference where you have selected the members. The two most important things to consider are:
- Users working in Viewer mode cannot access the Axis definition. If these users should be able to change their views interactively, the parameters belong in the View and not should not bound to the pivot table.
- If you drag and drop a value from the pivot table into an analysis method, DeltaMaster will automatically generate an appropriate measure (i.e. filter measure) if it does not already exist. It will create one filter for each dimension that is incorporated in the pivot table – but not for the current setting of the view. The screenshots below illustrate the difference between more general (left) and more specific (right) filter measures. When the view is identical, both options will deliver the same results. In general, the flexible option (as seen on your left) is preferable.
 |
 |
Selecting superior and subordinate elements
Another important difference is related to selecting superior and subordinate elements.
In the View window, a multiple selection primarily serves to select elements that are supposed to be aggregated. If, for instance, in a customer dimension, you select “Americas” and “United States”, DeltaMaster supposes that the sum of “Americas” and “United States” is meant. Obviously this does not make much sense because one should not add parts of a total to the total itself. This is the reason why “it is not allowed to jointly select subordinate and superior members”, as the according DeltaMaster message hints if one attempts to do so.
A certain exception are dimensions that appear in the report itself. The synchronization with the current view (the option in the axis definition described above) leads to the result that instead of an aggregation being calculated, the selection from the View window takes over control about which rows or columns will be shown in the pivot table. However, nothing changes in the View window; as before, a valid combination of members must be set – and thus cannot contain superior and subordinate members at one time.
Contrary, the element selection within the axis definition serves to pick those elements that are supposed to be displayed as rows or columns in the pivot table. A multiple selection here will not be interpreted as a command to aggregate the corresponding values, but instead to show them in the resulting table. This is why the Dimension Browser does not show any signs of protest in this case even if you pick superior and subordinate elements together.
Questions? Comments?
Just contact your Bissantz team for more information!
