![]()
Greetings, fellow data analysts!
To celebrate special occasions, most restaurants go to great stakes to plan and prepare a tantalizing, multi-course dinner. The biggest challenge, however, occurs when guests order à la carte or, in other words, individually choose which items they want to eat and when. Instead of preparing a pre-defined selection of courses in larger quantities, the kitchen staff has to create a wide range of dishes on demand. That makes detailed planning much more uncertain and complex because everything has to be served at the same time without needing to keep the individual dishes hot or cold. In addition, it also requires more resources because the restaurant has to have more ingredients on hand to meet all of the different requests. If the kitchen didn’t make the proper arrangements, such individual requests could literally spoil the soup for many restaurant staff.
Fortunately for us, offering reports à la carte is much easier. The ingredients are available in our OLAP database(s) and we can whip up tasteful reports and rich analyses with DeltaMaster. In this edition of DeltaMaster clicks!, we’ll show how the new tuple editor helps to create very unique compositions in a pivot table. Let’s just hope that the numbers that you present leave a good taste in your report consumers’ mouths.
Best regards,
Your Bissantz & Company Team
![]() The new tuple editor, available in Pivotizer and higher levels, offers a very efficient way to combine multiple dimensions that are nested in the row or column axis of a pivot table. You can also use this feature to create individual combinations of measures and dimension members without needing MDX programming or Flexreports.
The new tuple editor, available in Pivotizer and higher levels, offers a very efficient way to combine multiple dimensions that are nested in the row or column axis of a pivot table. You can also use this feature to create individual combinations of measures and dimension members without needing MDX programming or Flexreports.
The tuple editor saves a lot of time in comparison to other approaches that produce similar results. For starters, since you can easily hide unnecessary rows or columns, you can focus your reports on the most important information. That alone is reason enough to take a closer look at the tuple editor!
Actual to Previous Year and Estimate/Budget – the PACE Report
To illustrate the functionality of the tuple editor, let’s use a simple report that most companies use in some form or another to compare three types of values:
- Actual values for the previous year
- Actual values for the current year
- Estimate (a.k.a. plan/budget values) for the current year
Quite frequently, this type of report is referred to as a PACE report. This report shows the current results alongside budget and historical values, the two most important measures for making comparisons. The order of the columns might seem strange at first because the actual values are located in the center. The reason, of course, is not only to fit the acronym PACE. Instead, our objective is to place the actual values adjacent to both comparative values [left in comparison to time, right in comparison to the estimates (plan)].
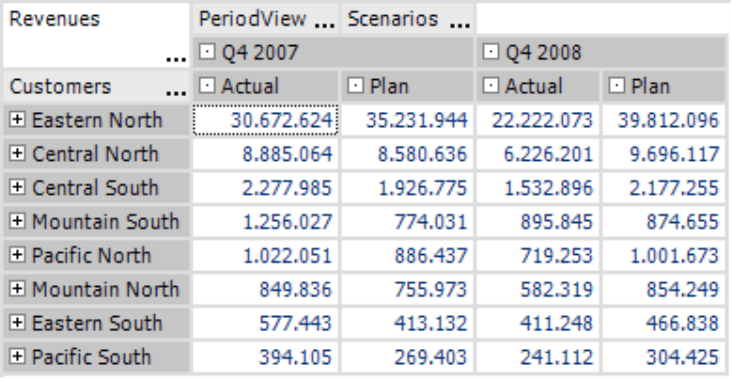
Multidimensional OLAP models generally use two dimensions for these types of analyses. One is for scenarios (Actual, Plan) and one for period views (Current, Prev[ious]Year). If we multiplied these out into a pivot table, we would get four combinations:
| Scenario | Actual | Budget | ||||
| PeriodView | Current | PrevYear | Current | PrevYear | ||
If you want to assess the current values, the current budget and the actuals of the previous year are very useful information. The previous year’s budget values located the fourth column, however, are not. If you want to remove this column, you either need to write a user-definied MDX statement – or simply use the tuple editor.
Entrée – About tuples
A tuple combines members from different dimensions; only one member, however, is selected per dimension.
If you want to arrange several dimensions on an axis, normally you would nest them so that all members of the inner dimension are listed for a member of an outer dimension and presented as table columns or rows. Yet, you may not want to use these exact combinations. In some cases, for example, you just want to combine individual members from different dimensions – just as we did in our PACE report.
With everything…but not too spicy
In order to achieve the desired table layout, you first need to generate a pivot table containing Scenarios and PeriodView (TimeUtility) on the column axis – just as you normally would. In order to remove the column “Q4 2007/Plan”, simply open the Axis definition dialog field by clicking the ellipsis (…) next to “Scenarios” or “PeriodView”. Since DeltaMaster combines the dimensions in the same manner, it doesn’t matter which one you use to open the editor.
The General tab now contains an additional option called Tuple selection. This is always offered as the fourth selection option when more than one dimension is lying on the axis (rows or columns) in question. When only one dimension is located on the axis, DeltaMaster will not offer this option because you cannot create tuples with only one dimension.
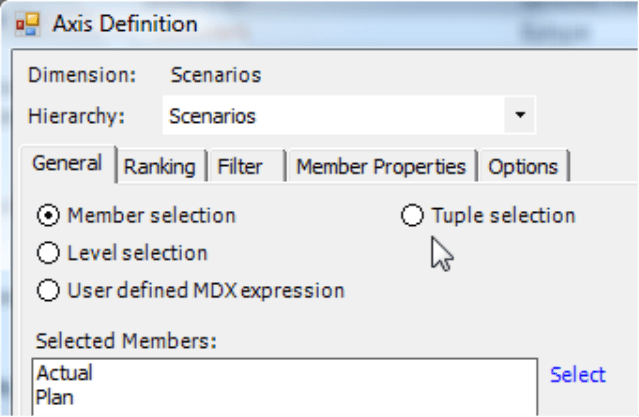
When you switch to Tuple selection, DeltaMaster will show a preview of the column headlines of the pivot table in the middle section of the dialog box. In our example, these are the four tuples that are generated from the combination of both scenarios and period view items.
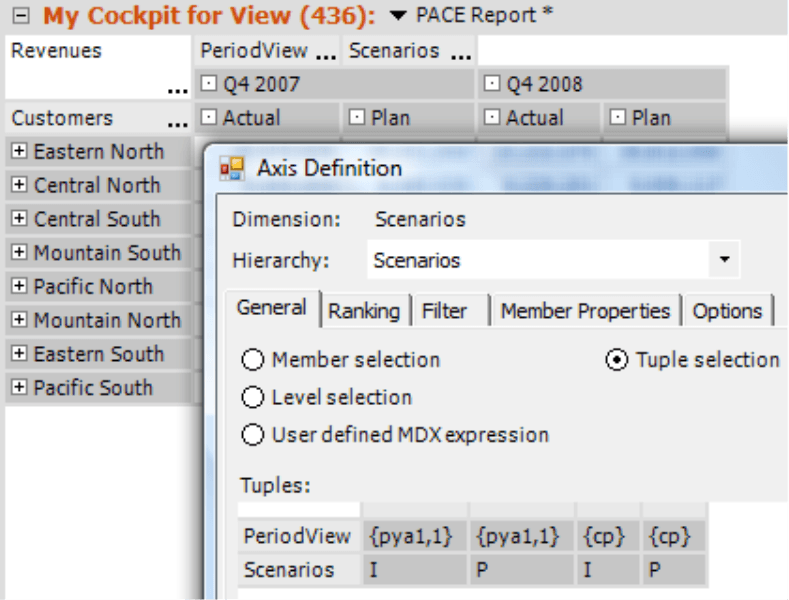
With everything that it needs…so, really spicy!
In this dialog box, you can add additional tuples (figuratively speaking, columns) into the pivot table, rearrange tuples, edit existing tuples, as well as delete tuples (columns). In other words, you can do everything that you need to concentrate on the really important information in your report.
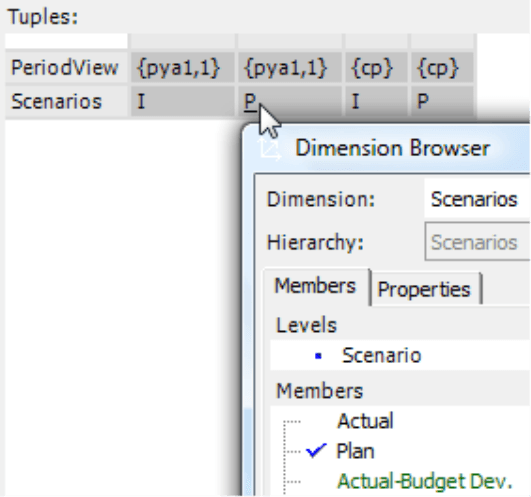
- Select the desired members or measures for a certain cell: You must select one member or measure in each cell. To do this, click on the displayed name and select it in the Dimension browser or the Measure browser.
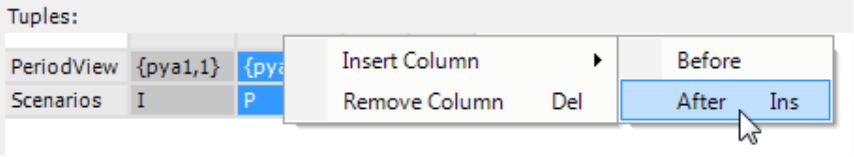
- Insert: To add a new column or row, use the respective option in the context menu or hit the Ins key on your keyboard. DeltaMaster will automatically fill the new cells with either the default member of the respective dimension or the default measure; you can modify this suggestion, however, with a click of a mouse.
- Copy: By using the functions in the context menu or pressing Ctrl+C and Ctrl+V, you can copy the selected member into another cell. The source cell, however, must have the same dimension as the target cell and be located in the same row or column of the preview.
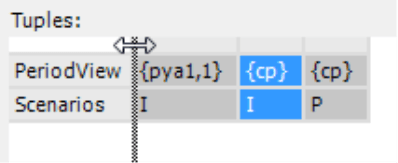
- Sort/rearrange: If you press and hold the left mouse key while clicking on the small space above the columns (or left of the rows) you wish to move, you can drag the column or row to the desired location and then let go of your mouse. DeltaMaster will highlight the entry position with a line.
- Delete: To delete a column or a row, you can use the functions in the context menu or press the Del key. Please note, however, that DeltaMaster will delete the items immediately without asking for prior verification.
In the context of tuples, DeltaMaster treats measures just like a dimension. As a result, you can also create individual combinations of measures and dimension members.
The Report definition determines which dimensions (including the measure dimensions) you can use to create a tuple. If you want to add a further dimension (or measure) to your tuple, simply paste the desired dimension into the report as usual (e.g. in the Report definition (Change menu) or by dragging and dropping them from the View window. To create the individual combinations, simply use the tuple editor following the instructions outlined in this document.
Finger Food – Keyboard Commands
Depending on your preferences, the tuple editor may also easily be used with the keyboard:
- Use the arrow keys to navigate from cell to cell. Press and hold the Ctrl key while you use the arrow keys to move the cursor to the first or last cell in the current row or column.
- Hit Ins to enter additional columns or rows,
- and Del to delete them.
- Use Ctrl +C to copy a member or a measure and Ctrl +V to enter it any number of times into other cells in the same row or column.
These keyboard commands are very useful when you want the members or measures to appear repeatedly in the same row. The fastest approach would be to ‘prepare’ them in the axis definition using the Member selection, switch to Tuple selection, and then use the copy/paste shortcuts on your keyboard to arrange them as you wish.
Final seasoning
In the following section, we have fine-tuned the report shown at the beginning; although these features have nothing to do with defining tuples, they are still important to mention in this context.
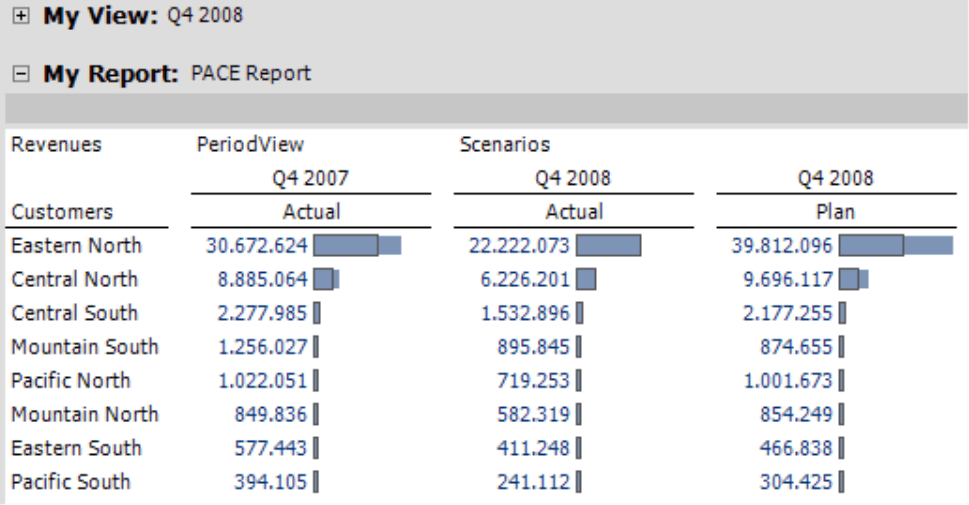
The report on your right shows how a pivot table created with the tuple editor looks in Reader mode using the white style that was introduced in version 5.3.6. This gives you a clean, elegant presentation without needing to fine-tune the formatting. DeltaMaster automatically removes all background colors, grid lines and other decorations that aren’t necessary to present the data in the Reader and Viewer levels. For more information, please refer to DeltaMaster deltas! 5.3.6, feature #23.
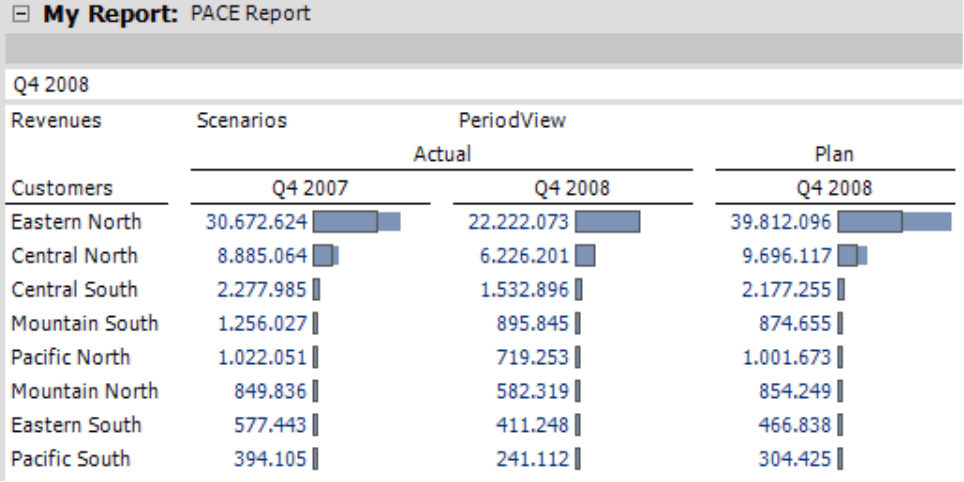
The bars, which are integrated in the table, use a common scale for the entire table. To make it easier to compare the actual values in the middle column (4th quarter 2008), we have set this month as a Reference column. As a result, the left side clearly shows the variances to the previous period while the right side shows budget-actual variances.
Depending on which members you would like to combine, you may want to deactivate the Connect row (or column) members option under Table properties (context menu, I want to… menu).
![]()
In this case, DeltaMaster will display – and not hide – the column and row headlines of identical members in neighboring cells. This can increase the legibility of some reports.
![]()
Questions? Comments?
Just contact your Bissantz team for more information!
