Bissantz DashBoard
for Power BI.
The Bissantz DashBoard for Power BI is a specially developed template, individually adapted to your existing data models.
Familiar Bissantz logic now in Power BI
Automatic model correction with the Bissantz Analytics Kit
Quick start thanks to a pre-built dashboard template
Customized to your data structures
Efficient analyses without manual model tuning


Business Intelligence – even in Power BI.
Our DashBoard Template – tailored to your data structures.
With Power BI provides Microsoft a basic toolset for business intelligence tasks that many data analysts and controllers are familiar with. While users can manually combine, analyze, and visualize data from multiple sources, Bissantz takes things further – faster, more precise, and fully automated. Our software enhances Power BI by guiding users through structured business analysis, automatically improving data models, and delivering dynamic exports. It is not just a tool, but a comprehensive BI solution that bridges gaps and enables entirely new applications – including advanced planning, visualizations, and AI-powered automation where Power BI reaches its limits.
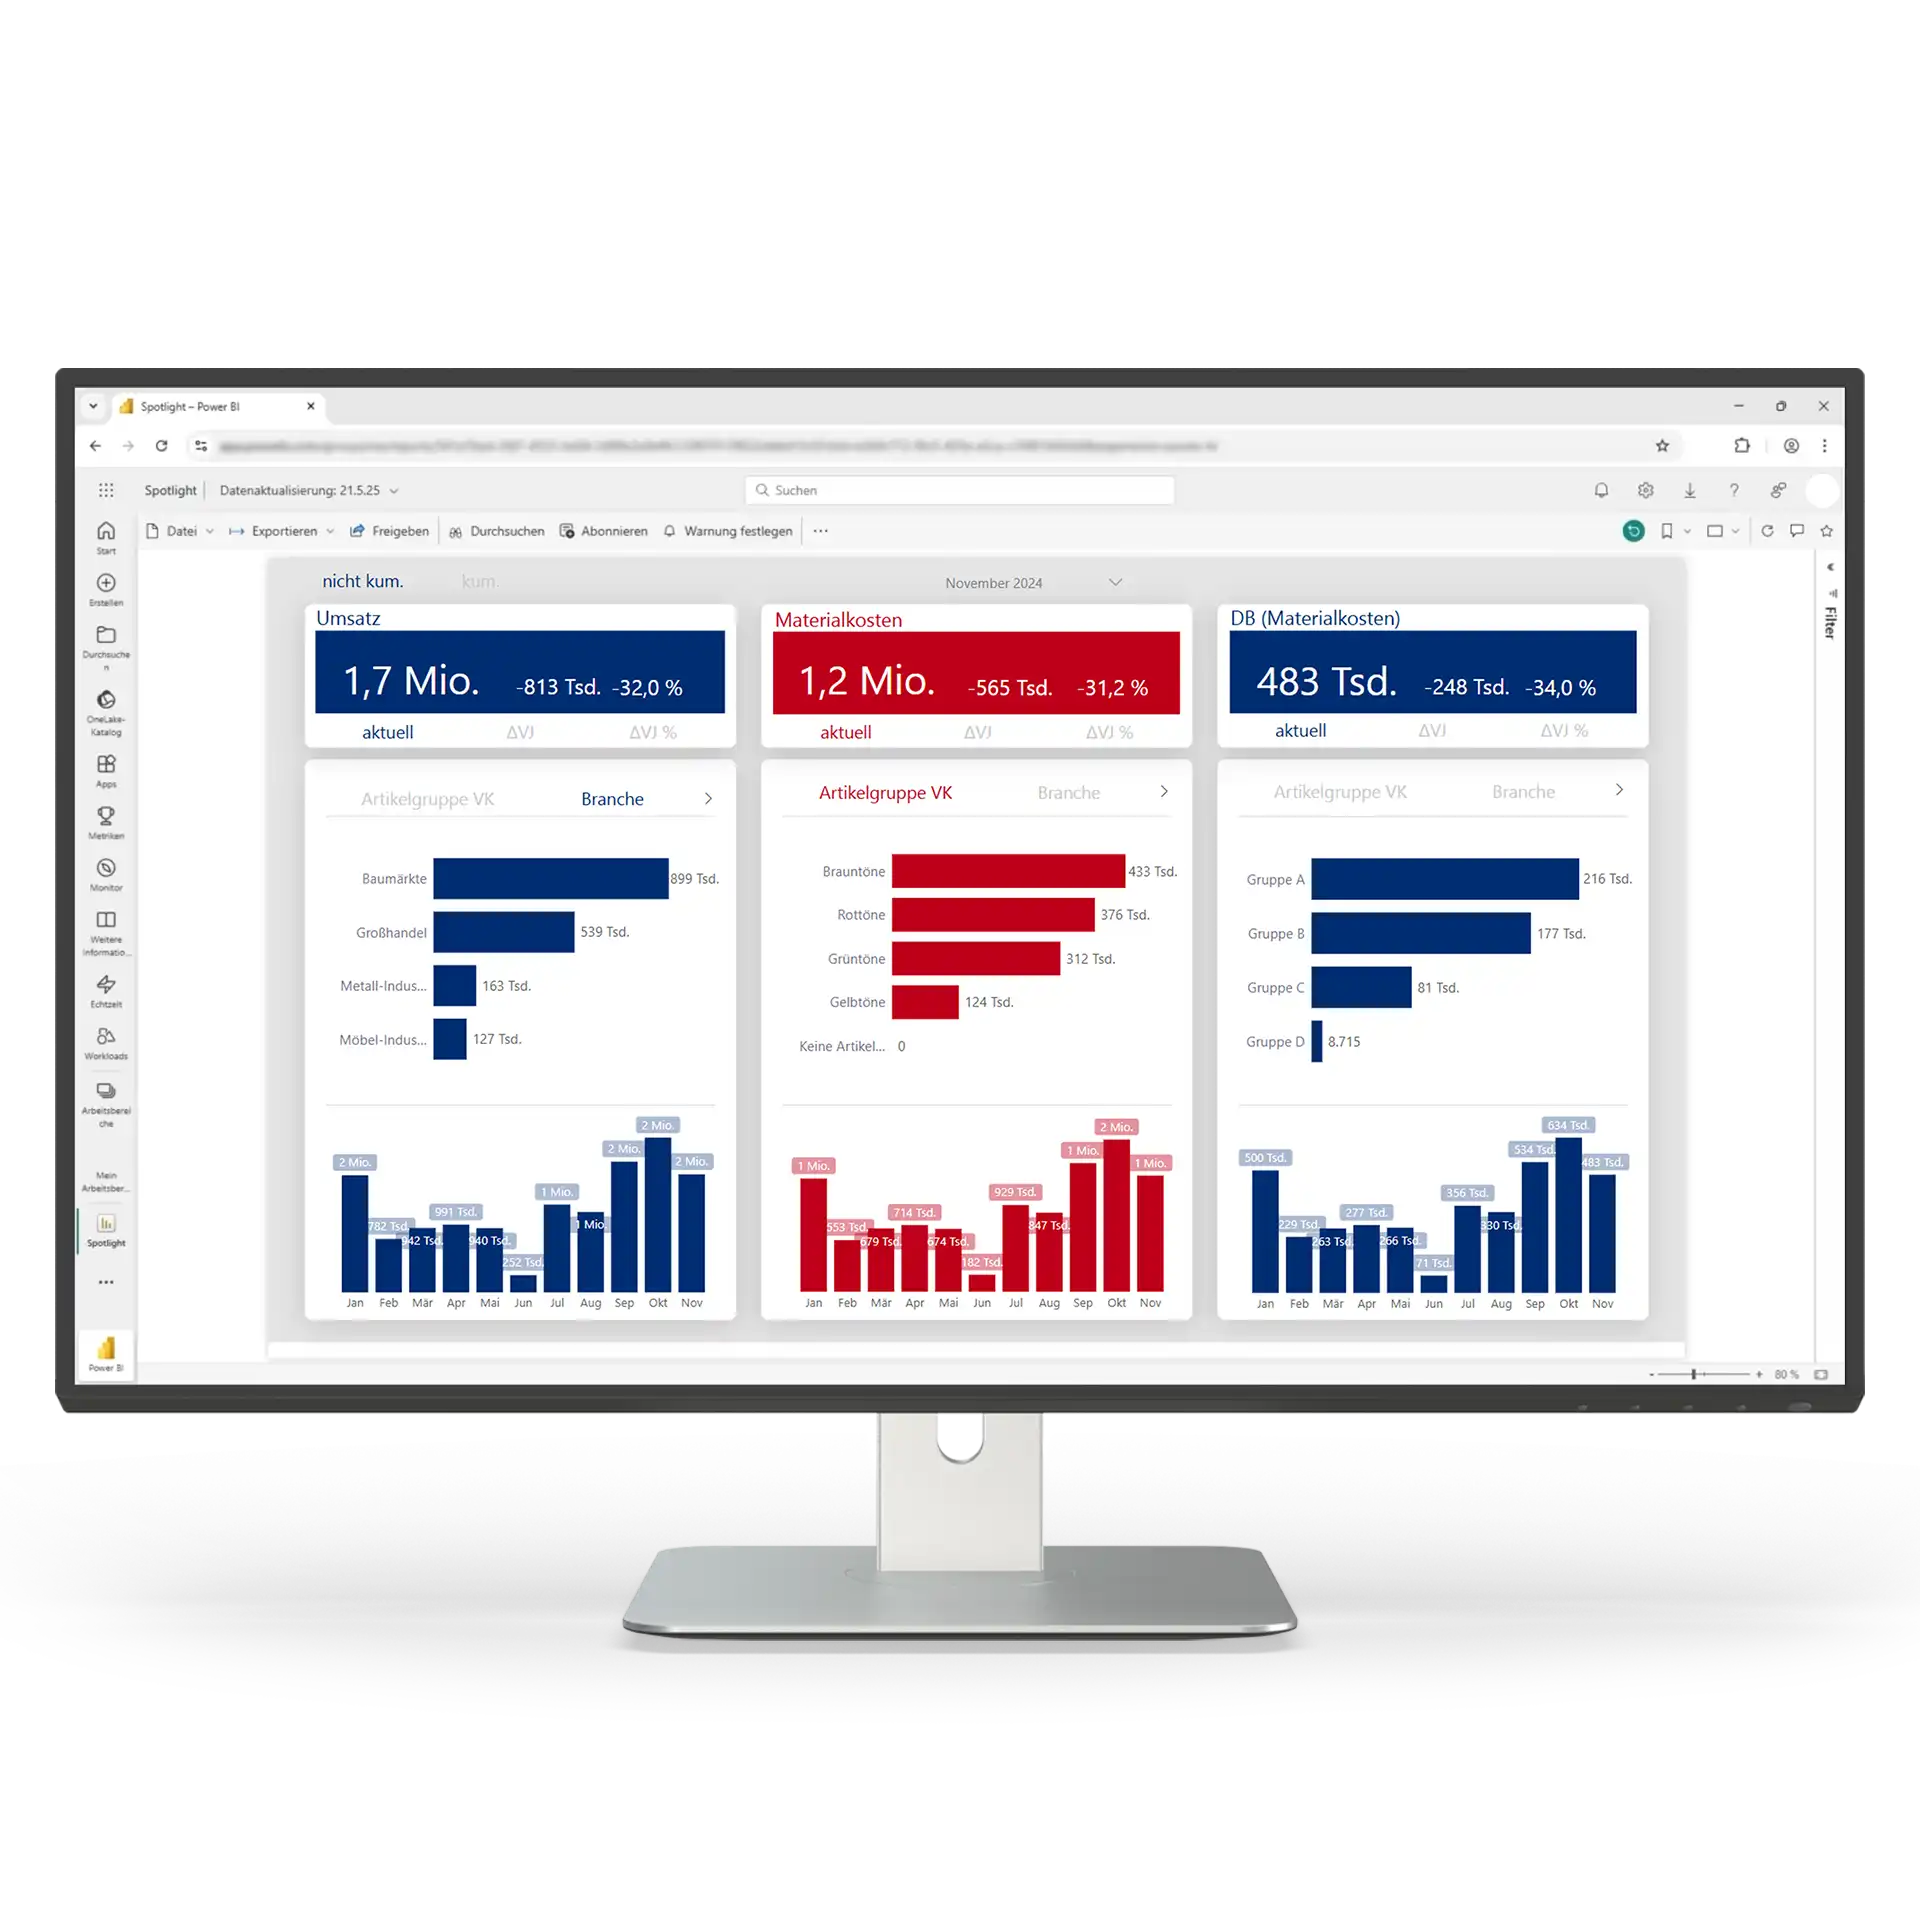
To make Bissantz’s analytics logic accessible within Power BI, we offer tailored services through the Bissantz DashBoard for Power BI. The Bissantz DashBoard incorporates the proven logic of our DeltaApp software as closely as Power BI permits, ensuring your analyses remain insightful and easy to navigate. Backed by our experience in business-centric design, the solution extends Power BI with intelligent standards, automation, and visual consistency – turning powerful software into actionable business services.
Uns vertrauen Marktführer und Hidden Champions.
Visual Design Standards.
Standardization in reporting is high on the agenda for many organizations: The way KPIs, variances, and trends are displayed should no longer vary by topic – and must not depend on the habits, qualifications, or talent of the individual report creator. Bissantz DashBoard come with these standards built in, ensuring that all reports follow consistent rules.
Automatic Configuration.
Like all Bissantz tools, Bissantz DashBoard for Power BI are dedicated to increasing productivity through automation. It offers simple toggles to adjust the structure of a report – the software takes care of precise formatting and layout. Automation reaches its full potential when combined with the Bissantz Analytics Kit for preparing the data model.
Human-
centered BI.
We conduct our own foundational research on data visualization, particularly in the field of neurobiology. Based on this research, we reject the use of charts and business graphics. They often impose visually exhausting reading paths, suffer from systematic issues in scaling and labeling, and are too unreliable and costly for controlling and business management. Graphical tables avoid these shortcomings – and with Bissantz DashBoard, they are just a few clicks away in Power BI.
Integration with the Bissantz Analytics Kit.
Bissantz DashBoard and Bissantz Analytics Kit for Power BI – Intelligent Analytics on a New Level.
The core of our Power BI offering is the Bissantz Analytics Kit. This intelligent software component automatically reviews and supplements your Power BI data model. Missing dimensions, hierarchies,
or elements essential for meaningful analysis are added or corrected. This creates a data foundation that meets our standards – even if the original data structure didn’t.
Standardized Modeling.
In Power BI handles Bissantz Analytics Kit all the technical details required for sophisticated business applications – the very tasks that typically demand significant effort. A consistent time dimension with clear elements, calculation groups for comparisons and aggregations, explicit measures for computations and sparklines, account dimensions – all of this and more is now done at the push of a button, without any DAX coding.
Integrated
and Open.
The Bissantz Analytics Kit integrates directly into Power BI Desktop as an external tool. A smart assistant identifies gaps in your existing model and can immediately close them. You benefit from these improvements right away when designing reports and dashboards. With just a few clicks, you can implement the award-winning and patented visualizations known from DeltaMaster – using our Bissantz Tables visual. Other visuals or external applications, such as DeltaMaster, can also work with the enhanced model.
Experience Cast
into Software.
The Bissantz DashBoard and Bissantz Analytics Kit are the results of decades of experience from business intelligence and performance management projects, combined with extensive in-house research in fields such as neurobiology and perception psychology. Because in the end, management information must be read, understood – and above all: lead to action. To achieve this, clear rules and principles are needed for both modeling and presentation. Bissantz brings this expertise into Power BI.
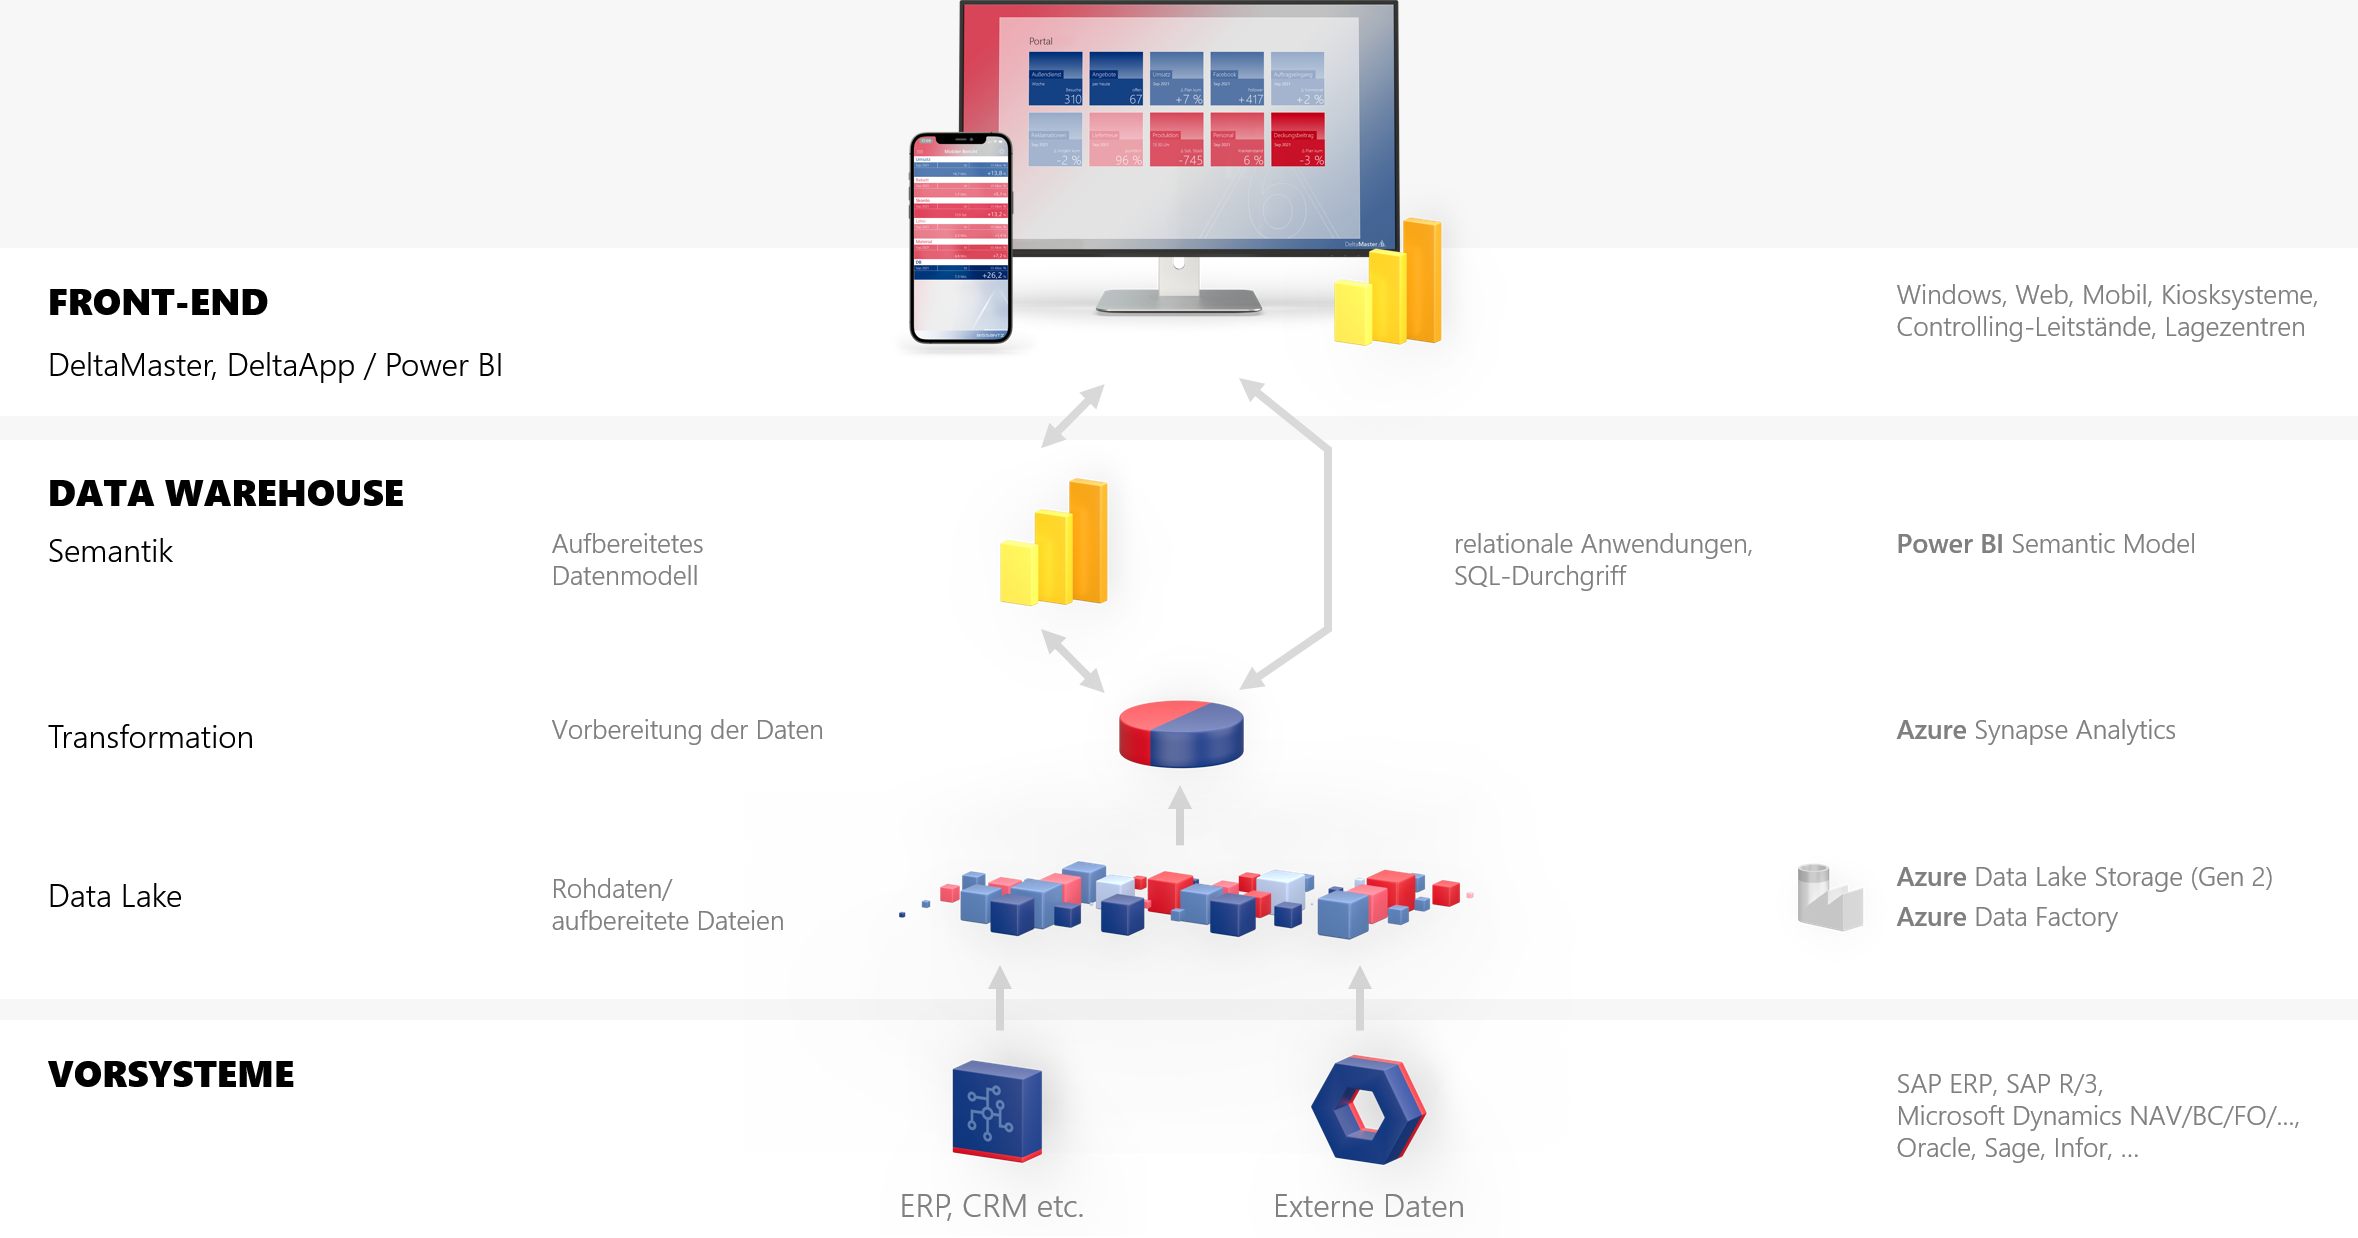
More performance, less effort.
Our architecture facilitates the seamless integration of all relevant systems, ensuring efficiency and ease of use.
Request a Consultation!
Efficient planning. Seamless integration. Contact us anytime for details.

André Schuster
Team Leader Partner Management

Michael Nordhausen
Head of Sales

Sabrina Jäger
Account Manager
Using PowerBI but want the benefits of Bissantz-style analytics? Then our Bissantz DashBoard is your solution. Get in touch – we’ll show you how the Bissantz Analytics Kit and our Bissantz DashBoard for PowerBI help you gain new insights from your data.
We take the time to answer your questions, think along with you and advise you as equals. Our team provides practical and solution-oriented support to companies of all sizes, with a focus on planning, controlling and data integration. To proceed, simply reserve your preferred date.