![]()
Greetings, fellow data analysts!
“Making predictions is difficult, especially about the future,” once commented the Danish physicist and Nobel Prize winner Niels Bohr. Who can argue with that? Wrong forecasts don’t just come from the weatherman. There are tons of famous people who make prophesies about almost every aspect of life – that are downright wrong. Everyone knows that. But despite the difficulties that lie in the very nature of making predictions, we have to look ahead, gauge what lies before us especially if we have already anticipated something and made plans for the future. In that case, we have to keep our eyes open so that we quickly realize when things look as if they could get out of hand.
Fortunately, tried-and-true business methods like the trumpet curve help proclaim when trouble is on the rise. It shows us where we stand, how we are progressing and where we are headed – without relying on psychic mind-reading powers. That’s why it has been an integrated part of DeltaMaster since 2003 – not as a crystal ball gimmick but as a pragmatic, robust and elegant instrument for your budget-actual comparisons. And as we can clearly see, it is about time that we introduce you to it!
Best regards,
Your Bissantz & Company Team
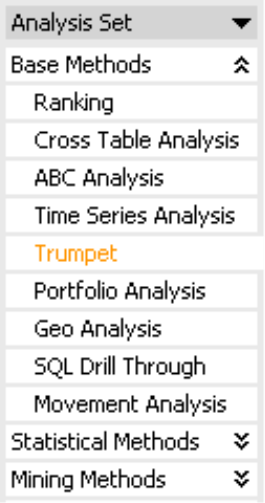
DeltaMaster offers several different investigative methods to get to the bottom of budget-actual variances – and the trumpet curve is the Sherlock Holmes among them. In addition to visualizing past deviations, it provides an outlook into the future by predicting what could happen based on several possible scenarios.
The trumpet curve, which is one of the basic analysis methods in DeltaMaster, helps you observe variances over time. If you are willing to tolerate a certain range of fluctuation, this analysis will help you see if individual target values can be fulfilled in the future.
What is so unique about this analysis is that the window of tolerance shrinks over time. DeltaMaster, therefore, accounts for the fact that a budget variance at the beginning of the fiscal year is less critical than one at the end if it can be compensated in the remaining months. As the end of the fiscal year approaches, however, the numbers should be closer to the targets because there is little time left to fill the deficit through counteractions. Larger fluctuations that take place at the beginning of an observation period should be reconciled in the cumulated sum so that things run more smoothly and finally level off towards the end of the period near the target value.
When viewed from right to left, this tapering corridor resembles a trumpet, which is characteristic for this type of comparison. This analysis method identifies sudden trends more quickly than rigid corridors, while avoiding unnecessary panic attacks when fluctuations happen at the beginning of the year.
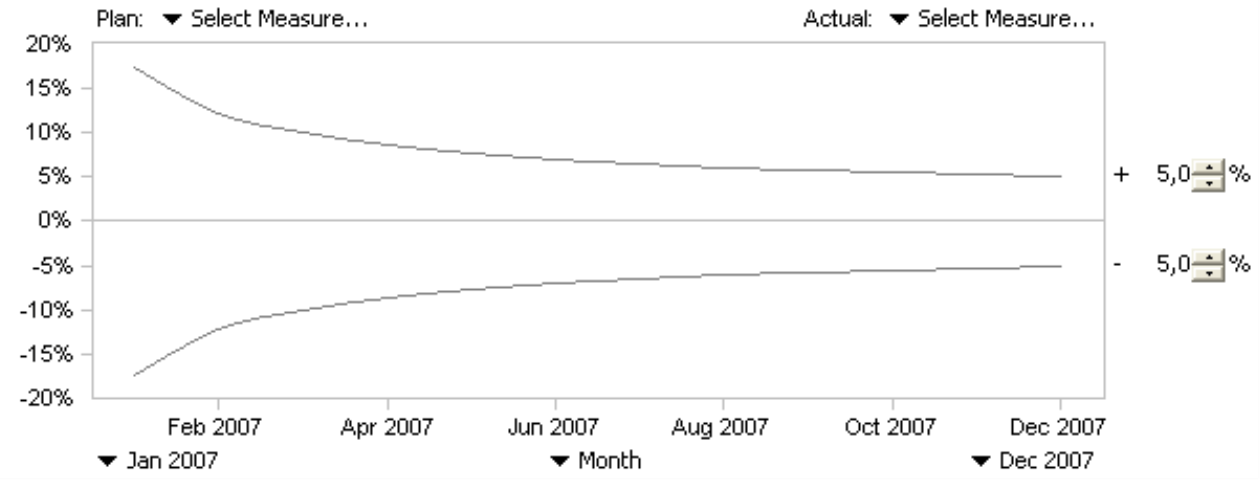
As we can see from the preview, the module requires two analysis measures: one for budget numbers and one for actuals. These are often filtered values in which the base measure, e.g. revenues, was fixed on the budget and actual members in the ValueType dimension[1]. DeltaMaster automatically calculates variance as follows:
Variance = Actual-Budget/Budget
The cumulation also takes place automatically. The chart’s x-axis represents time, while the y-axis shows the cumulative variance in percent. On the right-hand side you determine how much variance (higher as well as lower than the target value) will be tolerated. Both tolerance figures as well as the number of time periods determine the course of the trumpet curve.
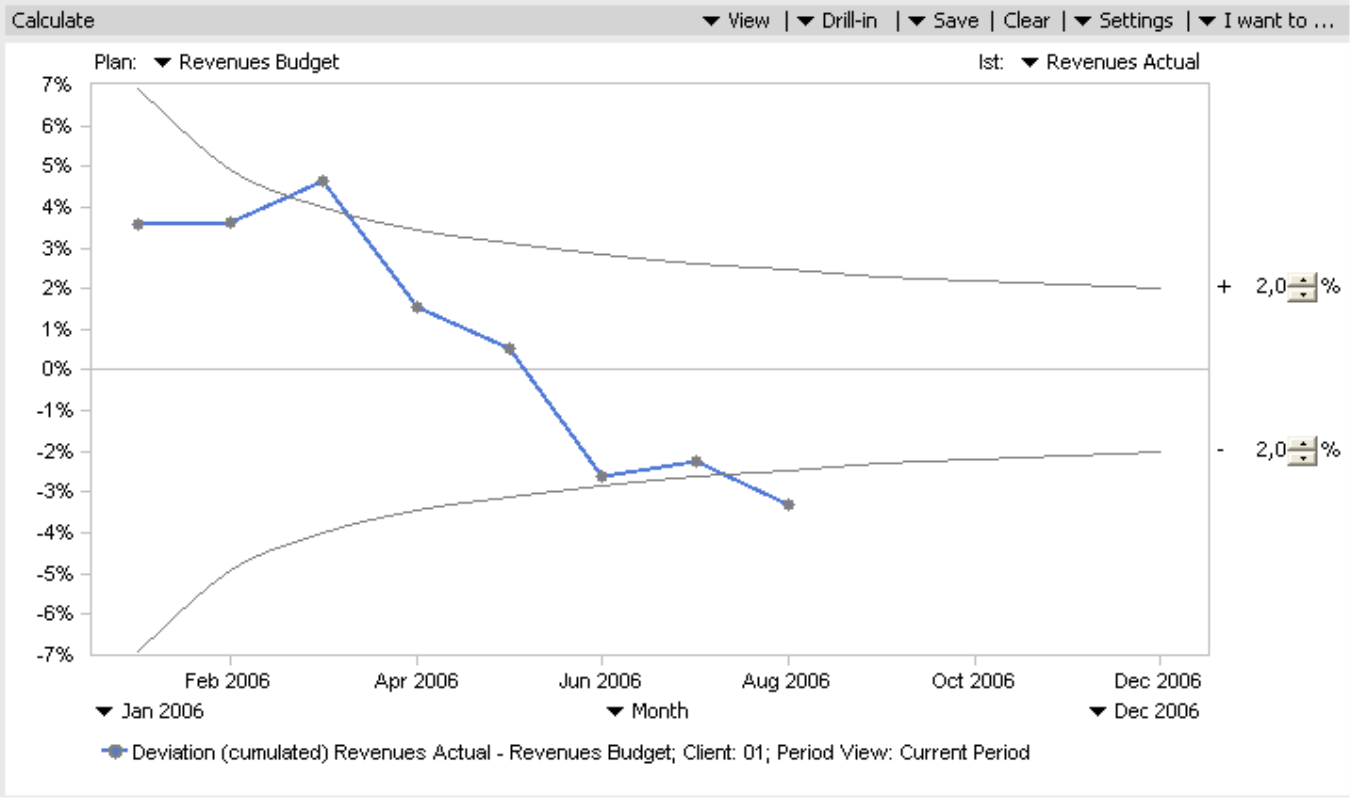
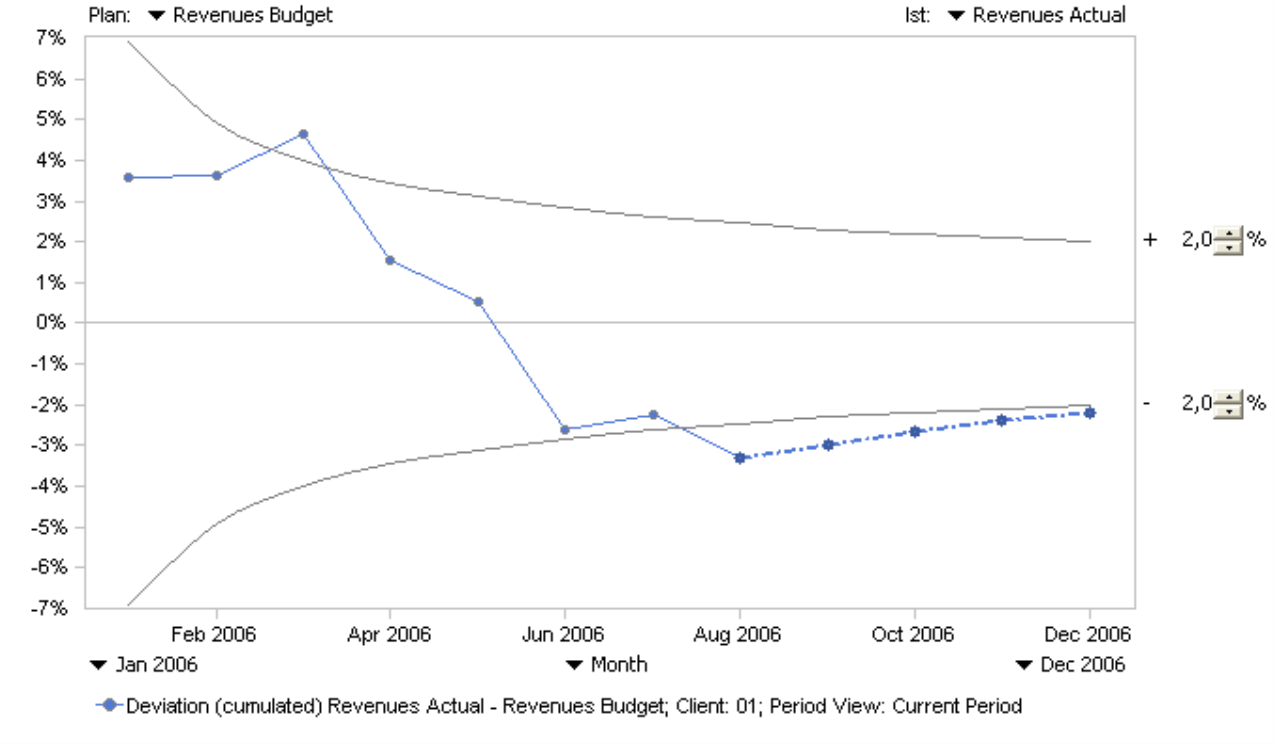
Let’s assume it is September 2006 and you want to know if the revenues for a certain client are on target with your budget. The variance should not differ more than +/- 2% of the budget at any given time in the year. In the example on your right, the blue line shows how the relative, cumulative variance has evolved in the first eight months of 2006. It ends in August, because there are only budget figures for the remaining months in fiscal year 2006, and variance cannot be calculated without actuals
.
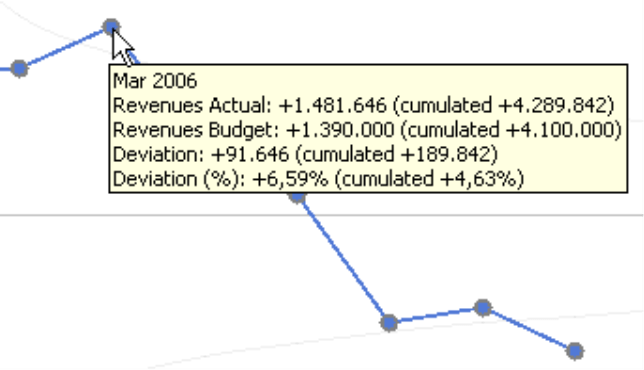
If you mouse over one of the points on the line, a tooltip gives you fast access to the underlying actual and budget values in addition to the absolute and cumulative variance for the chosen period as well as the entire time frame up until that point. As in all analysis modules, you can choose to view a table in addition to or in place of the chart (View menu).
The developments are alarming. After a good start to the fiscal year, the year-to-date variance became negative in June and even fell below the trumpet curve in August – which means that the year-end target is in danger! If you look more closely, you will also see that revenues had dropped in May for the second consecutive month and that this downhill trend was clearly visible – unlike in a typical traffic light scenario, in which even the May budget would have been rated positive. At any rate, there is no time to waste. You need to get to the bottom of this.
At this stage you could use DeltaMaster’s Threaded Analysis Technology. By double-clicking on a point, you can zoom the view to a given month to analyze the situation more closely. Alternatively, you can mark a point (or several by clicking the CTRL key) and create a view for a consecutive and more detailed analysis with the Drill-in menu. If necessary, you can display the Toolbar from the I want to… and context menus for multiple chart options and more.
The second option to delve more deeply into the negative developments is to look into the future. DeltaMaster currently offers two projections for the months to come. Both are located in the I want to… and context menus and require that you have budget figures for the future time frame.
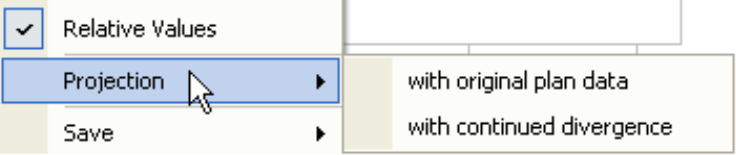
Projection with original plan data (budgeted values)
In the first scenario, DeltaMaster assumes that you will reach 100% of your budget targets for the remaining months so that there is zero variance for each coming month. This projection shows if you can attain the year-end target and land within the allotted variance window.
In this example, you see that if your company can generate the targeted revenues for this client from now (September) until December, the year-end revenue will be very close to the acceptable tolerance range. The variance still lies outside of the set corridor but only slightly. The projection is attached to the existing trumpet curve as a dashed line.
Projection with continued divergence (budget variance)
The second projection takes a worse-case scenario. DeltaMaster assumes that the average variance per period will proceed for the remaining fiscal 2006. In this case, DeltaMaster will calculate the average monthly budget-to-actual variance for the months from January through August and visualize what would happen if the same absolute variance rate pursued in the months from September through December 2006.
You can display both projections simultaneously. In this case, the projection with continued variance shows that you shouldn’t just ignore the developments, because the projected 2006 year-end revenues would be significantly lower than the budget target. If you mouse over a point in the forecast, a tooltip gives you the exact numbers.
Comparing multiple views
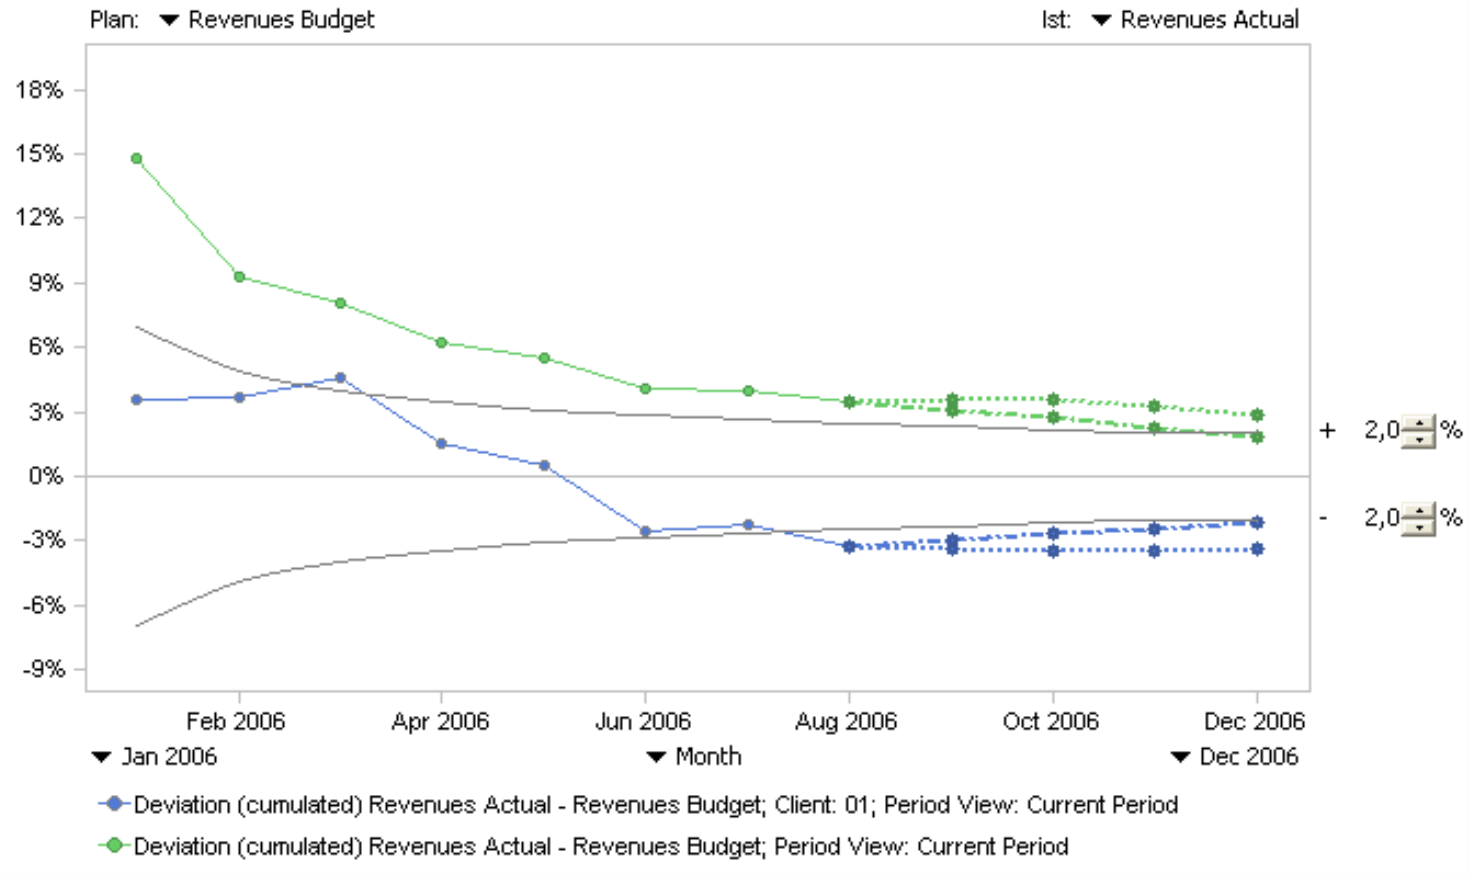
Similar to a time series analysis, you can group several views into a single view. If you change the selection in the My View window and then click again on Calculate in the analysis, DeltaMaster identifies the new situation and calculates it separately on the same chart.
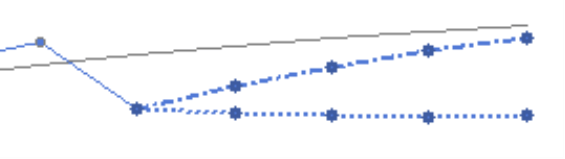
In this case, additional lines will appear in the same chart. In the example below, you can compare the development with a single client (blue) with that of all clients (green). Both projections were also run for each of these views, whereby the projection with continued divergence is marked with a dotted line and the original budget values are marked by a dashed line.
Questions? Comments?
Just contact your Bissantz team for more information!
[1] Read DeltaMaster clicks! 02/2005 for more information.
