![]()
Greetings, fellow data analysts!
The antique philosopher Aristoteles taught us that a whole is sometimes greater than the sum of its parts. Towards the end of the 19th century, however, the mathematician Giuseppe Peano proved that the whole is, in fact, the sum of its parts. Two sciences with two different views – and we can find elements of both of them in Business Intelligence.
OLAP applications deal with lots of sums and even more parts. Views, filters, rankings, or limitations affect the whole in many dimensions and on different levels. And it soon it becomes difficult to differentiate what is a part, what is a sum, and which part belongs to which sum. Nevertheless, we still have to calculate it exactly.
Fortunately with DeltaMaster, you don’t have to solely depend on the sums that come out of the database. Using many different options, you can easily group and add things together that belong together. Sometimes data analysis is more than just data and analysis. Then, it’s DeltaMaster.
Best regards,
Your Bissantz & Company Team
Management information primarily deals with concentrated data. Individual events, products, deliveries, transports, contracts, etc. don’t interest us much initially. Instead, we want to observe them in a condensed, aggregated form as a sum. We may want to access individual data records occasionally but usually only if we already discovered an important section in the concentrated data. (In this case, DeltaMaster’s SQL Drill Through function can provide further insight. See DeltaMaster clicks! 7/2006 for more information.) There are many different possibilities to add sums in our analytical applications. This edition of clicks! will introduce and explain a few of them.
Sums in the OLAP database
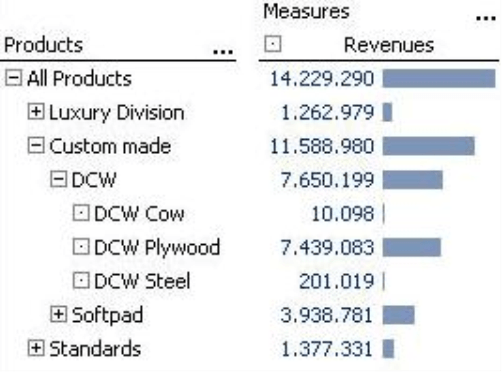
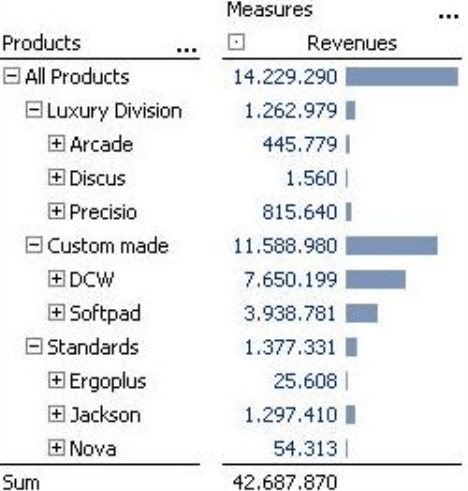
OLAP databases are designed to aggregate data. Most times, these databases have even pre-calculated the sums or other aggregations that you frequently need so that that they can deliver fast results. You already know these types of sums, for example, from the pivot tables in DeltaMaster. The nodes in the hierarchy don’t just organize the respective objects (e.g. customers, products), they also have a value themselves – namely, the aggregation of their subordinate members. As a result, these members are called ‘aggregated’ or ‘sum’ members. In the screenshot on your right, these are all members that are marked with a ![]() or
or ![]() sign. Depending on the underlying database, you can use different aggregation functions, for example, Count, Minimum, Maximum or Average. The most common aggregation, however, is the Sum.
sign. Depending on the underlying database, you can use different aggregation functions, for example, Count, Minimum, Maximum or Average. The most common aggregation, however, is the Sum.
Sums from the database are both fast and flexible. You can drill down on the next lowest level and easily evaluate them using DeltaMaster’s built-in analysis methods. All you have to do is simply drag and drop the value into the Analysis window.
Row, column and table sums in the pivot table
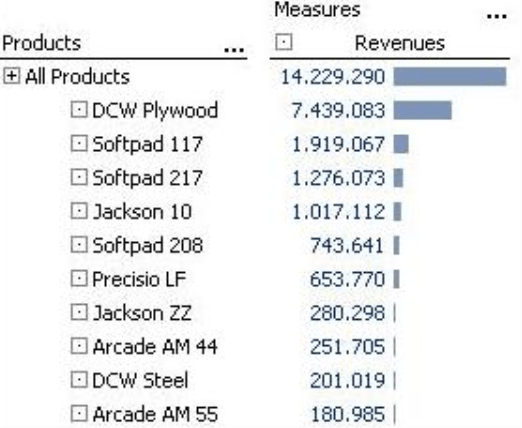
You can’t, of course, create a separate member in your OLAP database for every possible aggregation. If you only want to display your top five products instead of all of them in a report, you might need to recalculate their sum. To clear up a common misconception, this does not automatically equal the value of ‘All products’ or another aggregated member. Their values are defined in the database so that they include all subordinate members – and not only that portion of the members that remain after the filters and other limitations in the report. The value of an aggregated member, therefore, is not the sum of the displayed underlying values.
As a result, the aggregation will also not change if you adjust your list to show the top ten products (Axis definition, Ranking tab). It still refers to ‘All products’ and not the members that are displayed in the report.
In this case, you need a tool that only adds up the values that are shown in the report. This feature is located in the context menu of the pivot table. Here, you can calculate different Row, Column and Table aggregations and display them in the table. The Table aggregation works as if you had selected the Row and Column aggregation simultaneously. In other words, it saves you a few mouse clicks. You could also select multiple functions at the same time, for example, the Sum and the Average.
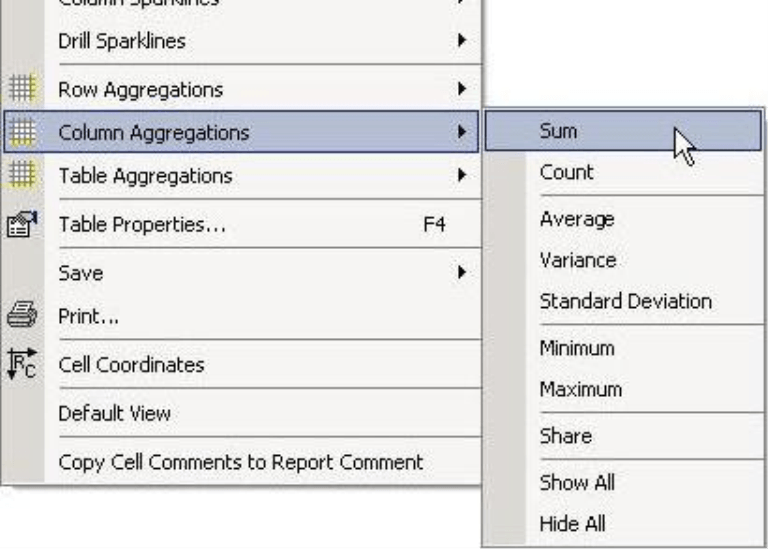
These Row, Column and Table aggregations calculate the displayed values. Using these options, you can finally reach your objective of adding up the values that are displayed in the current report (instead of a sum from the data model). Please note, however, that this function really includes all displayed values. The default setting, therefore, can cause unexpected results if the pivot table contains both the parent and its child members as shown in the screenshot on your right. Here, the sum is three times larger than expected because it includes the product groups, the subtotals for Luxury Division, Custom Made, and Standards, and the total sum for all products. The calculation is correct – but probably not exactly what you wanted.
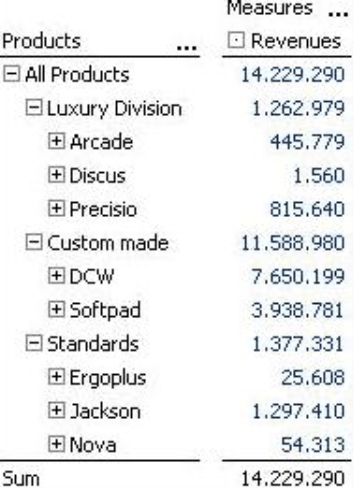
In order to attain the desired sum, you need to define the level on which DeltaMaster should calculate aggregations. Starting in DeltaMaster 5.4.2, you can select this level in the Axis definition on the Options tab. If you select the option (all), DeltaMaster will calculate all displayed members in the aggregation. The other entries ensure that only the displayed members from this level will be added up.
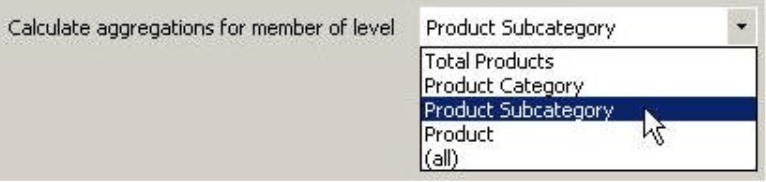
By editing this setting, the aggregation works as you would expect.
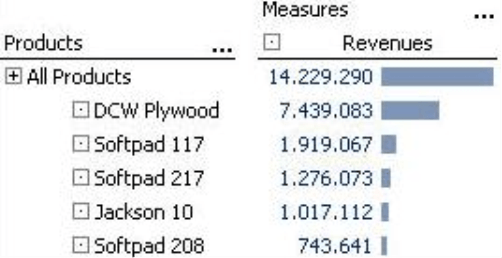
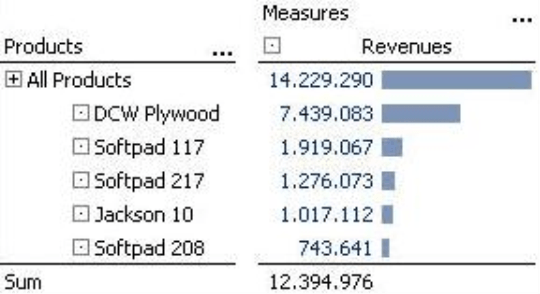
Now, let’s go back to our example report showing the top five products. As you can see in the screenshot to your right, this report also benefits from a column aggregation with the correct level reference. Now you can see the sum of the revenues for the five listed products below as well as the revenues for all products above.
The advantage of using the sums (aggregations) in the context menu is that you can easily add them directly in your report – even if you are working in the Slide Show mode (View menu or F5 function key). These options only extend the current report or cockpit and have no effect on the DeltaMaster analysis model. As a result, you cannot drag and drop these sums into an analytical method or add sparklines to them.
Sums as user-defined measures
You can also create sums outside of the database model for measures. You probably already know, for example, that you can use MDX to create and publish an aggregation as a user-defined measure. Besides that, you can also create a sum using Member property measures and Univariate statistical measures.
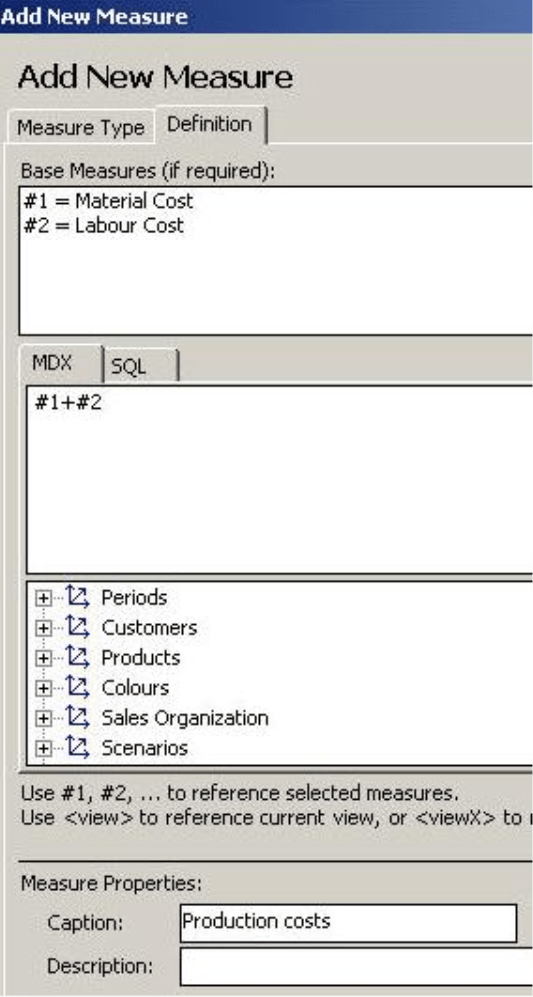
Let’s start with an example for a user-defined measure. You now want to Create [a] new measure in the ‘Chair’ reference model (Model menu; alternatively in the Measure browser: I want to… menu) that should add up material costs and labor costs to show production costs. Using the wizard, you first select the Base measures – ‘Material cost’ and ‘Labor cost’. DeltaMaster will automatically add the short forms ‘#1’and ‘#2’ which you could use in the entry field for the MDX expression. The definition for production costs would then simply be ‘#1+#2’.
In this case the sum is not only an arithmetic operation. It also shows a hierarchical relationship that you can display as such in DeltaMaster. If you press and hold the Alt key in the Measure browser, you can drag and drop ‘Material costs’ and ‘Labor costs’ into the newly created ‘Production costs’ measure.
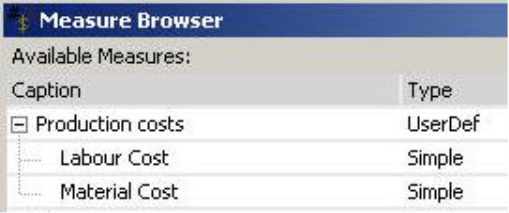
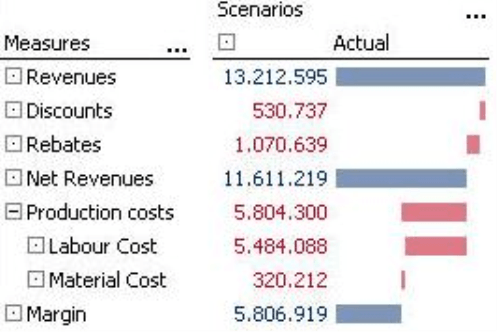
The pivot table can recognize and even visualize the relationship that we have given our new sum value. For more ideas and information regarding hierarchical relationships of measures, please refer to DeltaMaster clicks! 2/2009.
You can also use the aggregation function in Member property measures. This measure type provides access to measure properties that are saved as numerical attributes in the form of a measure. For example, a sample member property for zip code regions could be how many people live in this region. This combination of external and internal data often creates very interesting analyses. In our example, you could use the population figures to calculate the market volume and compare this measure to your sales statistics.
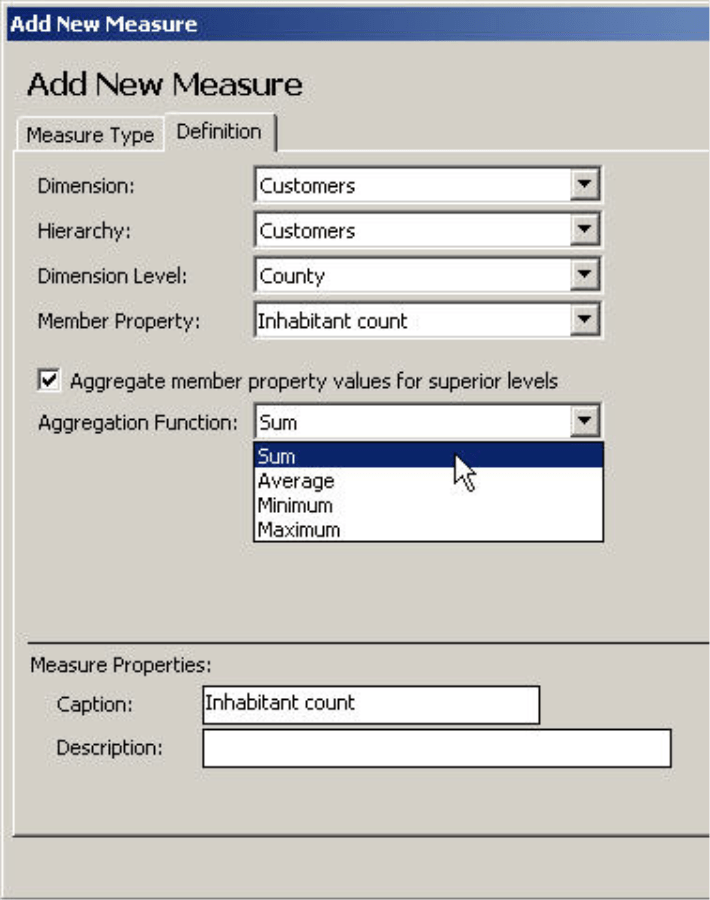
Creating a sum comes into play when you Aggregate the values of the member property for the parent levels. Using our same example, you do not have to provide the population numbers for different levels. DeltaMaster can calculate the correct values for the higher levels (e.g. district, region, company, all) itself based on the entries for the subordinate zip code regions.
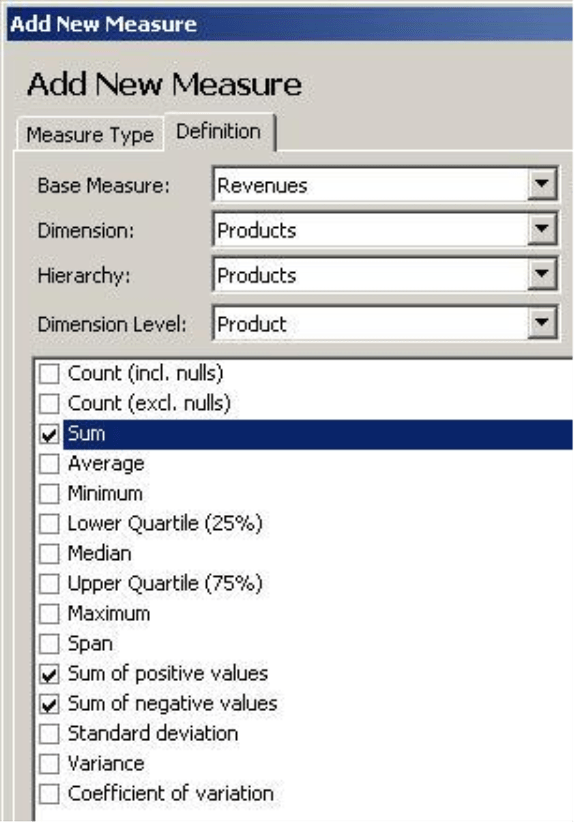
Sums are also an option for (univariate) statistical measures. We introduced this measure type in detail back in DeltaMaster clicks! 7/2009. One thing to note is that you can use these measures to add up positive and negative values separately, for example, in order to analyze compensation effects.
Rolling sums in time calculated members
Cumulations, such as ‘Year to date’ (YTD), are a very common example of building sums. In most cases, you would create these using time analysis members either in a separate helper dimension for the cumulation or in a general dimension for time comparisons (time utility). The advantage here is that you can combine the different period views with any other dimensions or measures. The term ‘cumulation’ is generally used when the time frame in which the values are added together has a defined start and a variable length. A monthly cumulation ‘until March 2009’ includes the three months from January through March 2009, while ‘until November 2009’ includes the eleven months from January to November 2009.
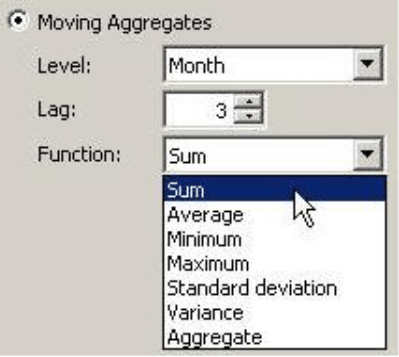
Moving aggregates have a different effect. They include the last ‘x’ periods. In the Editor for time analysis members (Dimension browser, I want to… menu, Add time analysis member), you can determine on which Level of the time dimension the aggregation should take place (e.g. month), how many time periods should be included (e.g. 3 months) as well as which aggregation function should be used (e.g. sum).
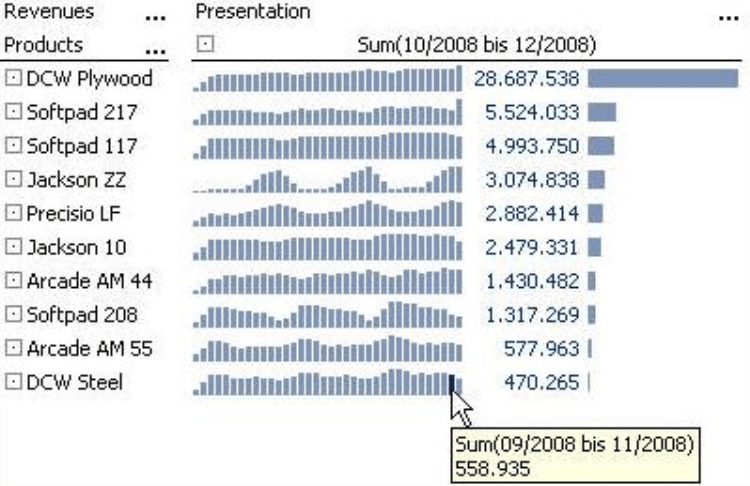
In a pivot table you can create sparklines for these types of calculations. Rolling sums generally create very interesting patterns because they iron out the outliers. In the tooltip for each column, you can see which time frame the sum (which the column represents) is referencing.
Moving aggregates are always defined in reference to a certain level of the time dimension. Please ensure that a member of the appropriate level is always selected in the View. For more information about Time analysis members, please refer to DeltaMaster clicks! 8/2007.
Sums as calculated members
Time analysis members are a special type of calculated members. In their general form – with user-defined MDX expressions – you can create a wide array of calculation rules. In your customer dimension you could Add a calculated member (Dimension browser, I want to… menu), that determines a sum for all base members of this dimension – except for one. This can be useful if you have to tally sums for different organizational units or subsidiaries on a regular basis but your own unit should not be included in the total.
To fulfill these requirements, we need a little MDX.
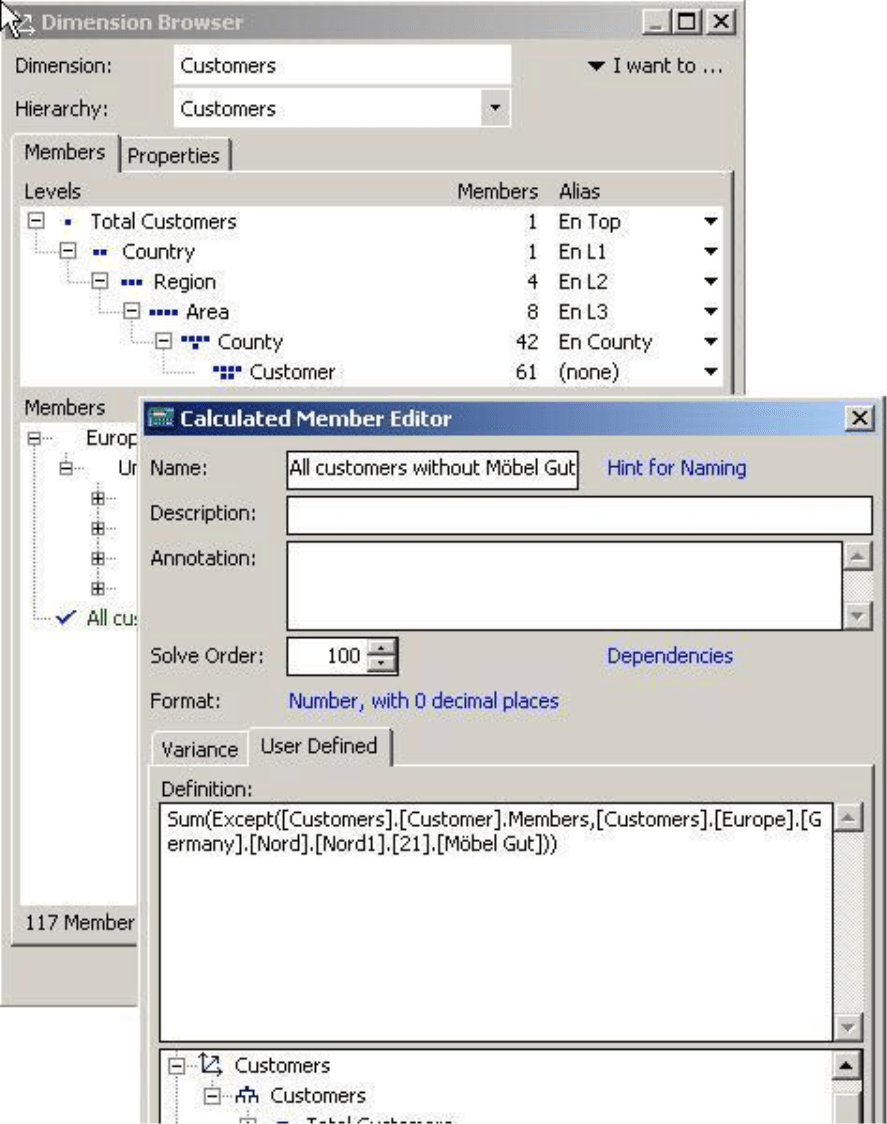
The following expression calculates the sum for all customers except for customer ‘Möbel Gut’:
Sum(Except([Customers].[Customer].Members, [Customers].[Europe].[Germany].[Nord].[Nord 1].[21].[Möbel Gut]))
The external expression ‘Sum()’ does the addition which includes the values for all members that are listed in the parentheses. Here, we have added a further MDX expression ‘Except()’. This delivers all members on the level of individual customers (‘[Customers].[Customer].Members’) except for the customer listed behind the comma, namely: (‘[Customers].[Europe].[Germany].[Nord].[Nord 1].[21].[Möbel Gut])’).
The advantage of defining this exception as a calculated member (and not, for example, as a filter rule in a pivot table) is that you can easily reuse it. You can access this member in all analytical methods and in combination with all measures.
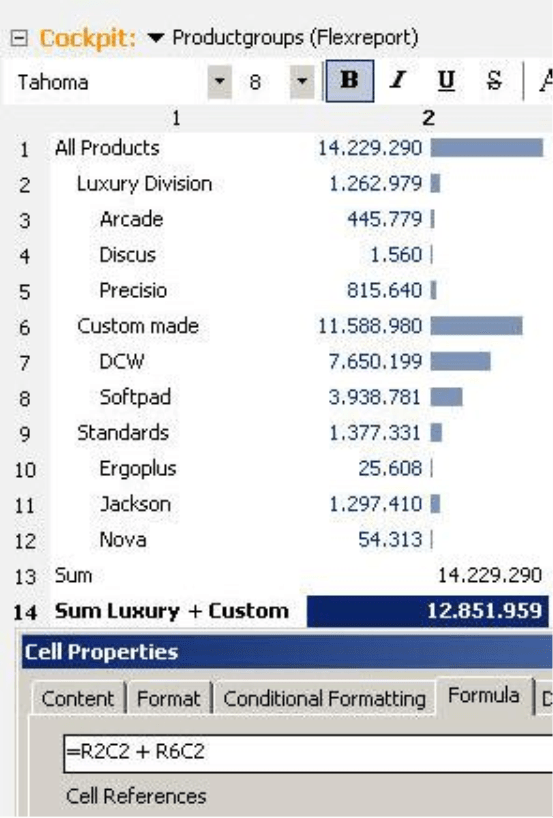
Sums in a Flexreport
The Flexreport supports many different ways to build sums. The simplest example: Similar to a spreadsheet, you can use a ‘+’ to add multiple cells together. For this to work, the Cell properties must have Formula as their content type (context menu or F4 key). You can then enter the desired calculation on the respective tab. Simple use the standard RC notation to reference the cells using cell coordinates.
If you need multiple cells from a certain area, use the ‘=Sum(…)’ function instead. The cell area will then be listed using the coordinates of two end points, for example, ‘=Sum(R2C4:R4C16)’.
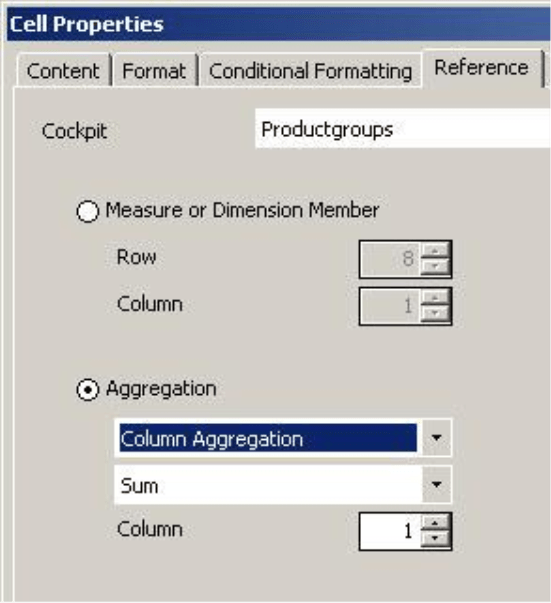
It makes no difference for the calculation where the values in the Flexreport originated. As a result, you could connect values that were imported from Microsoft Excel with numbers from the DeltaMaster application. (For more information on importing values for Excel, please see DeltaMaster deltas! 5.3.8, feature #11. A detailed description on fine-tuning this procedure is described in deltas! 5.4.0, feature #9, and 5.4.1, feature #8.) In many applications, Flexreports obtain their values from a reference to a pivot table (see DeltaMaster clicks! 8/2008). You can also use their Row, Column or Table aggregations – see above – in Flexreports as well. The Cell properties on the Reference tab offer a separate selection list. This way, you can still access the sum even if the length or the width of the underlying pivot table has changed.
Questions? Comments?
Just contact your Bissantz team for more information.
