![]()
Greetings, fellow data analysts!
Inspired by Bela Lugosi’s Dracula, the creators of Sesame Street designed a lovable creature with a pointy beard and an undying love for numbers. We are talking, of course, about the Count of Count, or better known among his fans as just ‘The Count’ because his title of nobility and his hobby are one and the same word.
In Business Intelligence, we are also passionate about numbers. Fortunately, however, we can remain a bit more reserved because DeltaMaster does the counting for us. In this edition of clicks! we will also do some counting – for example: customers, patients, business units, products, parts, containers, calls, repairs as well as all of the underlying subjects and objects that we can sooner or later measure in hard currency. As always, DeltaMaster has a complete series of methods to help – which we will count out on the next 7 pages.
Best regards,
Your Bissantz & Company Team
Every business professional knows that you need to take inventory by type, quantity and value. Many past editions of DeltaMaster clicks! have focused on analyzing values. This time, however, we will concentrate on quantities. DeltaMaster offers many different ways to add up members and use the count in further analyses. In this edition, we will introduce and compare these different options by counting the customers in our ‘Chair’ reference application. You can, of course, use these same techniques to count all types of components in your reports.
Counting master data
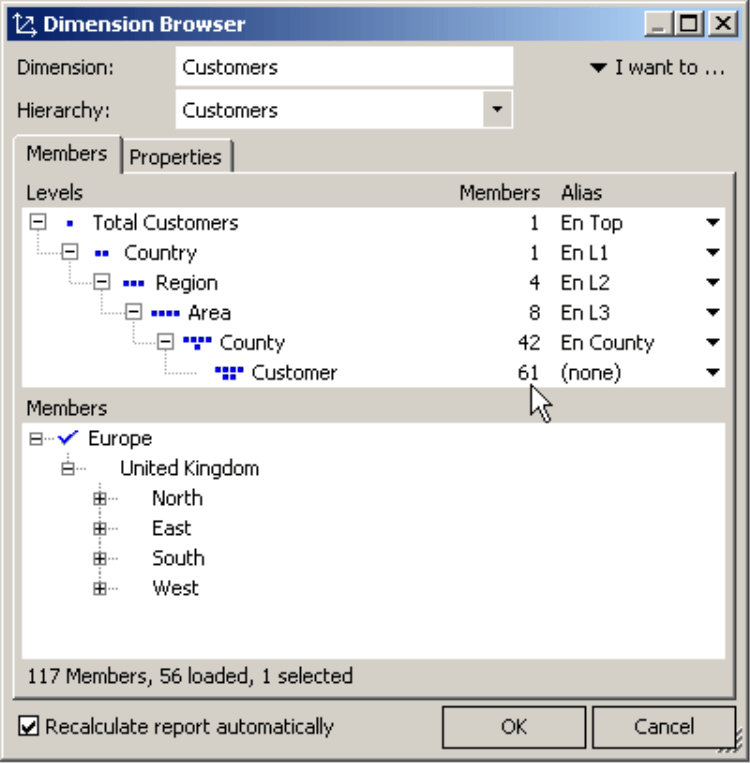
The Dimension browser provides a quick overview of the number of members. In the upper part of the window, DeltaMaster lists the levels of the selected hierarchies as well as how many Members belong to each level. In this scenario, the ‘Chair’ application has 61 customers.
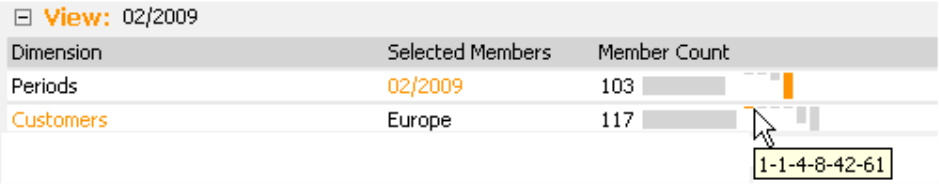
In the View window, you can also Show [the] member selection by selecting the respective function from the context menu or the I want to… menu. The entry in the Member count column refers to all members of the respective hierarchy including the aggregated members. In the customer dimension that total is 117, the same number that is listed in the bottom part of the Dimension browser. A bar which resembles a graphical table and is located behind the number shows how this value fits in relationship to the other member counts. Following this bar, a miniature chart similar to a sparkline shows the breakdown of the members on the hierarchy levels.
If you mouse over the graphic, a tooltip will display the exact values. In the screenshot above, the tooltip is ‘1-1-4-8-42-61’. This means that there is one member on the top level, 1 member on the second level (country), 4 members on the third level (region), 8 members on the fourth level (area), 42 on the fifth level (county) and 61 on the lowest level (customers).
These are the same numbers that you have just seen in the Dimension browser. When you display these members in the View window, you always have these numbers at hand and can quickly see how large or small the current quantity structure is. These entries describe the master data of the analysis model – in other words, the maximum number of all objects that you can see in the analysis session including ‘not assigned’, ‘missing’ or other null members. As intended, the current view, filters or other criteria do not apply here.
The view, filters and other limitations, however, play an important role in business analyses and reports. If you are looking at a particular view – for example, a period of time, region, subsidiary, or conditions – you want to know how many customers, patients, business units, products, parts, containers, calls repairs etc. are in that view and not in the entire dimension. And in most cases, you want to count the number of members in a report and even use that number for further calculations.
Counting rows in pivot tables
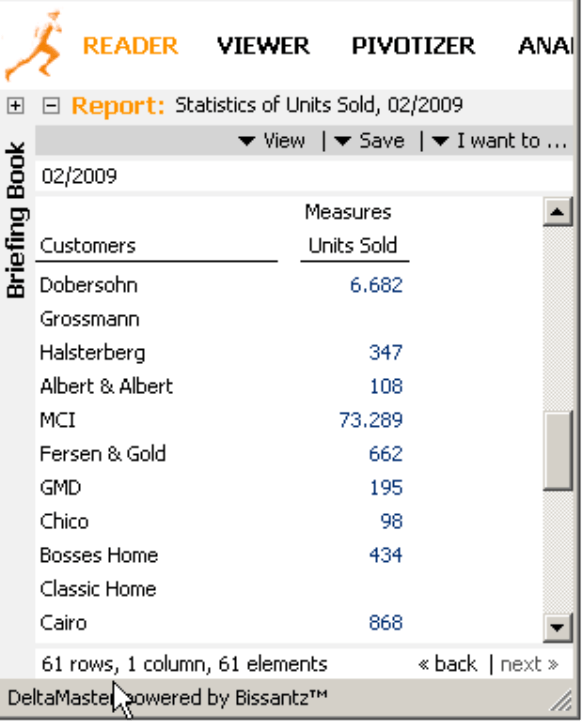
In some cases, all you need to do is to look at the status menu below the cockpit or the report. In pivot tables, for example, DeltaMaster displays the number of rows and columns that contain data; column and row labels are not included in the calculation. In the screenshot on your right, you can see that the table has 61 rows – the same 61 customers that were already listed in the Dimension browser.
In order to correctly interpret the row and column number, you need to ensure that a member that you want to count is really located in each row or column. That means that you need to pay attention to these three factors:
- The axis in question should not be nested. If your pivot table shows the respective product groups for each customer, the table will be significantly longer and the number of rows will not equal the number of customers.
- The respective axis should only show one level of the hierarchy. Otherwise, the rows containing subtotals (i.e. aggregated members of higher hierarchy levels) will make the table longer.
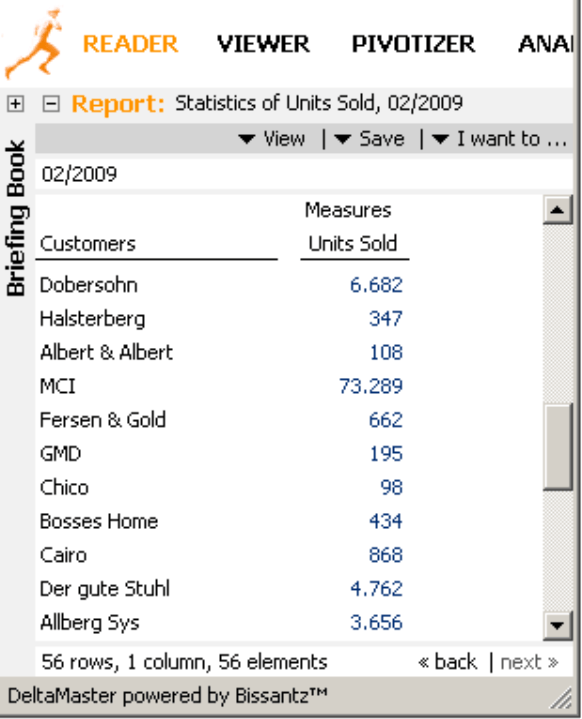
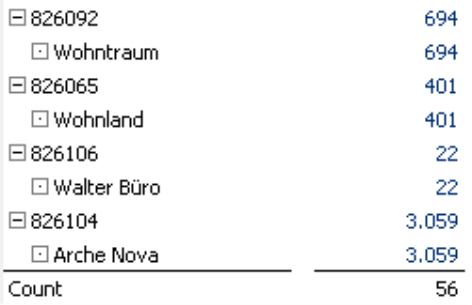
- DeltaMaster will include empty rows and rows containing a 0. To fix this problem, simply select the Hide empty rows or Hideempty and 0 rows option (context menu, I want to… menu or Options tab in the Axis definition). You can also use Filters and certain Ranking options which are available in the Axis definition to shorten or extend the pivot table. The screenshot above, for example, includes empty rows – in other words, customers who did not buy anything during the respective month. If you Hide [the] empty and 0 rows, DeltaMaster will reduce the number of rows to 56. That means that 56 of 61 customers have purchased something in the current month.
Counting through table aggregations
Instead of deriving the count indirectly from the row count below a report, you can also select the items you wish to count directly in a report. Let’s say, for example, that you want to break down the sales statistics presented above by your three main product groups (i.e. ‘Luxury division’, ‘Custom made’ and ‘Standards’) to see how many customers belong to each of these segments. In this case, the number of rows in the entire table wouldn’t provide the right answer because each customer does not belong to every product group.
You can show the Count as a Column aggregation (or as a Row aggregation depending on the setup of the table) from the context menu of the pivot table. This option also works on the Reader level and in the presentation mode (F5 key or Shift +F5, see DeltaMaster clicks! 9/2009 for more information). Using this option, you can view the count very quickly if it was not already set in the report.
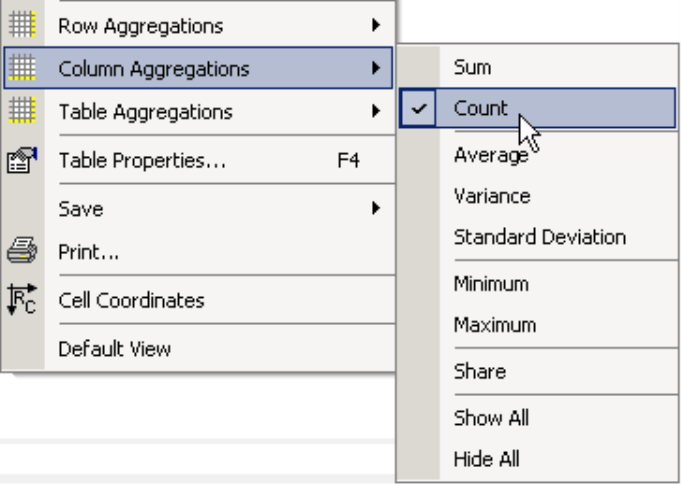
Although this option also accounts for nested axes, the multiple hierarchy levels in the table will not have an effect on the desired result. Since version 5.4.2, you can choose if DeltaMaster should only calculate the members for a certain level (Axis definition, Options tab; see DeltaMaster deltas! 5.4.2, feature #24).
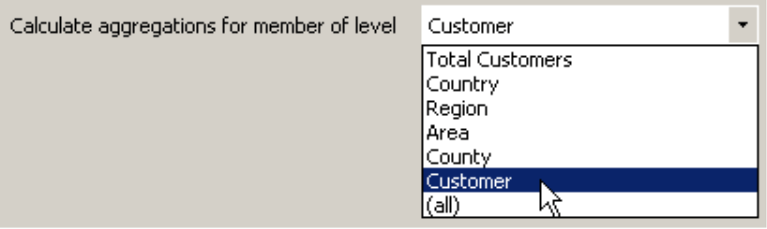
If you choose the ‘Customers’ level as shown above, you will get the result shown here on your right. In this case, the aggregations for the county codes have no effect on the displayed number of customers.
This count does not include the options for suppressing empty rows and columns or the Filter and Ranking options from the Axis definition. DeltaMaster will include a cell with a value of 0 but not an empty one.
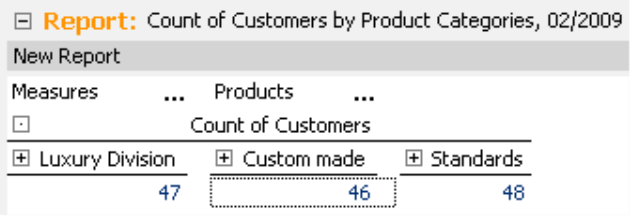
If you place the products as the second dimension in the pivot table and visualize the main product groups, DeltaMaster will differentiate the count: 47 of 61 customers ordered from the luxury division, 46 purchased custom-made models and 48 bought standards.
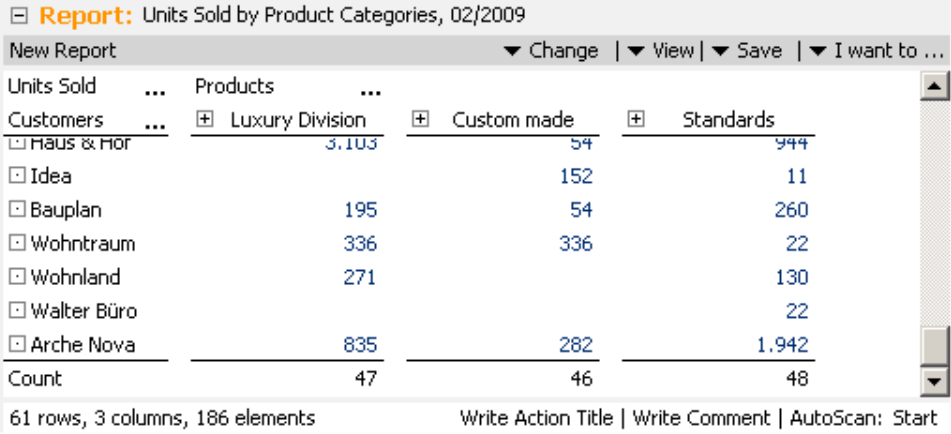
Based on this analysis, you might now be wondering how many customers were active in all three categories. We’ll explain that in detail below.
Counting per measure
Sometimes, the two counting options described above are enough to answer a question spontaneously. However, iIf you want to create a detailed analysis based on this count (e.g. to compare it to the total number, monitor a development over time, or display it regularly in a dashboard), you will need to create a measure.
Here, too, there are many different ways how you can turn a count into a measure. One of these is to create a (Univariate) statistical measure.
To Create a new measure, simply open the respective function from the Model menu (in Pivotizer or higher) and select this option.
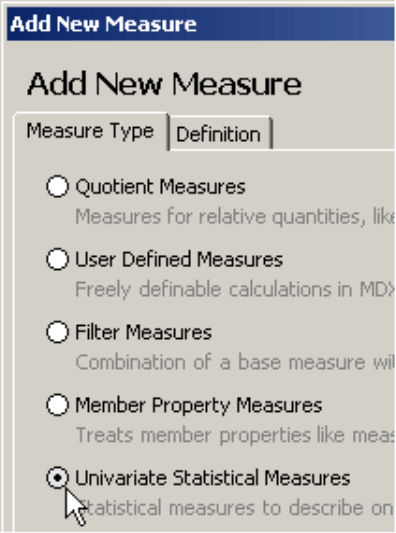
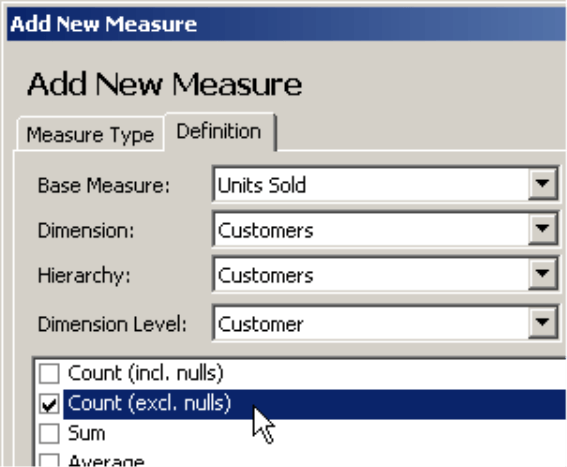
When creating a Definition of the new measure, you will need to determine which Base measure you would like to examine and which hierarchy level you are referencing. In the bottom part of the dialog box, you can choose from a variety of statistical functions such as sums, averages, means and a count – with or without null values. Since you are only looking for the active customers and not all customers in this scenario, you want to choose the count excluding null values (‘CountExclEmpty’).
The screenshot on your right shows this new measure in another pivot table which shows the count for the (individual) customers that belong to the different nodes of the hierarchy. This is why DeltaMaster displays the total number (56) next to the top member while the (individual) customers are displayed below the regional breakdown.

Unlike the options shown previously, you can now access the count independently from the customer list. And since it is a separate measure, you can drag and drop it into one of DeltaMaster’s built-in analytical methods or use it in further calculations within the analysis session.
You can even use the new measure in another pivot table that doesn’t show the customer dimension. The screenshot on your right, for example, uses the count measure to determine the number of customers per main product group.
The statistical measure is always based on the current View. DeltaMaster does not incorporate filters that are placed in the Axis definition of the pivot table.
One question, however, still remains open: How many customers have made purchases from all three main product groups – in other words, the luxury division, custom made and standards – in the given time frame? The reports that you have seen so far still haven’t answered that question. But the answer isn’t far off…
Counting together
Here, too, there is more than one way to answer this question. Let’s start by creating three new measures –more precisely, Filter measures that calculate the individual sales quantities for the luxury division, custom made, and standards groups. You can also use these measures to filter a pivot table so that it only contains the customers that are active in these three groups. Then, you can display the count by using one of the methods explained on the previous pages or saving it as a new measure for further use. But… one after the other:
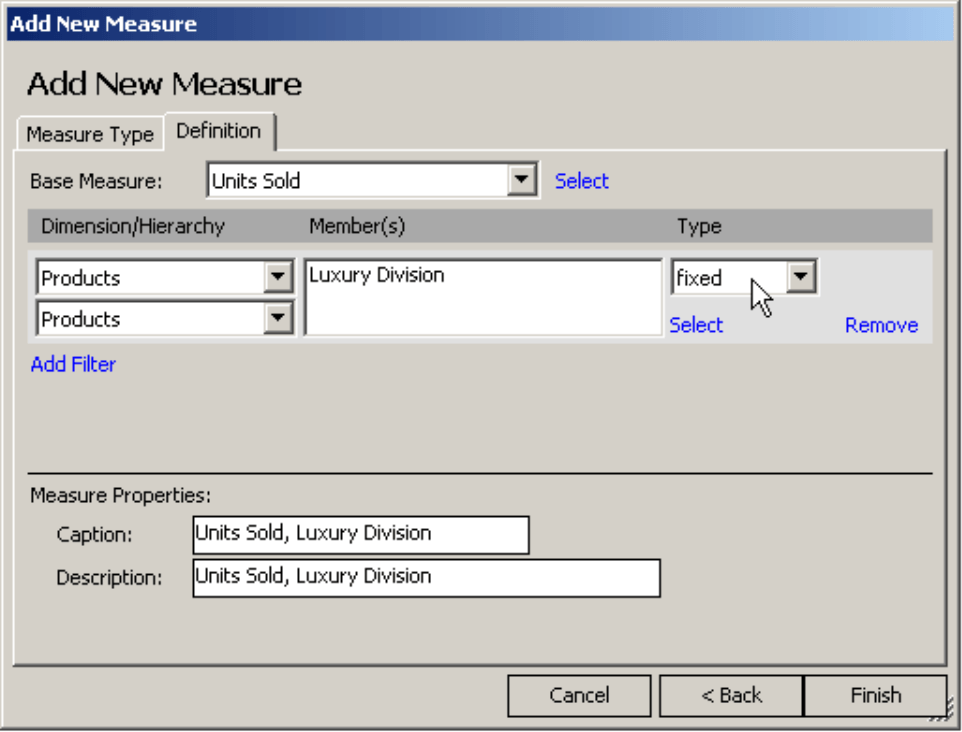
To start, create a New measure (Model menu) and choose Filter measure as the type. This measure should only include luxury models in the product Dimension/Hierarchy. Now, click on the Select link and choose the ‘Luxury models’ member. The filter Type is ‘fixed’.
Now, create measures for ‘Sales quantity, Custom made’ and ‘Sales quantity, Standard models’ in the same fashion.
You can then visualize these measures in a pivot table. Initially, the pivot table will still contain some rows with ‘spaces’. owevThThis time, however, you cannot simply suppress empty or 0 rows because a row is only considered empty when all of its cells are empty or 0.
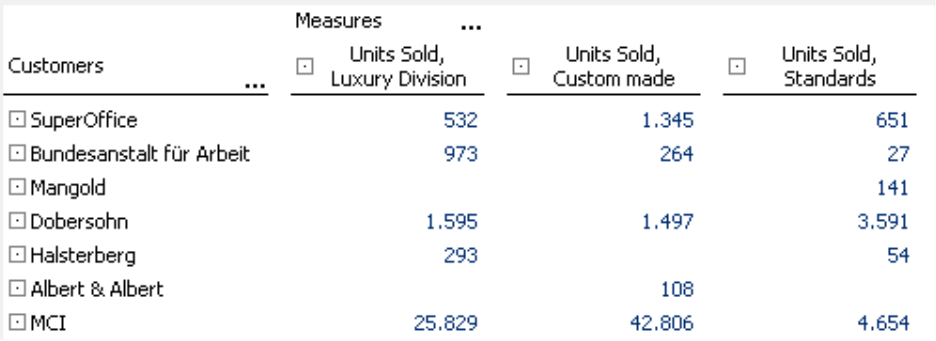
You can achieve the desired results by creating a Filter in the Axis definition. This filter should only show the members of the customer dimension in which the sales quantity is larger than 0 for all three main product Groups.
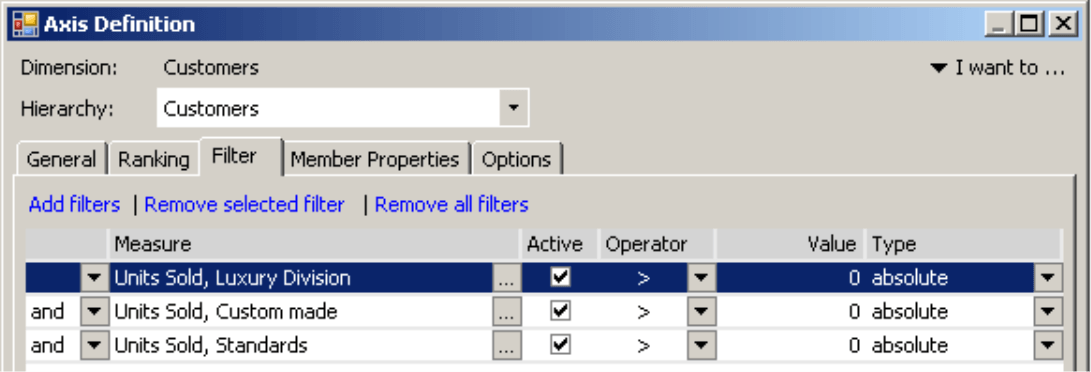
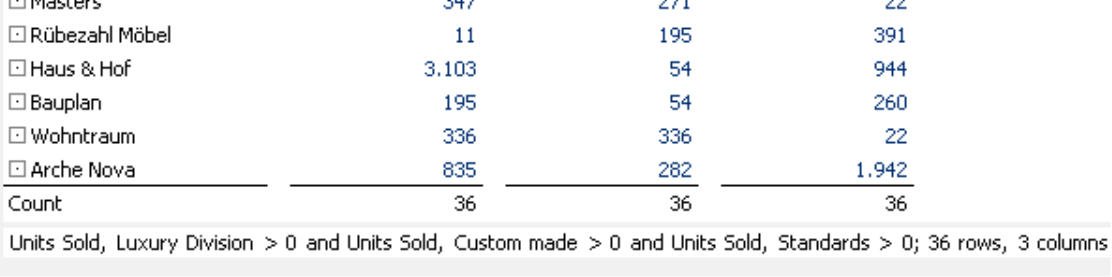
Once you define this condition, you can see the desired number in the status bar and in the displayed column aggregation. In the time frame in question, 36 customers – over half of all active ones – made purchases in all three product groups.
You might want to reuse this number as a separate measure for additional analyses or as part of an informative management cockpit. One way to do this is to use an auxiliary variable which summarizes the three filter criteria from the pivot table.
This time, create a User-defined measure in which you can select the three previously defined filter values as Base measures and enter the following MDX formula:
Iif(#1 > 0 and #2 > 0 and #3 > 0, 1, 0)
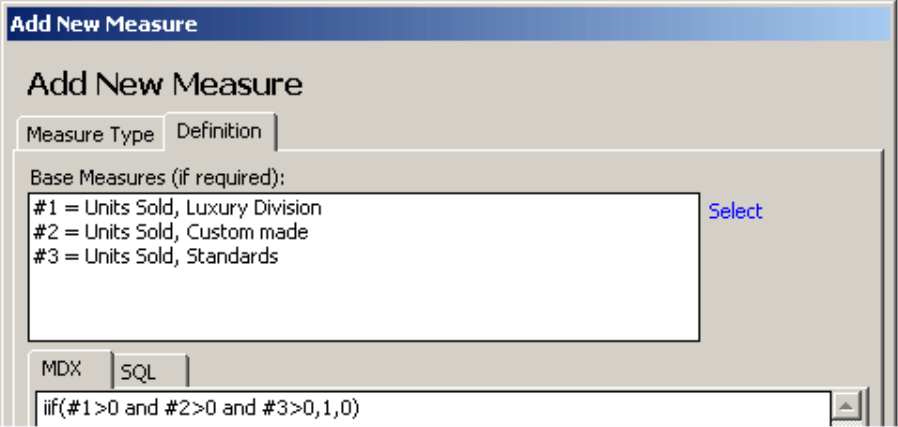
This expression uses the MDX operator ‘iif’. It expects three parameters: a test condition, the value that should be returned if the condition has been met and the value that should be returned if the condition has not. In this case the formula means: if all three sales quantities are larger than 0, the returned value should be 1, otherwise, it should be 0.
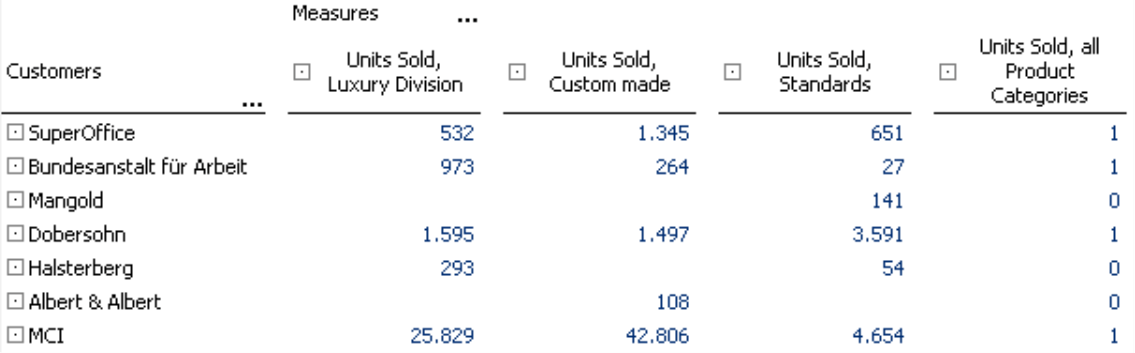
The screenshot on your right shows the results of this expression. In this case, the new measure has been added as a fourth data column in the ‘patchy’ table shown on the previous page. DeltaMaster only displays the value 1 in rows without any spaces – in other words, for the customers that have bought something from each main product group. In all other rows, DeltaMaster will return the measure with the number 0.
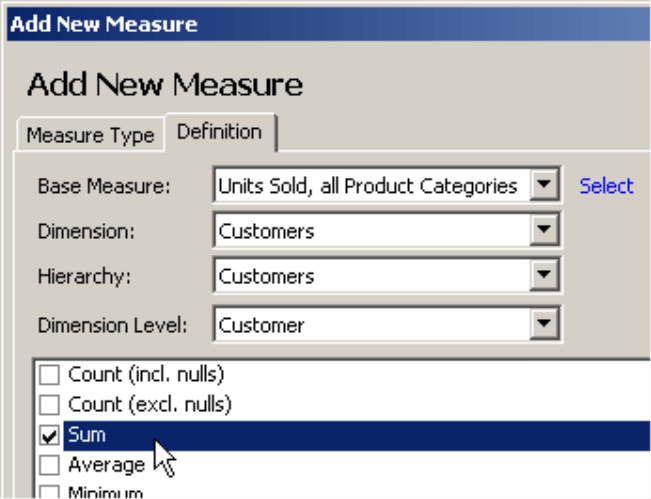
Now, all you need to do is add up the auxiliary variable for all customers to receive the desired number of customers that need products from all three groups. To do this, you have to create a further (Univariate) statistical measure. It uses the auxiliary variable as a Base measure and calculates the Sum for the Dimension level of the (individual) customers.
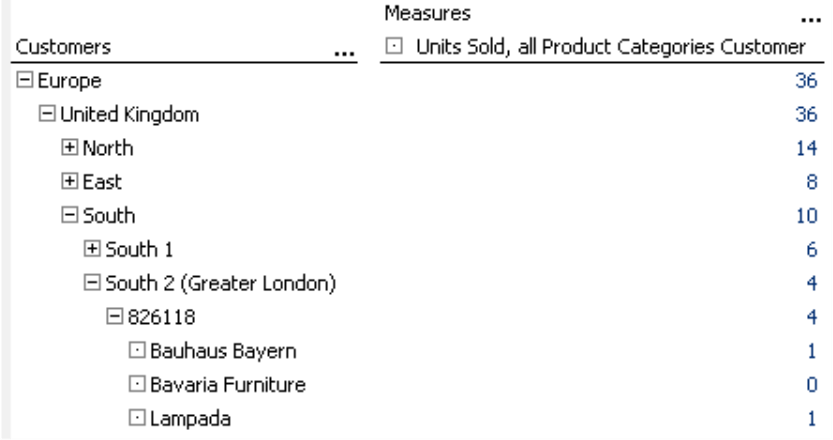
You already know the result of this calculation. The aggregated presentation contains the same number (36) that you previously read in the pivot table. Since this number is now a measure, however, you can reuse it to show a breakdown by percent, add a sparkline or Time series analysis to visualize a development over time, and much, much more – all without having to list the individual customers.
One time or often?
On the past few pages, you have learned many different ways how you can create a count – and there are still many more. Sometimes, you only need to determine and communicate a number. Since you can easily get this information in the tooltip, you do not necessarily have to create a new measure. If you do a lot of calculations with a count, and a similar question occurs not just twice or three times but regularly, you can prepare yourself for future inquiries by creating a measure. That way, you immediately have the information you need and can examine that number in more detail if necessary.
Questions? Comments?
Just contact your Bissantz team for more information.
