![]()
Dear data analysts,
the petition committee of the German parliament had to deal with exactly ![]() 17.999 submissions in 2004. For their processing, the responsible administration employs a staff of roughly 70 people. Luckily, input in information processing causes a lot less effort, and we do not have to enforce attention with appeals and complaints but rather can set to work on our own. The ability to enter data, an important prerequisite for budgeting, prognosis or forecasting applications for instance, is readily available in DeltaMaster. So you can create a seamless transition from the budgeting phase to data analysis and reporting.
17.999 submissions in 2004. For their processing, the responsible administration employs a staff of roughly 70 people. Luckily, input in information processing causes a lot less effort, and we do not have to enforce attention with appeals and complaints but rather can set to work on our own. The ability to enter data, an important prerequisite for budgeting, prognosis or forecasting applications for instance, is readily available in DeltaMaster. So you can create a seamless transition from the budgeting phase to data analysis and reporting.
In the current clicks! issue, we’d like to give you a first overview of data entry with DeltaMaster. Certainly we will be happy to advise you in detail and individually!
Cordially,
Your Bissantz & Company team
It is a characteristic of analytical applications that they access data provided to them by other systems in read-only mode. But in some situations we’d wish to be able to gather data on our own in addition to it, for instance for budgeting, prognosis, forecasting, simulation, contemplating scenarios, “what-if analyses” or simply to complete missing data from the operational systems.
In DeltaMaster, data entry is possible in all user modes from the Viewer up. So DeltaMaster becomes the front-end of choice also for liquidity and financial planning, assortment planning, conditions administration, and many other things in which the user enters data into the system. Users stay in their familiar DeltaMaster environment with the well-known control elements and concepts.
A typical scenario in budgeting might be: The analytical editor prepares cockpits or reports for data input in an analysis session and distributes the .das file to the regional responsibles who enter their budget figures in Viewer mode.
DeltaMaster stores the entered values in the underlying database. How this works in detail largely depends on the used system, and not all database products allow write-back at all.
DeltaMaster currently can write into
- Applix TM1 from release 8.4,
- Microsoft SQL Server (2000 and 2005) Analysis Services, and
- MIS Alea from release 4.1.
It is assumed that the administrator has write-enabled the OLAP cubes and granted adequate rights to the corresponding database users. If the database-related conditions are met, you may enter data in three different cockpit types:
- Measure Charts,
- Pivot Tables, and
- Flexreports.
Besides, the SQL Drill Through module offers manifold ways for user input and database write-back. But as the module name suggests, these options are about relational data and not OLAP cubes. We are excluding the relational world from these clicks!.
Assessment System
When saving values into the database, DeltaMaster differentiates whether the entered figure is affecting a base cell in the cube without any subordinated elements, or an aggregate (e.g. a total of products, customers, etc.).
- If you modify the value of a base cell, this action automatically triggers a change in all the aggregations this value is connected to. If, for instance, you are changing the budgeted revenues for a product, this will be reflected in the product groups and families. This aggregation corresponds to the common functionality of an OLAP database and does not require any special considerations or assumptions.
- If you are editing an aggregated value instead, e.g. the total revenues for the southern region in the second quarter and over all product groups, your desired change does not only have to be passed on “upwards” to the aggregations, but also to all subordinate cells in the cube, and it needs to be spread to them in order to be added up to the entered value again. This process is called Splashing. The distribution will take place proportionally in all dimensions that are not set to a base cell in the current view. Increasing the total figure by 10% will lead to an increase of 10% for all included objects, so that the relation between them is unchanged.
For the end user, these details certainly do not really matter, as DeltaMaster takes care of them all. You might just feel a difference in response times: As a wide part of your cube might be affected by a single change of an aggregated value, the splashing may take some time. For this reason, some of our customers utilize dedicated data input cubes in which they renounce some dimensions or levels. If, for instance, revenues are usually budgeted only for product groups, the data input cube can do without the individual product level.
The Inner Values
The fact that data entered by users usually have to be ”splashed“ to further cube areas has another consequence: Only measures of the types Simple and Filter may be modified. For calculated measures, also including quotients and parts of the flow calculations, data entry is not allowed, as it is not evident to the system how the change is to be reflected in the operands.
Entering New Values
In measure charts, you start the input with a double-click on the corresponding figure. In pivot tables and flexreports, this works in the same way, but additionally you can use the keyboard: With the arrow keys, you move the cursor to the desired cell and type the new value. If you are used to, you may switch to editing mode for the active cell before via the F2 function key, but this is not necessary. Simply enter the new value and confirm your change with the Enter key.
If you type simple numbers with or without sign, you replace the original contents of the field in the cockpit and consequently in the affected cells in the OLAP cube. Readers of our DeltaMaster deltas! already know: Since release 5.1.5, DeltaMaster also accepts percentages and changes of the existing value. From a given number and the calculation specification you provide, DeltaMaster determines the new value and saves it. The following operations are available:
Percentages Values you enter with the percent sign will be interpreted in their decimal representation. An input of “8%“ corresponds to the value 0.08.
Addition/Subtraction With the “+“ and “–“ operators, you specify the value to add to or subtract from the existing figure. The operators have to be provided behind the number in order to be interpreted as an operator (contrary to a sign). Percentages (see above) are allowed, too.
Multiplication The “*“ operator leads to a multiplication of the current figure with the entered value. It may be provided left or right of the number. Percentages are also allowed.
Examples The following table illustrates the functionality of the new data entry formats:
| Current Figure | Input | Result |
| 200.000 | 10+ | 200.010 |
| 200.000 | +10 | 10 |
| 200.000 | 10% | 0,1 |
| 200.000 | 10%+ | 220.000 |
| 200.000 | +10% | 0,1 |
| 200.000 | 1,1* | 220.000 |
| 200.000 | *1,1 | 220.000 |
| 200.000 | *10% | 20.000 |
Data Input in Flexreports
In measure charts and pivot tables, it is unambiguous from which data the displayed values are calculated. In the flexreport, however, there are multiple possibilities how a figure might have come about, and it cannot be seen at first glance from a number whether it results directly from the data cube as a filter, whether it has been entered as a fixed text, or whether it has been calculated with a formula. The content type of a table cell (Content tab in the Cell Properties; key fiends press F4) determines how your inputs will be reflected. A change in the database is only allowed for the Measure and Reference types. For references, the input takes effect as if you had changed the corresponding field in the referenced cockpit. All other types are not, or only indirectly, linked to the database, so that your changes will not affect the cube – they simply overwrite the content of the flexreport cell.
Options
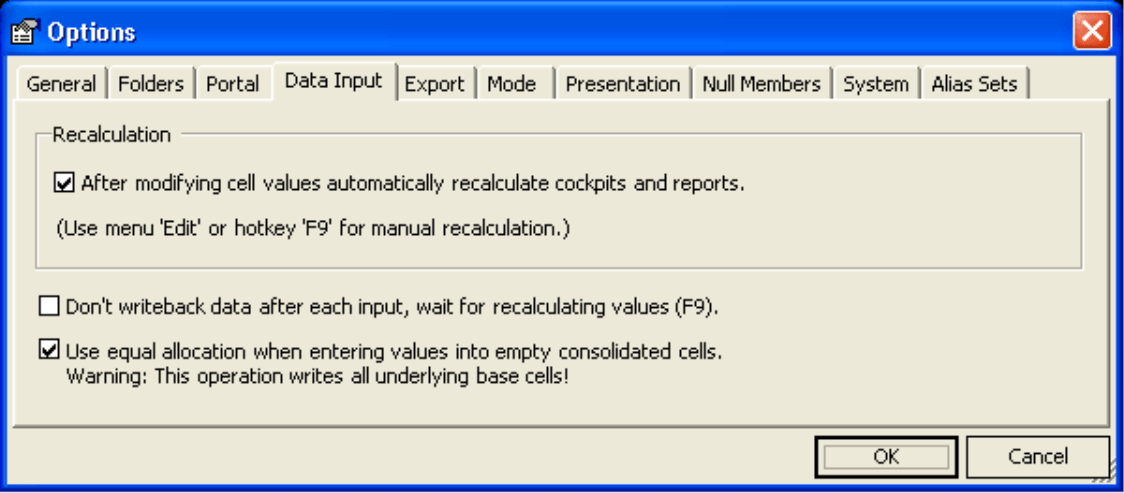
The system acts according to the data input settings on the corresponding tab under Extras/Options.
The first two switches primarily serve to improve performance during data entry. You may switch off the automatic update of cockpits and reports after modifying cell values and trigger the recalculation with the F9 function key or via the Edit menu. The second option has a similar effect: If buffers the write operations against the database and only executes them at the time of recalculation („Lazy Write Back“). You will hardly ever need the option of equal allocation; when it is set, values entered into an empty aggregated cell will be divided in equal portions and written into all subordinate cells.
Large-Scale Manipulations
Related to user data input, the Transfer Data function is available in the Edit menu. With this inconspicuous little dialog, whole areas of an OLAP cube may be copied or moved. You select two views, one for the source and one for the destination of your operation, and the desired measure (unless you check the Transfer all Measures box). DeltaMaster will then transfer the figures from the source to the destination area. If you choose Move Data, the cells of the source area will be deleted, if you pick Copy Data instead, they will remain unchanged. Optionally, the values may be modified during this action if you select and parameterize an operator.
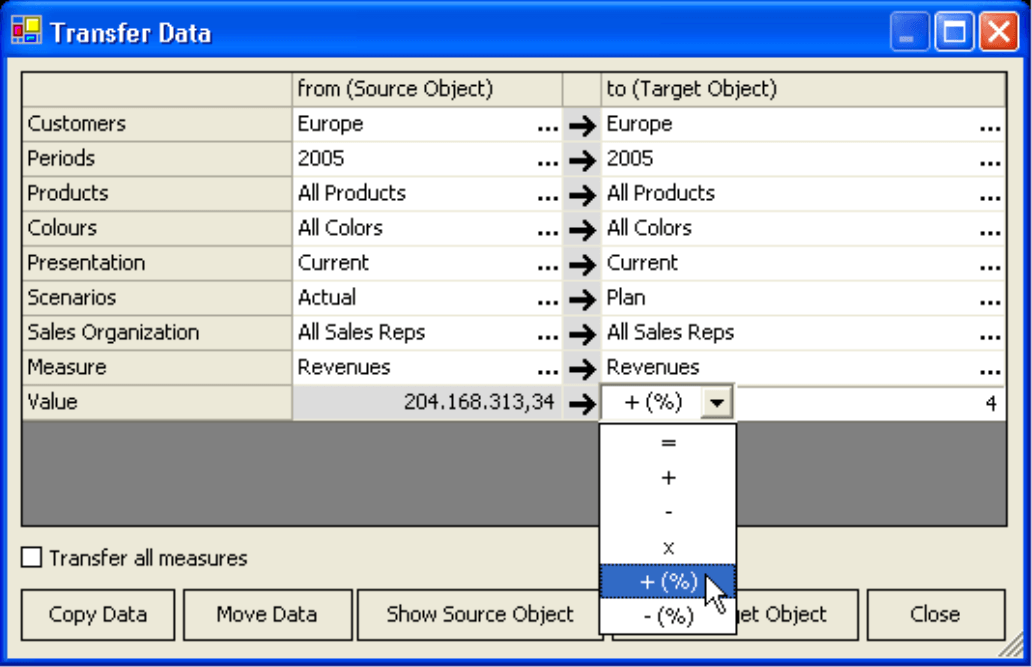
In the image, the actual revenues of the year 2005 will be increased by 4% and set as the budgeted revenues for 2006.
Another quick variation to copy or move entire data areas is implemented via drag & drop: Drag a value in a pivot table or flexreport and drop it in another cell with the Ctrl key pressed, all dependent cube cells will be copied; with the Shift key they will be moved.
