![]()
Greetings, fellow data analysts!
When people emphasize you have to look to the future, they often want to distract from something bad that has recently happened. In those cases, you should look back and analyze what exactly has gone wrong; in conclusion, we especially learn from experience. Dwelling on the past has a negative connotation – unrightfully so, in our opinion. If you want to drive the future, you need to understand the past. On the other hand, taking responsibility means asking yourself today what can happen tomorrow and making previsions accordingly. Using various statistical and business methods, you can gain at least an idea of what the future has in store so you can look beyond what is happening now, extrapolate the past, project into or forecast the future and in that way develop a sense for what will come at last. In this edition of clicks!, we will explain how easy it is to create these types of views in DeltaMaster – some are even ready in standard reports and methods. We still view forecasts and projections with a healthy portion of skepticism. But the more foresight you have, the better off you are!
Best regards,
Your Bissantz & Company team
Everyone knows that the numbers for tomorrow aren’t available today. Yet managers still need suitable methods to detect trends at an early stage and the foresight to steer their businesses ahead. DeltaMaster helps deliver these insights in many different ways, for example, through projections – or forecasts – that it makes for a section of the business during a given month or the course of a year.
Projections in the “Way to go” report
The DeltaMaster standard report “Way to go” is a type of projection that is designed to trigger a response from the reader. It combines the projection with a variance analysis.
This report calculates the cumulated plan-actual variance for the past months of the current fiscal year. A negative variance means the total plan has not been met yet, thus, more work must be done in the remaining months to meet the year-end target. The report “Way to go” calculates how much work by distributing the cumulative variance in equal amounts to the remaining months. The distributed variance plus the original plan values equal the new targets for each month. If the cumulative variance is positive, there is no need to catch up and the target equals the plan.
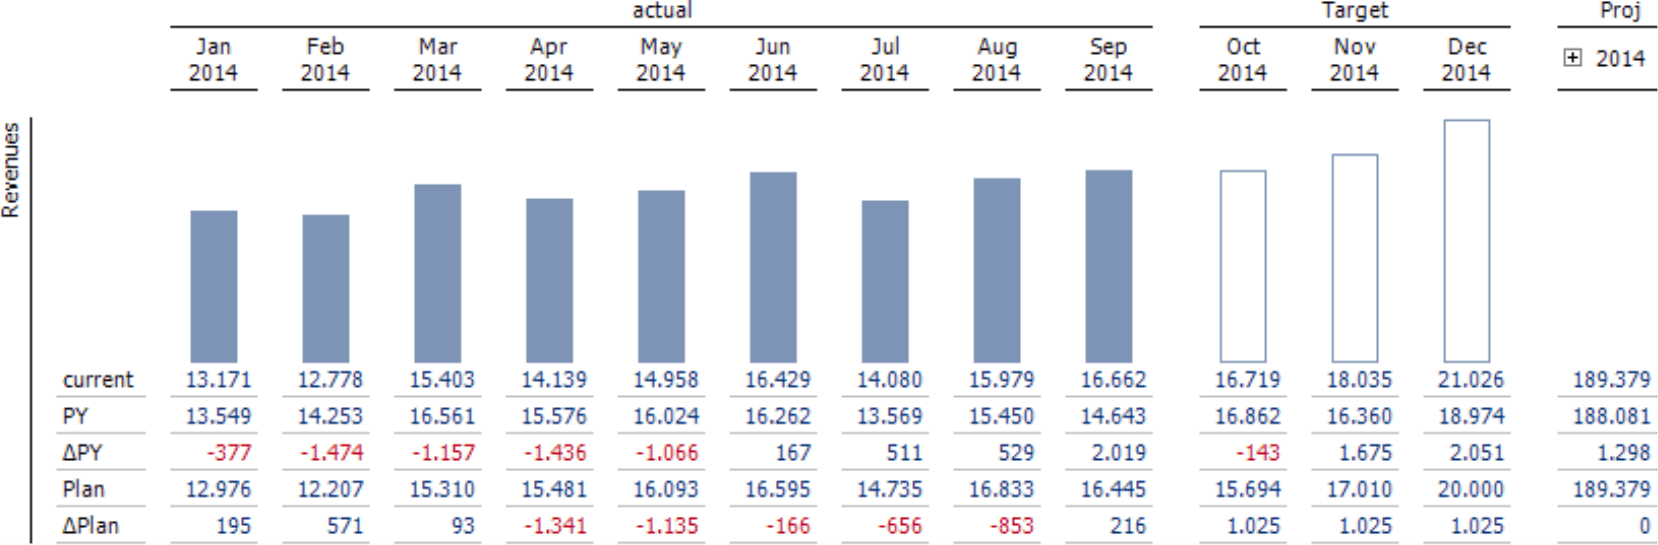
The filled columns in the report represent the actuals of past months including the current one selected in the View. The rows display the following information for each month: current revenues for that month, revenues of the respective month in the previous year (i.e. row “PY”), the variance between the month and that of the previous year (“?PY“), the planned revenues for the respective month, and the variance between actual and plan (“?Plan”).
The columns without a fill color stand for the months to come. The first row lists the target values: the originally planned revenues plus the additional amount calculated. This additional amount, which is listed separately in the row “?Plan”, is the same for all months because DeltaMaster distributes the cumulative variance equally among the remaining months.
The report also lists the end-of-year projection. The value in the first row is the sum of the actual and target values. This sum equals the plan and the variance is 0, which coincides with the logic of this report. This column does not include column graphic because there is no use visualizing a sum in relationship to its twelve summands.
The report is designed to trigger an action because it clearly states the amount (!) that needs to be accomplished. In contrast to a what-if scenario, a way-to-go calculation shows how to achieve a certain target.
This predefined standard report contains sophisticated processing rules that are reflected in substantial MDX statements to query the database. As a user, however, you don’t have to delve into all that. The queries are encapsulated in the calculated member “Target” which, in turn, is automatically defined by the Start Wizard, adapted to the respective data model. The row and column structure is also generated automatically. DeltaMaster even takes care of the adequate presentation of the columns (filled/unfilled) as the Start Wizard creates respective Notation Rules.
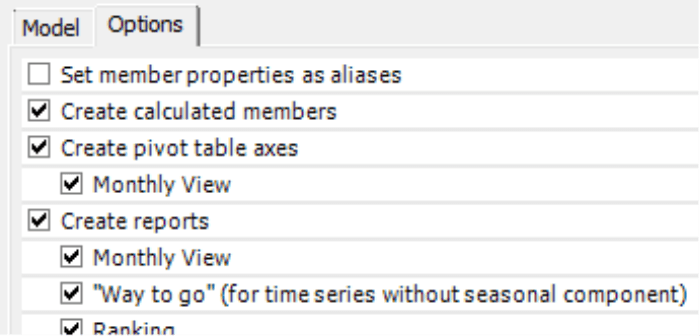
You can access the Start Wizard in Pivotizer, Analyzer, and Miner modes all from the Model menu. In order to use a “Way to go” report, the analysis model must contain a scenario dimension with members for “Plan”/“Budget” and “Actual” as well as utility dimensions for the cumulation and time comparisons (i.e. period view). As noted in the Start Wizard, the “Way to go” report is designed for time series without seasonal components due to the equal distribution of the cumulative variance: If your business regularly experiences a summer slump or strong holiday business, an equal distribution will lead to unrealistic performance targets for the remaining periods. For more information, please read DeltaMaster deltas! 5.5.7, feature #24.
Projections based on the rule of three
A very simple type of projection is to take the average (i.e. arithmetic mean) of the past months and use them for the months in the future. The advantage of this approach is that you do not need any additional information. The disadvantage is that you cannot include any additional information (e.g. from your budget or previous years) even if it is readily available.
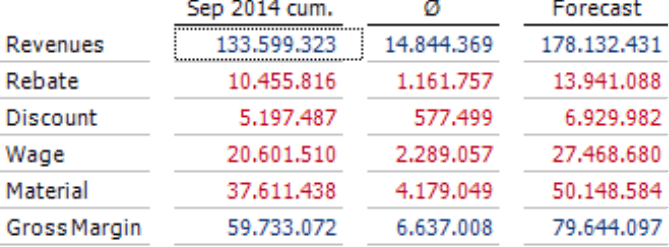
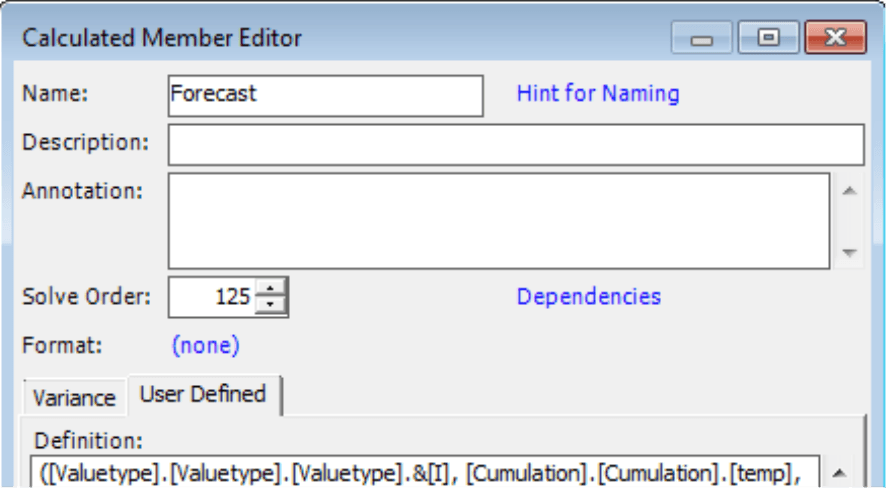
Integrating this type of projection in DeltaMaster is simple: You create a calculated member that takes the cumulated value and the number of past and future periods into account. This task only affects creating a report. Once you have created a calculated member, you can select and use it like a member that was defined in the database. As you can see in the screenshot above, you can also combine the member with different measures. In other words, you only need one calculated member to project revenues, discounts, gross margin, etc. The MDX statement varies depending on the model.
Projections with plan values or values from the previous year
Plan values and, in particular, values from the previous year provide insights on the course of the business. Most people consider them to be more realistic than estimates based on averages. Many different types of calculations are used in modern business. Although these methods all use actuals to calculate periods in the past, they differ in how they create the values for future periods and how they define where the past ends and the future begins. Here are just a few examples:
a) Actuals for past periods and the respective values from the previous year for future periods
b) Actuals for past periods and a weighted value from several previous years (e.g. last year: 50 percent; two years ago: 30 percent; three years ago: 20 percent). This approach attempts to level out unsystematic influences on the projection’s outcome. The weighting, however, is somewhat random itself, which is also reflected in the projections.
c) Actuals for past periods and plan values for future periods.
d) Actuals for past periods and corrected plan values (i.e. using the average plan-actual variance of past periods) for future periods. This approach assumes that the plan is off by a certain percentage, which is carried forward to the coming periods.
In the case of monthly values, you will need to differentiate how you treat the current month. Should you only observe completed months or include the current month, for example, with a projection based on daily values? Once again, you can define the calculations in the form of MDX expressions as calculated members; sometimes, you may even want to move them to the database. Although this may be a bit tricky at times, it is worth your while. Once you have defined these projections as calculated members, you can use them many different ways – for example, to access individual or aggregated values in all kinds of reports, analytic methods, and further calculations.
In the methods that we will explain below, you can only do that to a limited degree. On the other hand, you can easily use these methods without any special configurations.
Preview values in sparklines
Sparklines display measures in a context that shows the current value following a visualization of its development over time. With DeltaMaster, you can even extend that observation beyond the current value to provide a preview of the measure’s suspected future development as further sparklines.
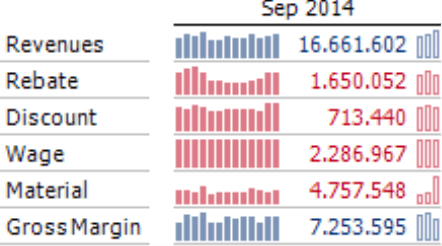
DeltaMaster generates the values of the future periods in two ways: by applying plan or projection values from the analysis model, i.e. similar to method c) in the section above, or calculating them based on a linear regression or exponential smoothing. In the screenshot above, the actuals (i.e. to the left of the number) were supplemented with plan data (i.e. to the right of the number). You can quickly recognize the difference because the columns showing the preview are hollow (i.e. no fill) as defined in the Notation. If you mouse over one of the columns, the preview value will appear as a tooltip. The most important usage scenario for this function is visual pattern matching; a transfer to further analyses and calculations is not supported.
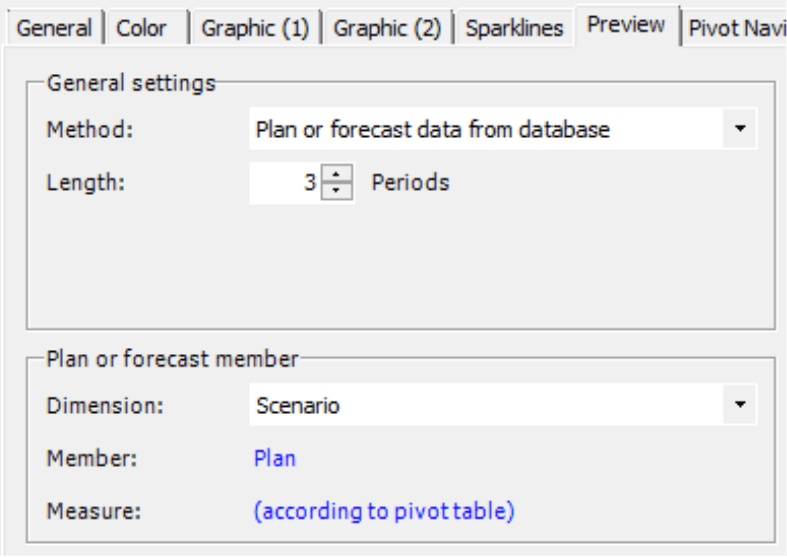
To show Preview values in sparklines, you will first need to activate the respective option in the context menu of pivot tables. Afterwards, you can define which method you wish to use and set its parameters in the Table Properties on the Preview tab. For more information, please read DeltaMaster deltas! 5.5.3, feature #16.
Trumpet curve
Projections are also available in the analytic method Trumpet Curve, a tried-and-tested instrument for early warning. The standard view displays the cumulative plan-actual variance of a measure (e.g. revenues) in a tolerance corridor that grows smaller over time.
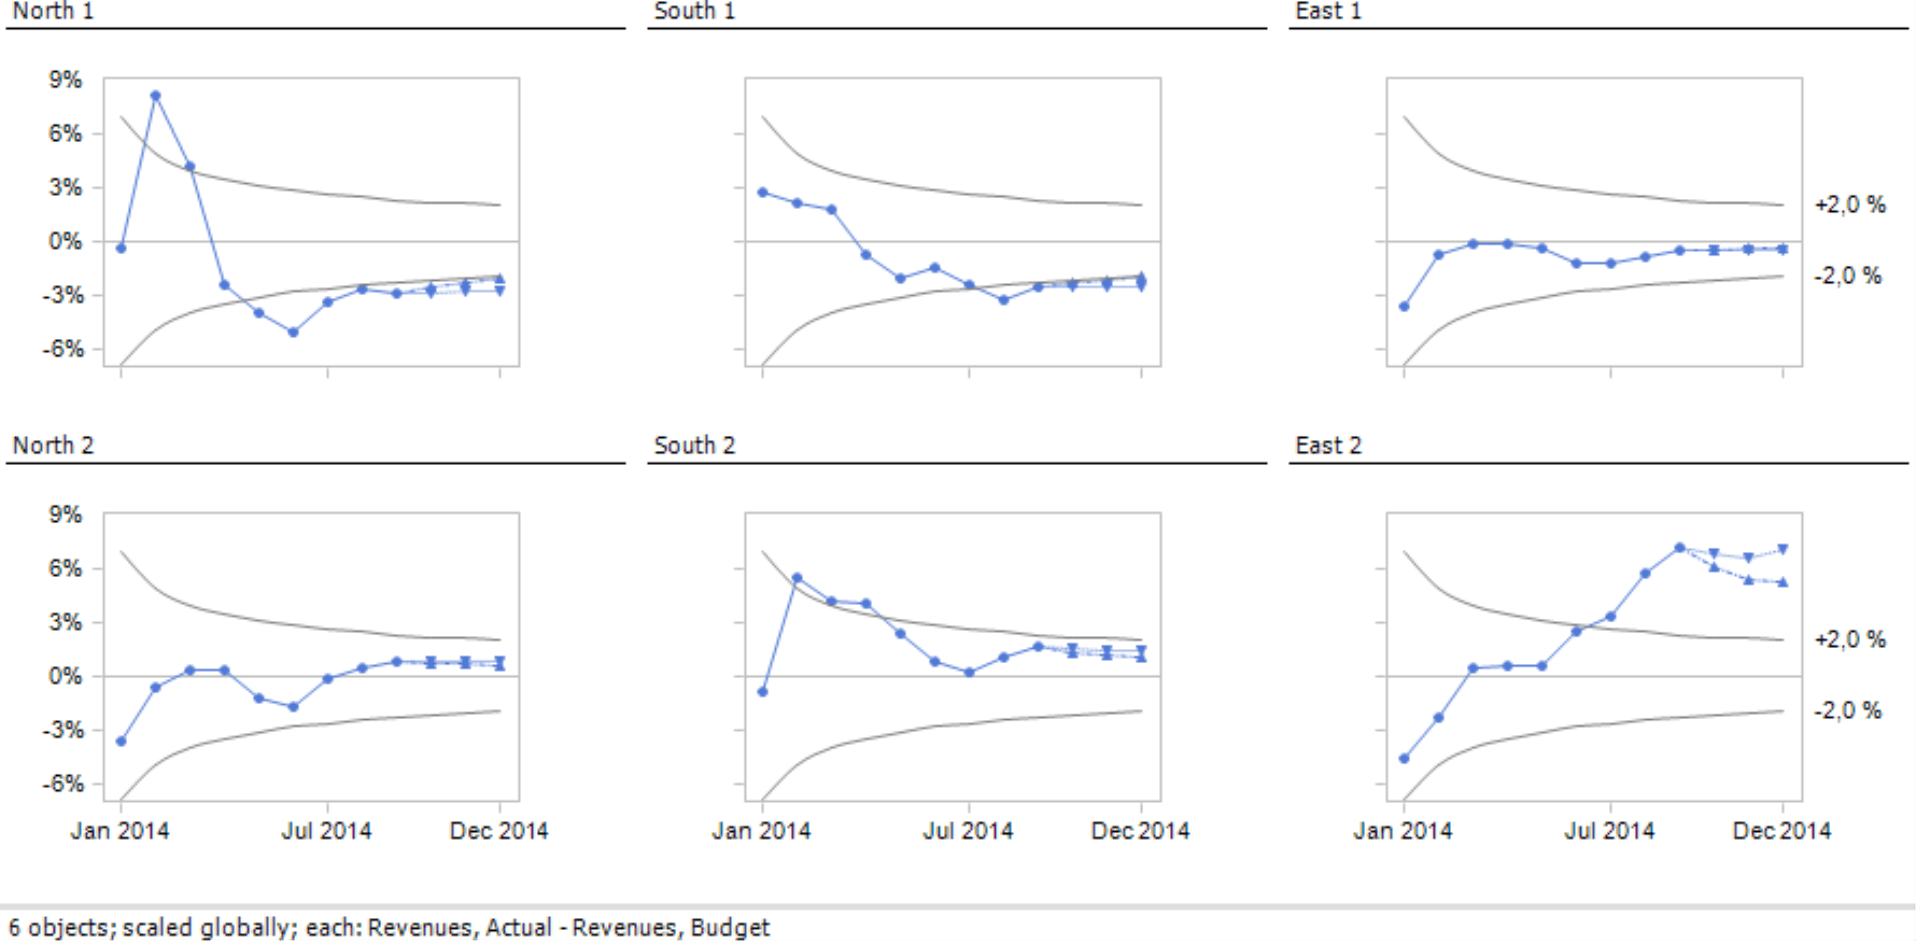
This method allots the measure a certain margin of fluctuation (e.g. plus/minus 2 percent) that is accrued over the course of the fiscal year. At the beginning of the fiscal year, you can cope with larger variances more easily because there is still enough time to fix them. As time passes, however, you need to move closer to your targets if you want to achieve them. This dwindling leeway is visualized as a trumpet-like curve, which gives this method its name.
To start the analysis, select the corresponding plan and actual measures, for example, by dragging the values from the pivot table and dropping them into the selection fields. DeltaMaster takes care of the rest automatically. Since it even calculates and adds up the cumulative variance, you do not need to define the variance and cumulation as calculated members in advance.
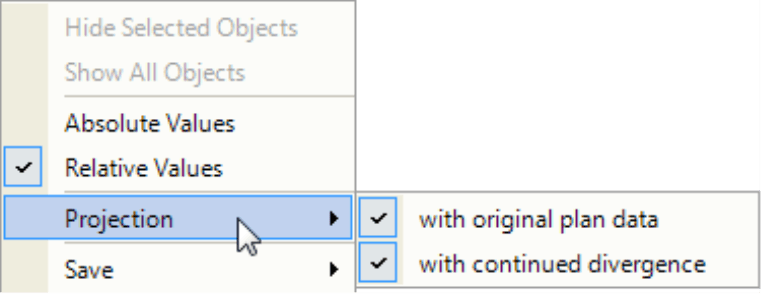
Initially, the visualization only shows the development of the variance. If you want to add a projection, you must activate it in the context menu. DeltaMaster will then calculate the possible further development based on two different assumptions:
- In a Projection with original plan data, you assume that the planned targets will be attained for all remaining months of the period being observed. In other words, the remaining months will end with a variance of 0 as described in method c) above.
- In a Projection with continued divergence, DeltaMaster will calculate the average absolute variance of the past periods and add it to the plan data of the remaining months.
In the screenshot above, we have combined several trumpet curves that show projections into a Small Multiples report. For more information on the Trumpet Curve, please read DeltaMaster clicks! 05/2007.
Questions? Comments?
Just contact your Bissantz team for more information.
