![]()
Greetings, fellow data analysts!
Entrepreneurs and managers have hoped to gain competitive advantages from sophisticated analytic technologies long before Big Data started making headlines in daily newspapers. Our experience from countless analysis projects, however, shows that all-knowing algorithms don’t necessarily reveal the best tips on what work is yet to be done. Oftentimes, the most valuable insights come from well-thought-out KPIs that are analyzed with robust methods. The secret here is asking the right questions and figuring out how to translate them into numbers. Software, in turn, should be intuitive enough so that users can easily define, analyze, and present these metrics. This edition of clicks! will show how you can easily translate questions into analytic applications without getting bogged down with statistics or technology. We will use an early warning system as an example.
Best regards,
Your Bissantz & Company team
Different departments and industries often have one and the same requirement: an early-warning system that notifies users before things get out of hand. Some address this need with forecasts, which were the focus of DeltaMaster clicks! 12/2014. Recognizing relevant changes at an early stage is almost as important – and we will explain how in the sections below.
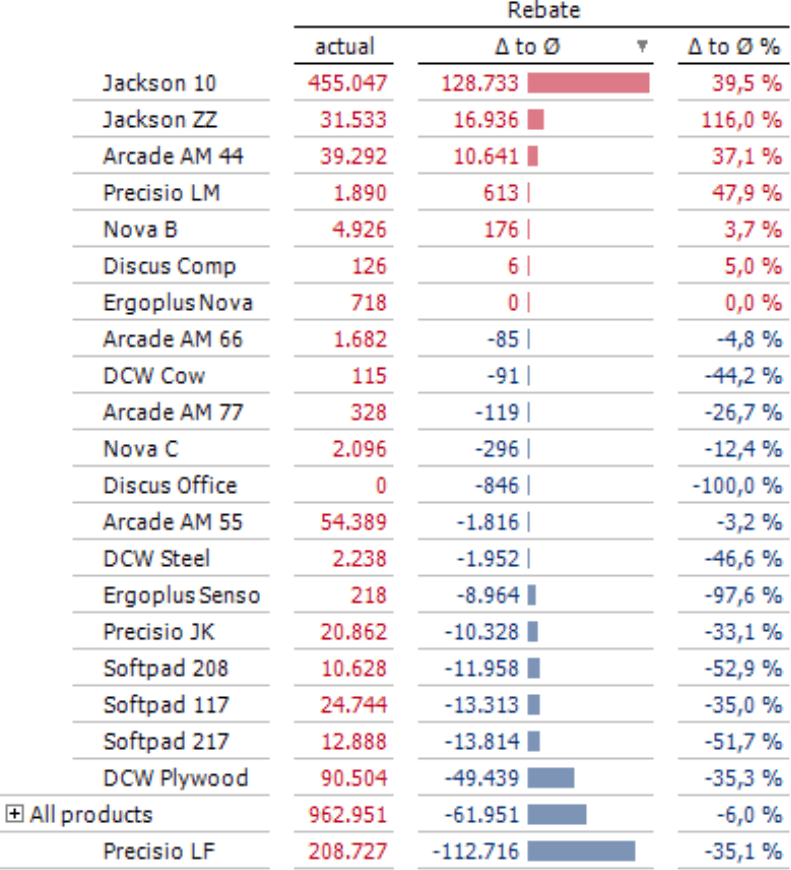
The screenshot on your right shows a report that we created for this purpose based on the data from our “Chair” reference application. It shows total rebates by products and the rate of current rebates to the average over the past few months (i.e. delta to average; ? to Ø).
This warning signal is easy to recognize: Discounts for “Jackson 10” have risen sharply in the report month. You can also see that discounts have dropped significantly for “Precisio LF” and “DCW Plywood”. You can also identify compensating effects, which are also important information.
So how can you create this type of early warning system in DeltaMaster? First, you have to answer some business aspects:
- What things can get of hand? In other words, which measures are suitable indicators that should be monitored closely?
These include “undesirable” KPIs – such as discounts (in sales), dead mileage (in logistics), cancellations (in publishing houses and service providers), or returns (mail-order companies). These measures must be available – or at least definable – in the underlying database. In most cases, they are already available in DeltaMaster applications, for example, as part of a KPI overview.
- How will you recognize when things are getting out of hand? What are you going to use as a comparison? How will you evaluate the results?
One robust method monitors the measure’s development over time and compares the current value of a measure with previous ones. Here, it makes sense to compare not just a single previous value, but rather the average of several periods (e.g. the past three months) to smooth the development and put the latest results into perspective. This is called a moving average, rolling average, or running average.
As the requirement for the system in our example, we want to observe how discounts develop in comparison to the rolling average of the past three months.
Time analysis member for the three-month average
The following section will briefly explain how to create time analysis members in DeltaMaster. For detailed instructions, please read DeltaMaster clicks! 07/2011.
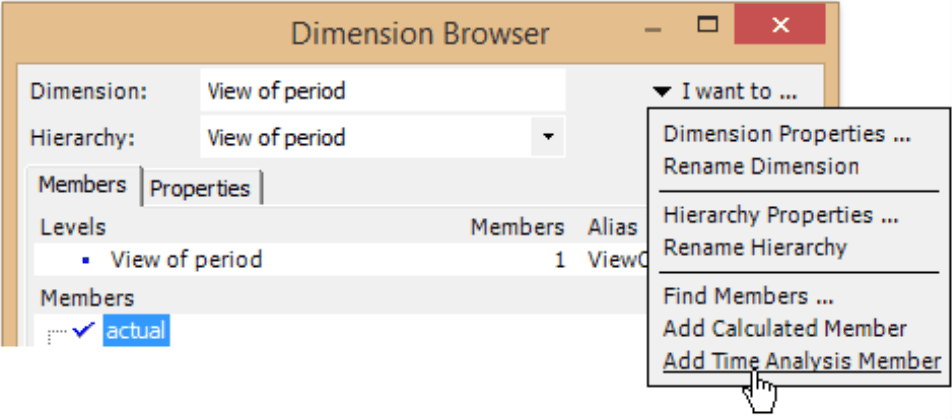
You add a new Time Analysis Member in the dimension “View of period”, also known as “Time Utility” (Pivotizer, Analyzer, or Miner mode).
As Calculation Type this member is a Query, which is defined as a moving aggregation. Three parameters have to be set: first, the desired Level of the time hierarchy (e.g. “Month”); second, the number of members that you want to include (Lag); third the mathematical Function (e.g. sum, minimum, maximum, or average) that you wish to calculate.
The previous period is selected as the Reference Member. This is another frequently used time analysis member that queries and returns the respective previous period. When you select the previous period as a reference member, DeltaMaster will not include the “current” period (i.e. the one selected in the View window) in calculating the average. If you select July as the current month, June will be the previous period. DeltaMaster will then use this reference member to calculate the rolling three-month average based on the months April, May, and June.
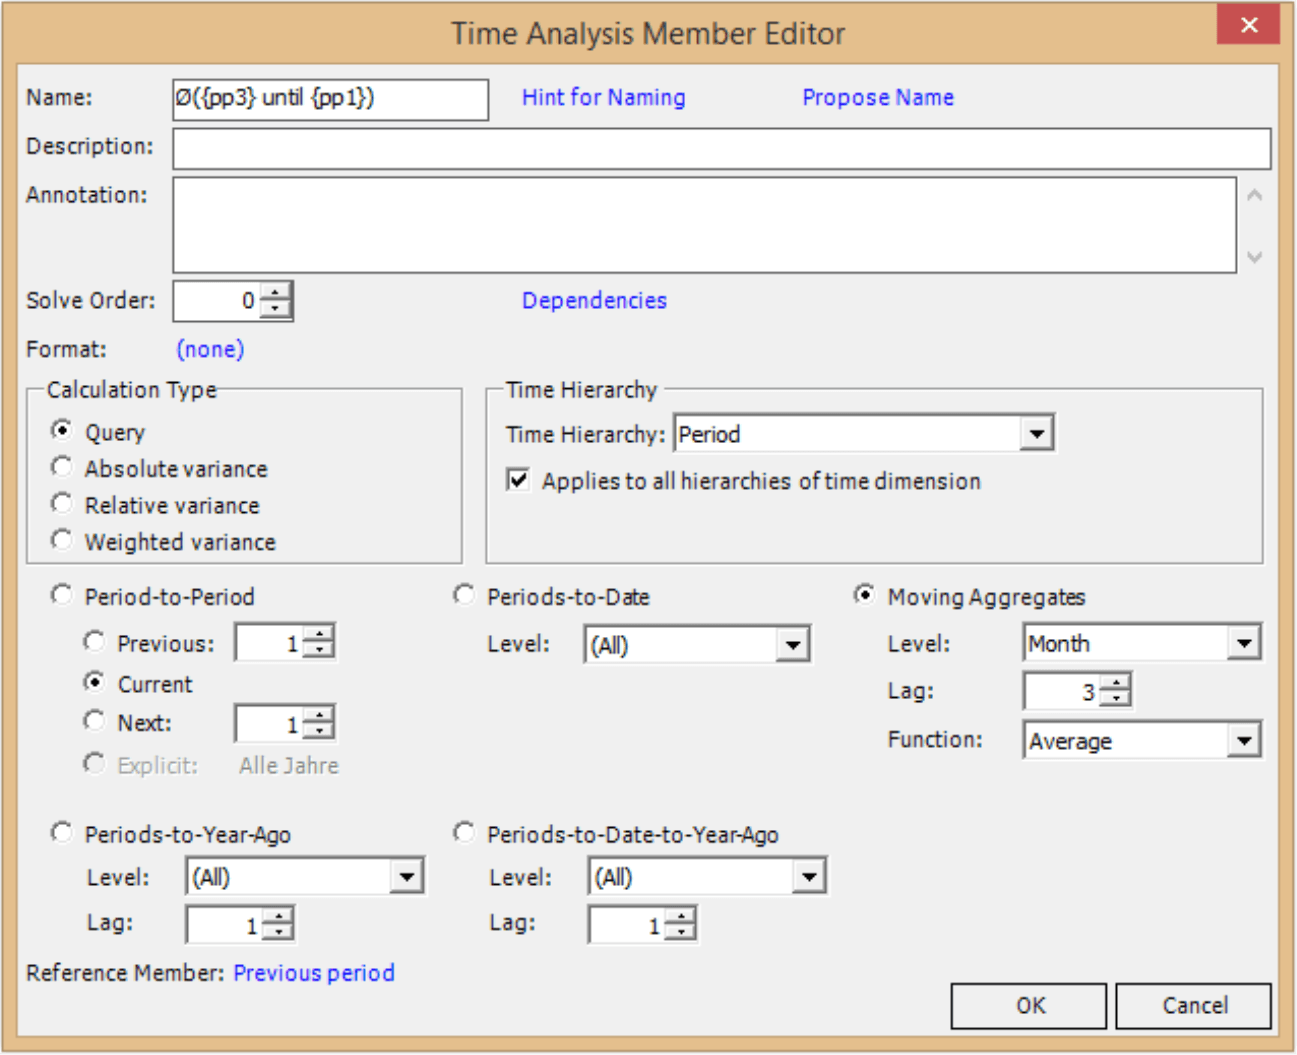
If you let DeltaMaster propose a name for the time analysis member, please note that these suggested names will contain variables such as “{cp}” or “{pp1}”. DeltaMaster will replace these variables with the concrete period names (e.g. the name of the current period for “{cp}”; the name of the previous period with a lag of 1 for “{pp1}”). DeltaMaster will not include the shift caused by the reference member in the suggested name. If you choose the previous period as the reference member, therefore, you should change the name accordingly.
Time analysis member for variances to the average
The average member can be used immediately for further analysis. Our example, however, goes one step further to calculate the variance to the average. We will review this step briefly below. For detailed instructions, please read DeltaMaster clicks! 07/2011.
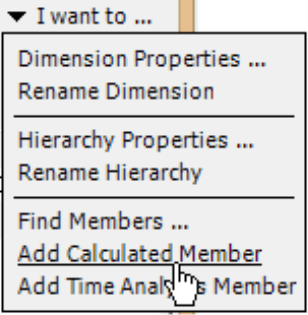
Using the Dimension Browser, we add an additional calculated member. This time, however, it is a “regular” one and not a time analysis member.
This member, “Delta to Average” calculates the variance between the actual value and the average that was previously created. You can use the average to show the absolute or relative (percentage) variance. In most cases, however, you will want to examine the absolute variances because they reveal the most important drivers (e.g. clients, products, materials). The relative variances are used more for grading and assessment.
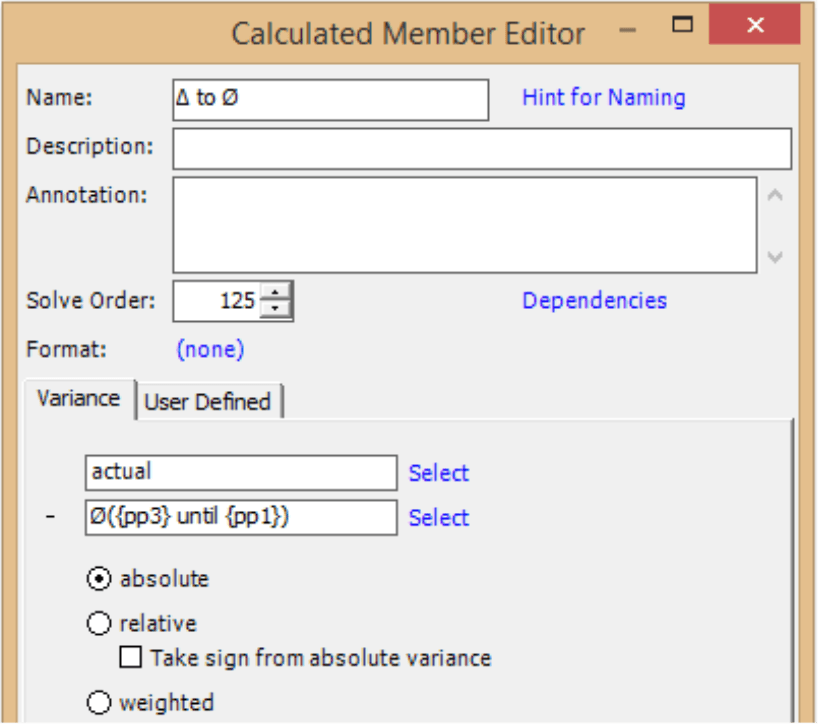
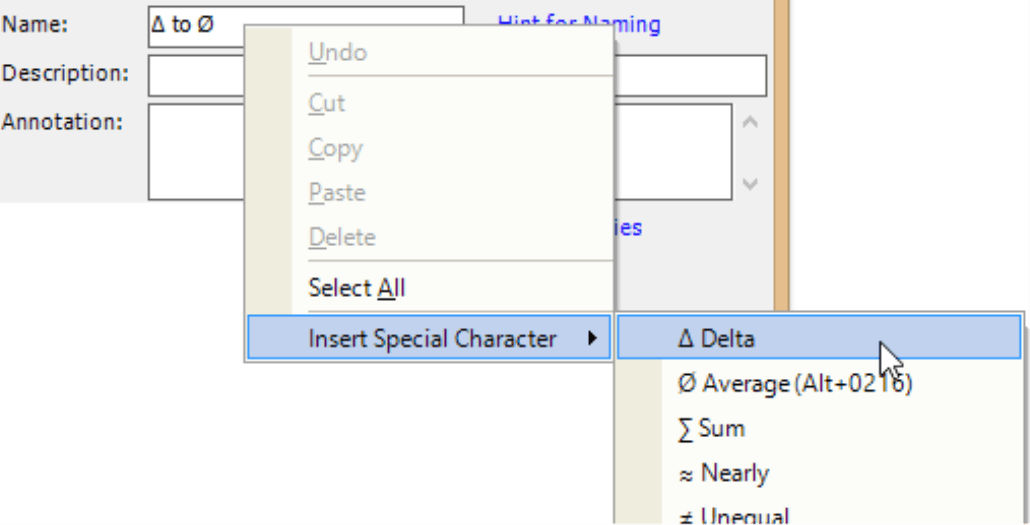
You can insert Special Characters for delta and average using an option in the context menu. This option is available in all entry fields for names, descriptions, annotations, etc. – even in other dialog boxes as well.
Calculated members add flexibility
Ultimately, the calculated members provide two new attributes which you can flexibly use again and again in analyses and reports. In particular, you can easily combine them with other dimensions, levels, and measures.
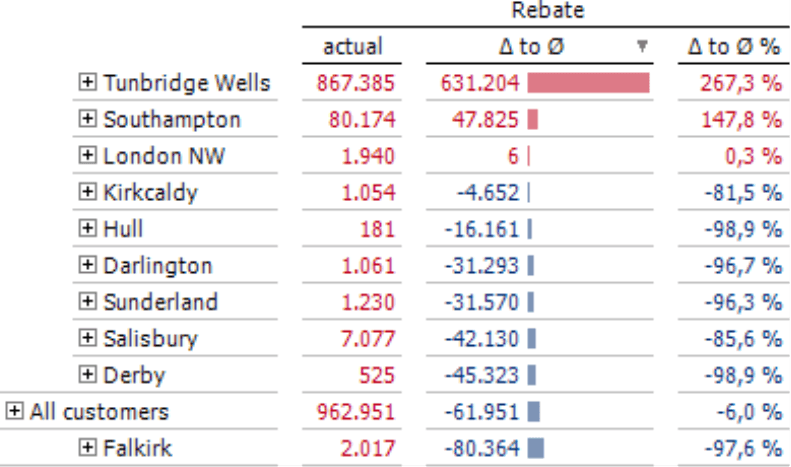
The rows in the report on your right, for example, display the regions from the customer dimension instead of the product groups from the product dimension. The columns contain the same members as in the previous example and fulfill the same purpose: They quickly show when objects diverge from their previous behavior. You can even stretch this evaluation across multiple levels of the hierarchy. This example includes the aggregated member “All customers” and sorts it so you can view the individual objects as part of the big picture. (This list is filtered so that small amounts do not appear; this is why there is a small variance to the sum.)
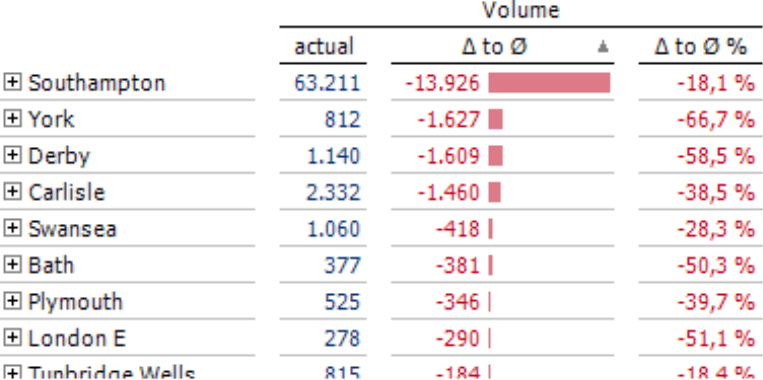
You can also use calculated members flexibly with all measures. If you used volume in place of rebates in our example, you would get a report similar to the screenshot on your right. This report, which shows another period as in the previous examples and was filtered to hide small values, reveals a precarious drop in sales volume.
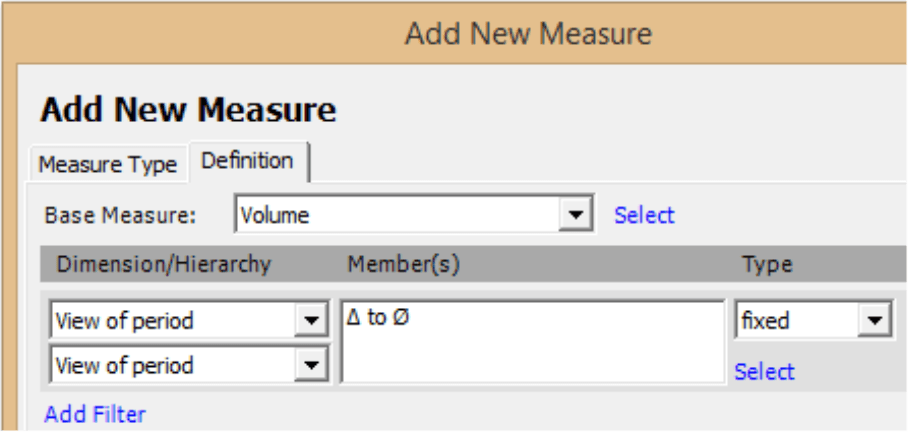
You can also use calculated members to define additional measures, for example, in filter values. You can create them in the Measure Browser (Model menu) and examine them using various analytic methods in DeltaMaster. For more information on working with filter values (e.g. the effects of filter types), please read DeltaMaster clicks! 03/2008.
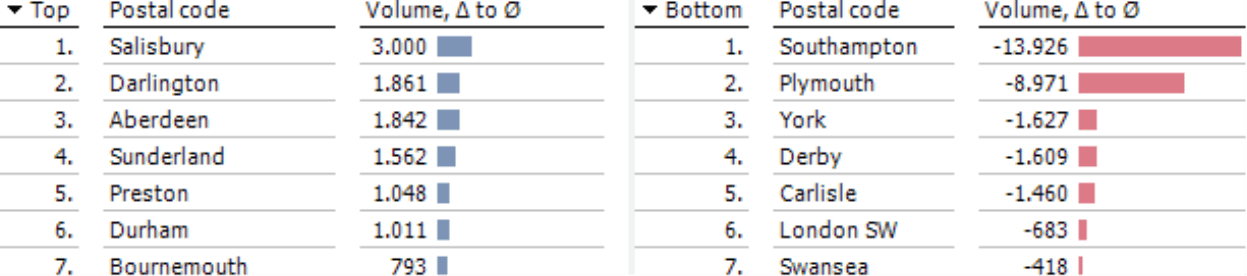
In the screenshot on your right, we have applied the Ranking method to the sales volume analysis presented above as a pivot table. The advantage of this method is that you can group the individual positions next to each other based on their algebraic sign – with the good ones on the left and the bad ones on the right. For more tips how you can compare positive and negative values in the same report, please read DeltaMaster clicks! 02/2015.
Using the analytic method Small Multiples, you can even combine multiple analyses for various dimensions or measures into a report (for more information and further hints, please read DeltaMaster clicks! 12/2012). The time level of the time analysis members, however, remains constant. If you want to observe a three-day average in addition to the three-month average, you will need to create a further time analysis member for the “days” level.
Push or pull?
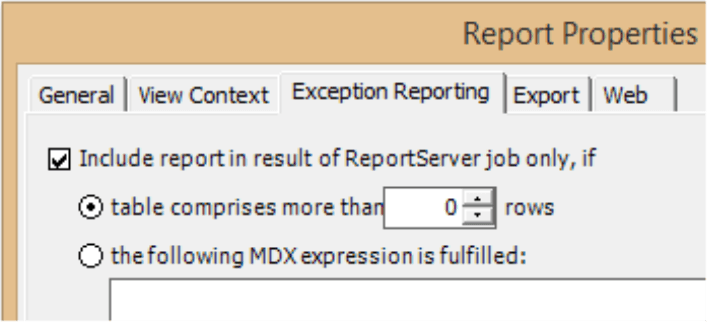
When it comes to early warning systems, many users want to receive automated notifications. As soon as a certain threshold has been met, DeltaMaster should then send an e-mail to warn certain people.
With DeltaMaster ReportServer, you can easily configure these types of automated exception reports. DeltaMaster clicks! 11/2008 explains how that works. It also provides a few good reasons why you may want to avoid using thresholds and send regular, concise reports instead.
Our blog posting “The fundamentals of management information” (www.bissantz.de/bissantz-ponders/management-information-2) summarizes these reasons:
We, too, cannot warm up to the concept of fixed thresholds that trigger alerts. How would you even implement that? How much work does that entail in complex corporate environments? How general or specific should these thresholds be – on country, regional divisional, product, industry, and/or customer levels? Should they be relative or absolute values? Sometimes, people turn to traffic light charts. Yet, because these signals are cautious in both directions, most things are displayed in yellow. You can set thresholds in DeltaMaster for the rare cases where contractual, qualitative, or technical limits provide clarity. We, however, are big fans of sorting everything in descending order based on the value that is important to the company. That allows you to view everything at a glance – without needing thresholds.
Adept readers like to read good reports with well-though-out content and an attractive design – and not just when exceptions occur! There is so much they can identify at a glance – provided that it contains the right information. Ideas and tips for implementation: see above.
