Greetings, fellow data analysts!
How many times do you check and answer your e-mail every day? Many people respond every few minutes – always when a new message appears, usually when they have been away from their desks for a while, sometimes right after breakfast, and even at night from their smartphones. In fact, people monitor their e-mail more intensively than probably any other information channel. Subject lines in particular receive a great deal of attention. Yet some subject lines only say that someone has responded – not what the answer is. Oftentimes, you can’t even tell if a message was written personally or automatically generated. That’s a shame!
In applied Business Intelligence, the e-mail inbox has so much potential. We can use the subject line to highlight select KPIs or other interesting things that are contained in the attached reports. Many times, this gives the recipients enough information so that they don’t even have to open the message. That means that they can see that an e-mail has arrived and understand how something is performing all in one step. The human brain is grateful for these types of shortcuts. DeltaMaster ReportServer can even take values from reports and place them in the subject line automatically. We think that your report consumers will be grateful for that, too.
Best regards,
Your Bissantz & Company team
When people receive e-mail, the subject lines are the first thing that they notice. The subject line provides an ideal place to present coveted information. The right wording, however, is essential. Subjects such as “Monthly Report, May 2013”, “POS Sales”, or “Your DeltaMaster Analyses” are only descriptions of information – and not information themselves. Although the recipients may understand what the mail is about, know how they should categorize the message, and even get a bit curious as to the content, they can only receive the actual information when they open the message and, respectively, the attachments.
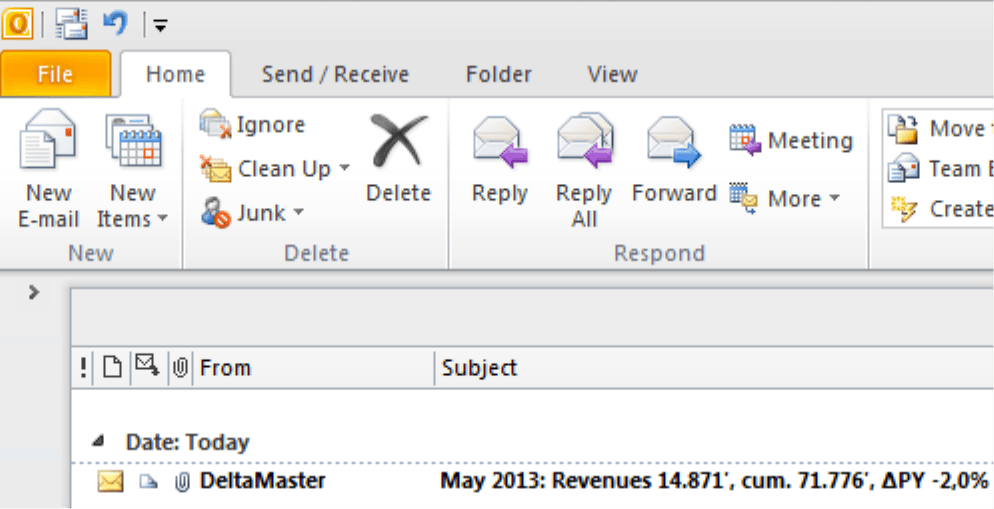
A better alternative is to use subject lines that already contain the main measures. The screenshot on your right illustrates how you can comfortably fit revenues, cumulated revenues, and variance to the previous year in the subject line. This e-mail, therefore, has delivered the central message before it is even opened.
You can even easily understand this information in the desktop notifications of Microsoft Outlook. In other words, you don’t even need to open your inbox.
This method of sharing information is very useful for reports that are published frequently or at set times, for example, on a daily or weekly basis. The subject lines containing values communicate the central message so quickly that the recipient may not even need to read the e-mail. The subject line has already summed it up. Once again, DeltaMaster’s “see-and-go” approach has proven its worth. The software shows the data first and then the user decides which step to take next – not vice versa where the user has to do something first and then see what happens.
Creating and sending reports with ReportServer
You can automatically send these e-mails with DeltaMaster ReportServer. ReportServer also takes on the tasks of updating the reports and using a template (Report Source) to generate briefing books with the same structure but different content. Using a single analysis session as a template, for example, you can generate a standardized briefing book that provides each outside sales representative with the results for his or her particular region. You can also choose from a variety of formats such as a DeltaMaster analysis session, PDF or Office files, or simply an HTML e-mail for embedded images. You can define these jobs in ReportServer which, in turn, can process them fully automatically at a scheduled time, at the click of a mouse, etc.
One of the optional settings in the Job definition is the E-Mail Subject. If you include variables in the text, ReportServer will automatically take components from the reports in that job and place them in the subject line.
The variable “@Report”
The variable to access values, names, and similar components within a report is:
@Report<Report ID>!R<Row>C<Column>
You can use this variable as often as you wish and even combine it with other ReportServer variables and static text. Variables are also supported in the E-Mail Text and E-Mail Attachment. In most cases, however, it is only used in the subject line.
The variable has the following parameters:
-
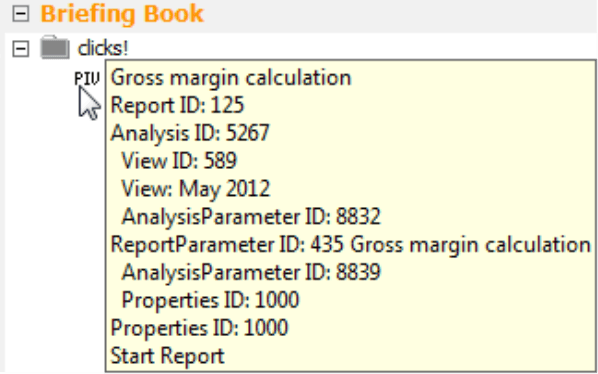
- Enter the ID of the report from which the value should be taken in front of the exclamation point. This Report ID is shown in the Report Properties (context menu of reports in the Briefing Book). You can also view the Report ID as a tooltip if you hold the Alt key while mousing over a report.
- After the exclamation point, enter the desired cell of the report in “RC notation”, in other words, the letter “R” followed by the number of the row and then the letter “C” followed by the number of the column. You may already know this notation from the formulas in a Flexreport. The row and column numbers begin with 1. So the cell in the upper-left corner is “R1C1”.
One simple way to view the row and column numbers is to display the Cell Coordinates (context menu or I want to… menu). DeltaMaster will then display the row and column numbers in orange on the edge of the pivot table. In the screenshot above, for example, the cell showing non-cumulated revenues has the coordinates “R4C2”. Row 1 is not displayed in this case because the hierarchy names are hidden (Table Properties, General tab).
The “@Report” variable is only available for pivot tables. It can refer to data values, member names, measure names, member properties, and member property values. “@Report” cannot reference row and column aggregations that have been displayed using the context menu.
The reports that are referenced using the variable “@Report” should be contained in the respective job so that ReportServer can recalculate the values. This is where the Report Folder comes into play. ReportServer will recalculate the reports in all of the folders that are selected in this option. If no folder is selected, all folders will be included. If the respective check box is activated, the subfolders will be covered as well.
When ReportServer runs the job, it will replace the variable with the content from the specified cell. This is how current information from select reports can be placed in the subject line.
Creating more complex subject lines
With these references to the variable “@Report”, you can create the subject line that we used in the screenshot on the top of page 2. This is:
@Report125!R2C2: Revenues @Report125!R4C2′, cum. @Report125!R4C3′, ?PY @Report125!R4C7
If you look at the pivot table on the previous page, you can see how the variables translate:
- @Report125!R2C2: Row 2, Column 2 contains the current period “May 2013”.
- @Report125!R4C2: Row 4, Column 2 contains the revenues “14,871”.
- @Report125!R4C3: Row 4, Column 3 contains the cumulated revenues “71,776”.
- @Report125!R4C7: Row 4, Column 7 contains the relative variance to the previous year “2.0 percent”.
To keep our example simple, we entered a few static words (“Revenues:”, “cum.”, “?PY”) into the subject line. You could, however, also use the “@Report” variable to dynamically read out these terms from the report.
All of the values from our example stem from the same report. You could, however, create subject lines from several different reports.
Questions? Comments?
Just contact your Bissantz team for more information.


