![]()
Greetings, fellow data analysts!
The vast, built-in library of analysis methods is one of the strengths of DeltaMaster. Although the special algorithms, heuristics, and report formats in Miner mode usually stand out the most, the software offers many other functions that deliver new insights within tabular reports as well. One example is the cluster analysis, which searches for similar structures in the report data and highlights what deserves attention. This function is so subtle and simple to use that we nearly asked ourselves if it could even fill an entire issue of DeltaMaster clicks! – but exactly this subtlety should get the full attention it deserves.
Best regards,
Your Bissantz & Company team
DeltaMaster offers a variety of fast analyses to help you examine pivot tables and cross tables more closely. Like a good personal assistant, these methods scrutinize the table and automatically highlight interesting findings. One example is the cluster analysis, which identifies similar objects and arranges them into groups. This analysis is useful for profiling customers, identifying market segmentations, or simply searching the objects within a table for similarities.
A cluster should group objects that are as similar as possible – and as different as possible from the objects in the other groups. Clusters, therefore, should be very homogenous so that the objects within it are easy to characterize. Different clusters, however, should be very heterogeneous so that it is easier to take clear-cut actions.
Performing a cluster analysis in pivot tables and cross tables is very simple in DeltaMaster. It requires no parameters or prior knowledge – and the results speak for themselves.
Starting an analysis
The cluster analysis is available in both pivot tables and Cross Table Analysis. Pivotizer, Analyzer, or Miner mode is required for pivot tables; Analyzer or Miner mode for Cross Table Analysis. Although the analysis works the same way in both modules, the Threaded Analysis Technology is only offered in combination with the Cross Table Analysis.
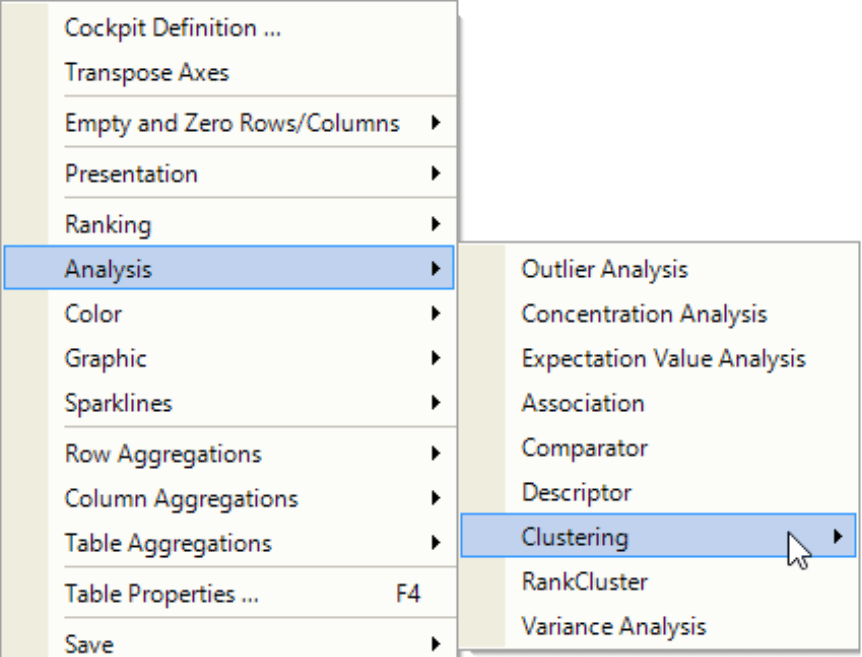
You can access Clustering along with the other fast analyses in the context menu of the table under the section Analysis.
From the submenu, you can now select which objects (i.e. rows or columns) DeltaMaster should group and how (i.e. by the share of the row/column sums or absolute values).
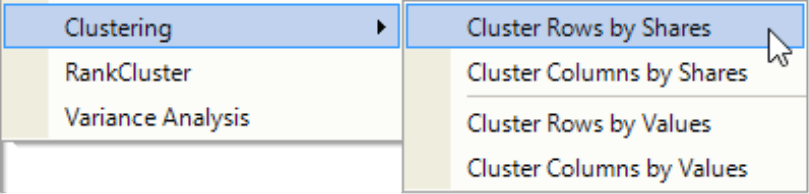
That’s all! DeltaMaster will instantly start the calculation and attempt to group rows or columns where the values or shares are similarly distributed among the members of the other axis.
Agglomerations
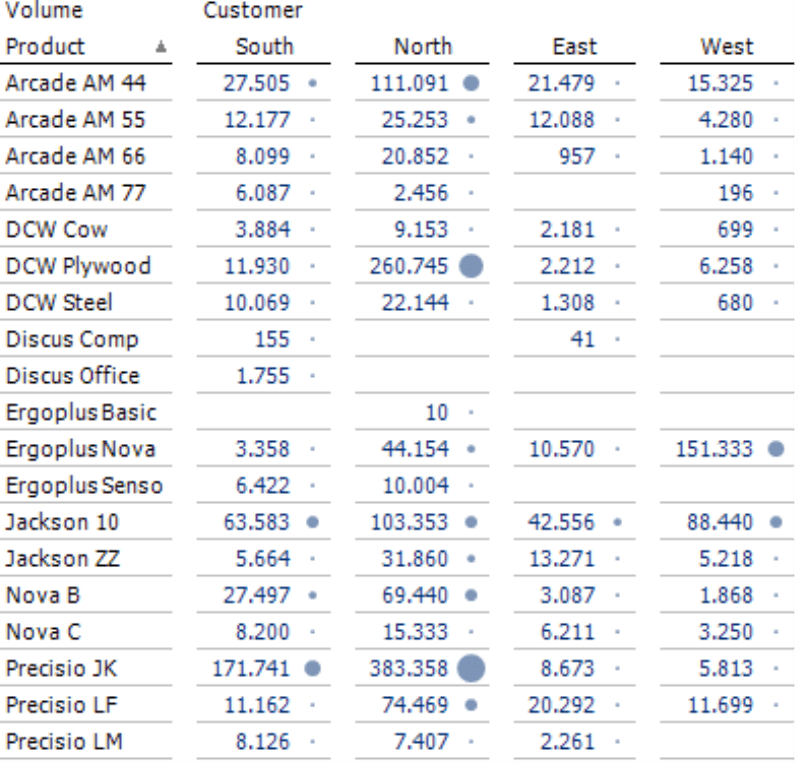
The example on your right from our “Chair” reference application shows a comparison of product and customer dimensions – a typical starting point for a cluster analysis. To emphasize the relationships among these values, we have activated circles (context menu, Graphic section, with a global scale which you can set in the Table Properties on the Graphic (1) tab). This visualization may be a bit surprising at first: In most reports, we use bars or columns because it is easier to estimate lengths or heights than areas. Circles, however, have the advantage that you can compare them in two directions (i.e. vertically and horizontally), and a comparison by rows and columns is just what we need here. Since products and regions are attributes of equal footing, you can use circles to signalize relevant combinations (see our posting on “Criss-crossing circles” at https://www.bissantz.de/bissantz-ponders/criss-crossing-circles). Yet even though these types of charts are suitable, you still cannot identify similar demand patterns just by looking at them.
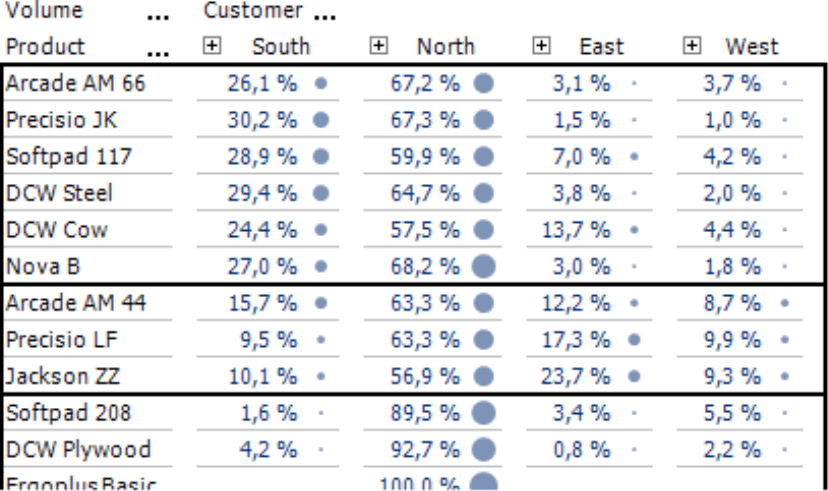
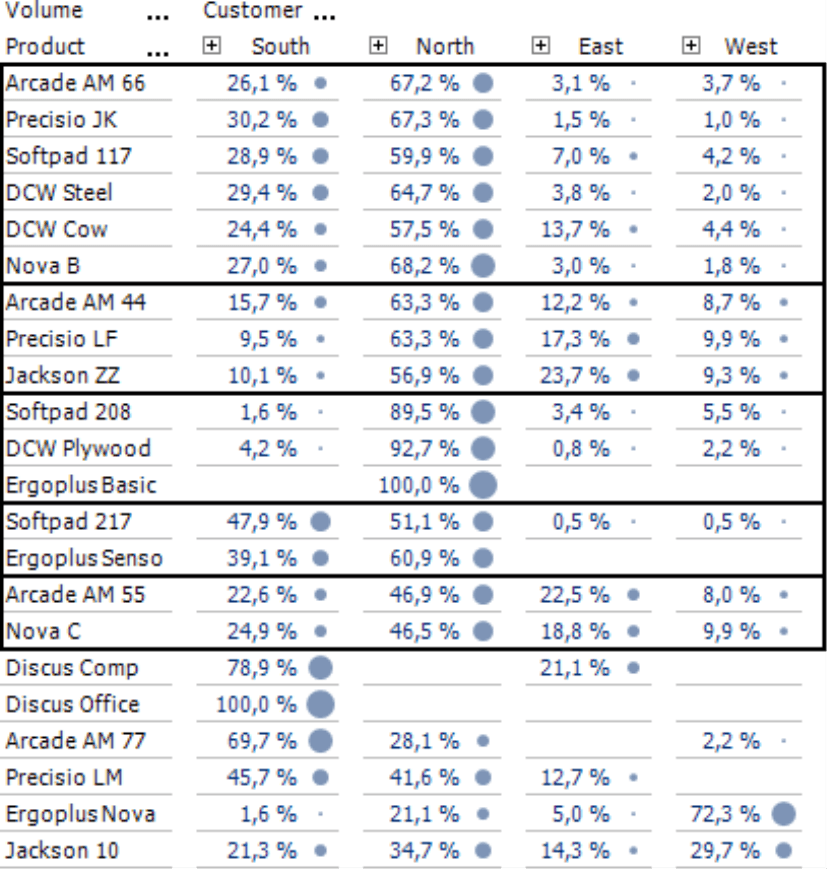
Cluster analysis will change that in an instant. If you now group the rows by shares, DeltaMaster will automatically switch the tabular view to display the shares of the row sum instead of the absolute values. The cluster analysis rearranges the rows and groups similar members together, ignoring any sort orders of the axis. DeltaMaster designates the cluster with a black frame. In this case, five clusters has been found and the optical impression confirms the statistical findings.
- The first cluster contains products with high sales volumes in the North, average volumes in the South, and low volumes in the East and West – each based on the total volumes with this product (i.e. row sum).
- The second cluster shows products with high volumes in the North and similarly low volumes in all other regions.
- The third cluster includes products that only sell well in the North.
- The fourth cluster comprises products that primarily sell in the North but with a good portion in the South as well. The other regions are irrelevant.
- The fifth cluster covers products that generate a considerable portion of their sales volumes in the East and West.
Entries that do not match any of these patterns or each other are presented at the bottom of the table, separately from the clusters.
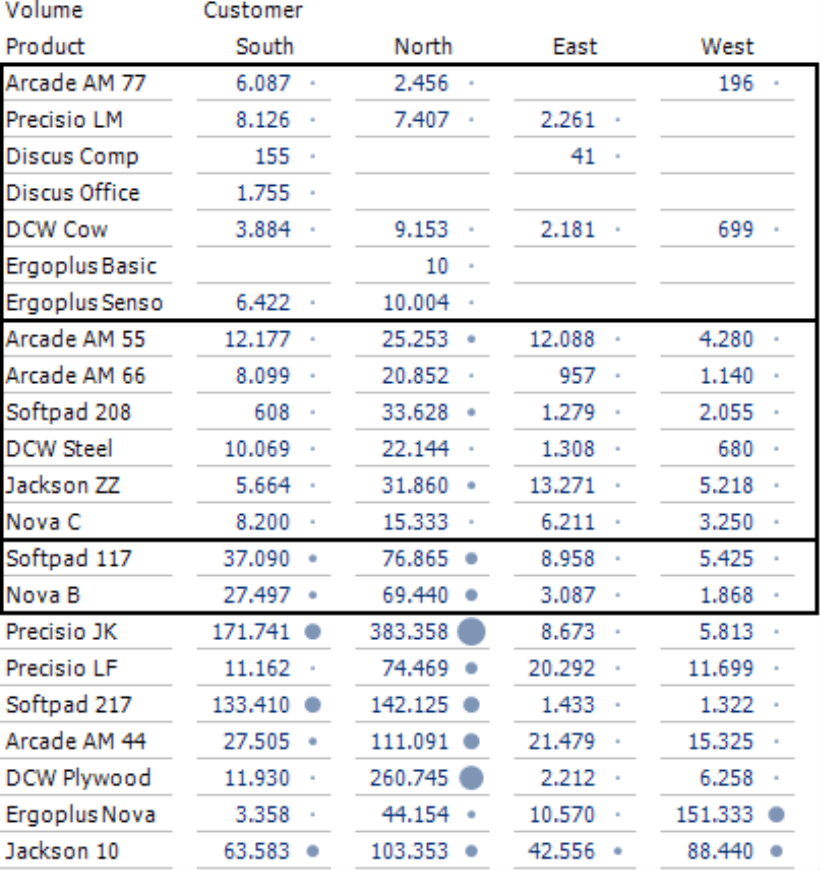
If you opt to calculate the clusters using absolute values instead of shares, you will get a different picture. Both types of analysis are justified. Oftentimes, you will focus on absolute values and, in turn, clusters with high values. Observing relative values, however, can make sense and provide interesting insights as well. You could, for example, develop the same guidelines for shipping logistics for products with similar numbers of sold items even though the sales volumes generated through them are of different magnitude.
If you save a pivot table or Cross Table Analysis with a calculated cluster analysis, you can access the clusters from Viewer mode as well. If you then refresh the report or change the View, for example, to another month, DeltaMaster will automatically recalculate the cluster analysis.
Behind the scenes
Cluster analysis in DeltaMaster is designed so that is simple to use and robust against different constellations of data. If you care to know the details: It uses a Euclidean distance to determine the similarity of objects and groups them using the average linkage method. An additional set of rules ensures that the analysis generates usable results even under adverse conditions. Thanks to the adapting threshold, you will rarely experience that DeltaMaster finds no clusters or only one cluster containing all objects.
Threaded Analysis Technology: Reusing found clusters
In many cases, cluster analysis may provide all of the information you need – namely, a reference to data relationships that you probably would not have detected without computerized help. Sometimes, however, you may want to go a step further, for example, to analyze the identified groups and use these clusters in other reports and analyses.
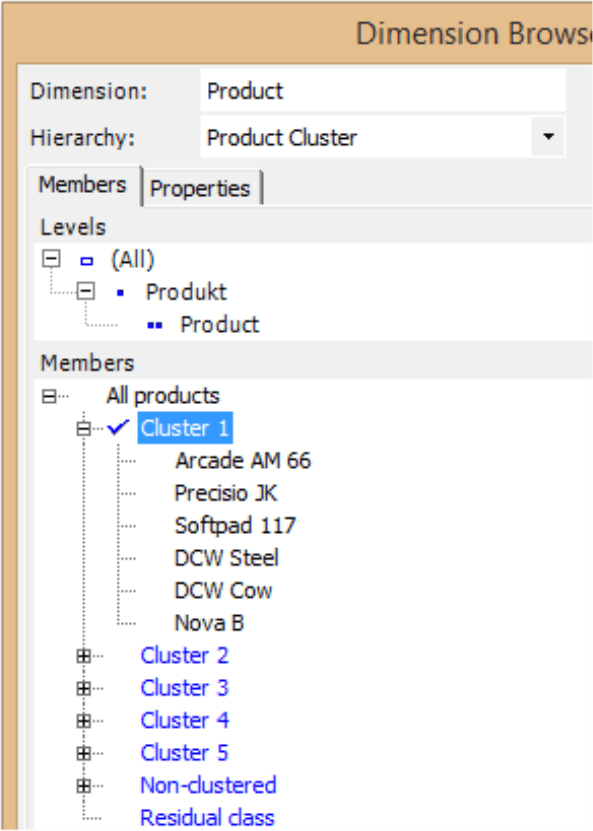
You can perform these types of advanced analyses starting with a Cross Table Analysis in Miner mode. You can first save the found clusters as a virtual hierarchy, which you can then access in the Dimension Browser, in pivot tables, analysis methods, etc. along with the dimensions that DeltaMaster has received from the database. Since the hierarchy is administered solely in DeltaMaster, no changes to the database are necessary. DeltaMaster will initially give the members default names (e.g. “Cluster 1”, “Cluster 2”), which you can later change in the Dimension Browser (context menu or F2 key). Members that do not match in any cluster are assigned to the virtual member “Non-clustered”. If required, DeltaMaster can also create a “Residual class”, which serves as a collection area for all members omitted from the current table view (e.g. rows/columns that are empty or have been filtered out). For more information, please read DeltaMaster deltas! 5.5.5, feature #10.
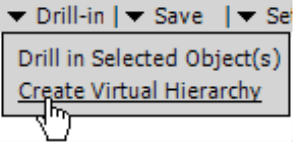
You can create a virtual hierarchy from the Drill-in menu (Analysis window). This entry will only appear if DeltaMaster has calculated the cluster analysis and actually found clusters.
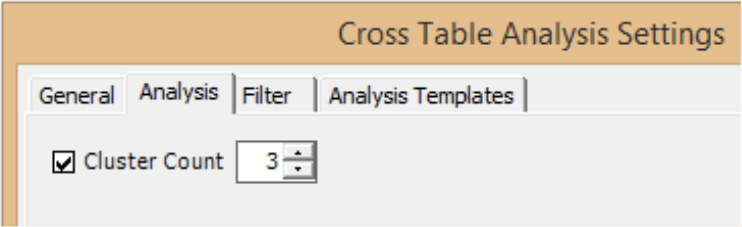
For reusing clusters as a virtual hierarchy, it may be reasonable to define a Cluster Count. You can enter this number in the Settings of the Cross Table Analysis (see DeltaMaster deltas! 5.5.6, feature #7).
Universal usage
You can apply cluster analysis to any pivot table or Cross Table Analysis you wish. This analysis is well suited for customers, regions, products, materials, and other attributes that you can plausibly define and examine as a group. You can also perform a cluster analysis on nested axes, for example, if you want to observe articles and different configuration options at the same time. In some scenarios, however, you would not want to use a cluster analysis due to the given content. It would not make sense, for example, to group accounts, P&L lines, or the measures of a KPI view. You would also generally not search for clusters in the time dimension.
Questions? Comments?
Just contact your Bissantz team for more information.
