![]()
Greetings, fellow data analysts!
The Brockhaus encyclopedia, once known throughout Germany as the epitome of a reliable information source, is now a thing of the past: The printed version was discontinued in 2014. New media and Internet portals such as Wikipedia sealed its fate. If you browse through their articles, however, you will sometimes miss the professional expertise that made the printed works so renowned. On the other hand, you probably do not want to miss the flexibility to jump from article to article – or the interactive cross references, which link articles and further information to each other so that you can explore your thoughts more deeply. That is enlightening and fun as well – as long as you don’t get bogged down in the masses of knowledge. This same handling can give management information a boost, too. In the pivot tables of DeltaMaster, you can create links that guide users to detailed analyses. These links can even transfer members and values from the initial report for further investigation. To ensure that no one loses their way on the analysis paths, the report editor defines where to place the links as well as where they should lead in advance. Such reports are enlightening and fun to use!
Best regards,
Your Bissantz & Company team
A good report does more than simply answer a single question – it triggers new ones as well. Great if you can find the answers to those questions directly from the same report!
To do that, many DeltaMaster users rely on links. Links enable users in Viewer, Pivotizer, and Analyzer modes to jump from a table cell to predefined reports and analyses. The View of the initial report remains the same: If the user has set any filters, they apply to the target report as well. Filters and measures can also be transferred from the initial report so that the target report returns the exact perspectives and measures that the users want to investigate. This approach opens analysis paths that are as flexible as in Miner but as simple as in Viewer. We will explain that in detail later.
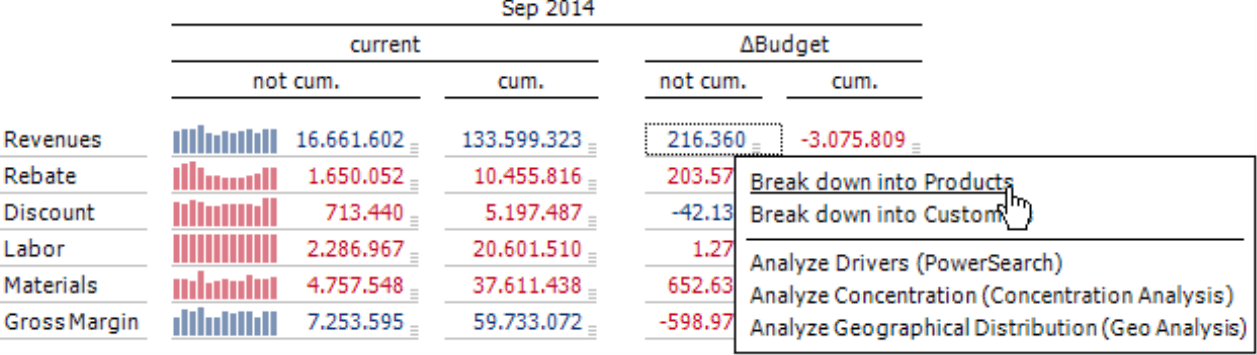
Adding links
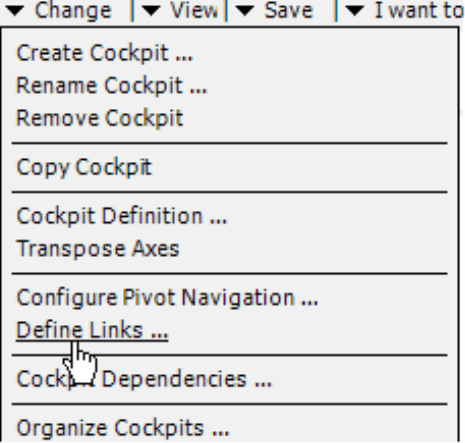
You can define links in pivot tables in Miner mode (Change menu in the Cockpit window).
For each pivot table, you can define multiple links that are displayed in the same order that they are in the dialog box. You can sort the links by dragging the small gray fields in the very first column and dropping them to the desired position.
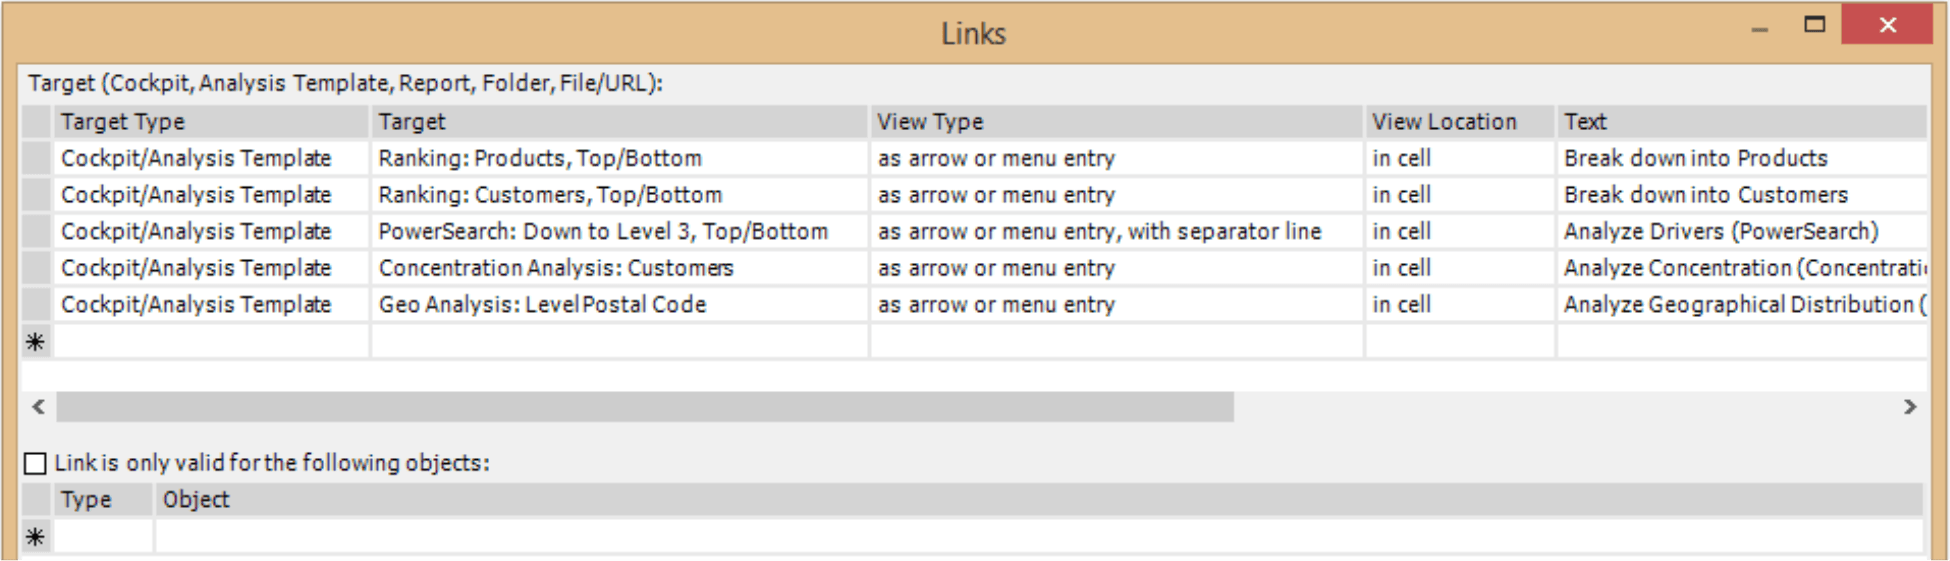
Each link has two mandatory fields: Target Type and Target. All of the following fields in the link definition are optional or pre-configured automatically so that they work without any additional changes on your part.
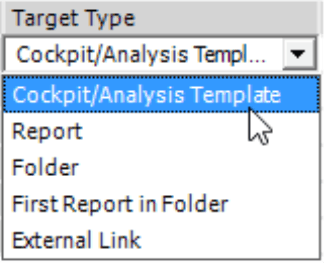
The Target Type shows the type of object that the link references.
- The most important Target Type is Cockpit/Analysis Template. These are the pivot tables, FlexReports, Combination Cockpits, and parameter sets of analysis methods that were created and saved in Miner mode. When you follow this type of link, DeltaMaster will dynamically create a new report based on the selected cockpit or analysis template.
- If the target is a Report or First report in folder, DeltaMaster will open an existing report and select it in the Briefing Book.
- If the target is a Folder, DeltaMaster will display its Title Page as it is configured in the Folder Properties and select the folder in the Briefing Book.
- An External link references files or folders in the file system or documents on a Web server. DeltaMaster will follow these links in either an internal Web browser in DeltaMaster or an external one based on the settings in the Options (Extras menu) on the General tab.
The Target Type determines how to select the link’s actual Target.
- If you are a report editor, you may already know the dialog box for selecting Cockpits/Analysis Templates from the analysis method Small Multiples and from Combination Cockpits. The selection list is sorted alphabetically. The analysis templates are grouped by the respective analysis methods.
- The selection lists for a Report or Folder are also sorted alphabetically.
- For an External link, you enter the respective URL (F2 key), for example: “http://www.bissantz.com/”. You can also select a file using the selection dialog box. UNC paths are supported.
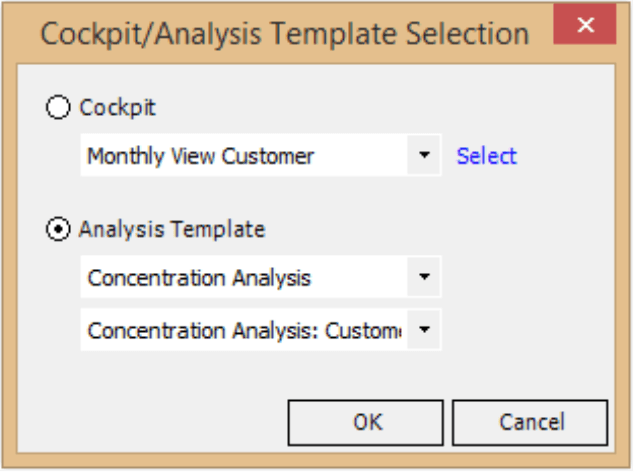
Once you have selected the Target Type and Target, the link will work.
Displaying links in the pivot table
Starting in version 5.6.3, DeltaMaster will designate when links are defined in a pivot table by placing small symbols directly in the report of Viewer, Pivotizer, and Analyzer modes. In Miner mode, you can choose which visualization you want to use (View Type) and where the symbols should be placed (View Location) – specifically, either in data cells or in row headers.
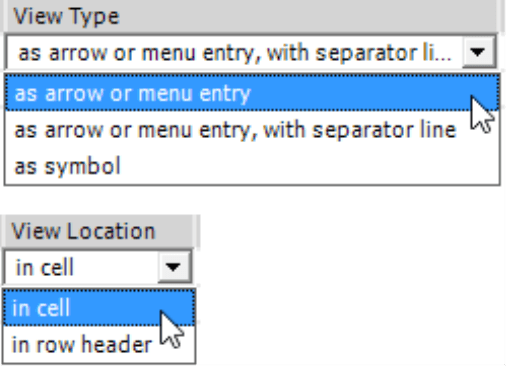
- A gray, diagonal arrow indicates a data cell or row header with exactly one link. Click on the arrow to follow that link.
- A menu symbol with three horizontal lines (as you know from smartphones) indicates a data cell or row header with multiple links. The menu will open when you mouse over it. Click on an entry to follow that link.
- In place of the arrow, DeltaMaster can also display a function symbol (“f”). This resembles the mathematical symbol that describes dependencies of variables (“f(x) = …”). This symbol can give the link a special meaning, for example, when it refers to a functional report where the respective value serves as a starting variable for further calculations. The function symbol, like the arrow, stands for a single link. Click on the symbol to follow that link.
DeltaMaster will automatically choose between arrow and menu symbol: If a data cell or row header has exactly one link, DeltaMaster will display an arrow. If there are several links, DeltaMaster will combine them in a menu and display the menu symbol.
If you enter a Text to a link, DeltaMaster will display it as a tooltip for arrows and function symbols or as a caption in menus. If the Text field is empty, it will not display a tooltip and show the original names from the Target field in the menus. The Text is designed for end users and has a great influence on whether they consider the application to be user-friendly or not. Some report editors even enter questions in this field – the clearer the better! If links have the Target Type Cockpit/Analysis Template, DeltaMaster will also display the text as a heading in the Report window.
To learn more about displaying links in a report, please read DeltaMaster deltas! 5.6.3, feature #5.
Conditions for links
Sometimes links are only relevant when certain Conditions have been met. You may, for example, only offer a customer list if revenues have been booked for a certain country or product group.
You can define these criteria as an MDX expression – for example, “[Measures].[Revenues] > 0”. DeltaMaster evaluates these conditions for each cell based on the respective row and column members. If that is not desired in certain cases, you can set the value type, time reference, etc. using tuple expressions.
In the bottom part of the definition dialog box, you can opt to only display links for certain objects (i.e. measures). The list refers to the link selected in the upper part of the dialog box. If the option is activated, DeltaMaster will only show the link in Viewer, Pivotizer, and Analyzer mode if a data cell or row header contains one of the listed measures.
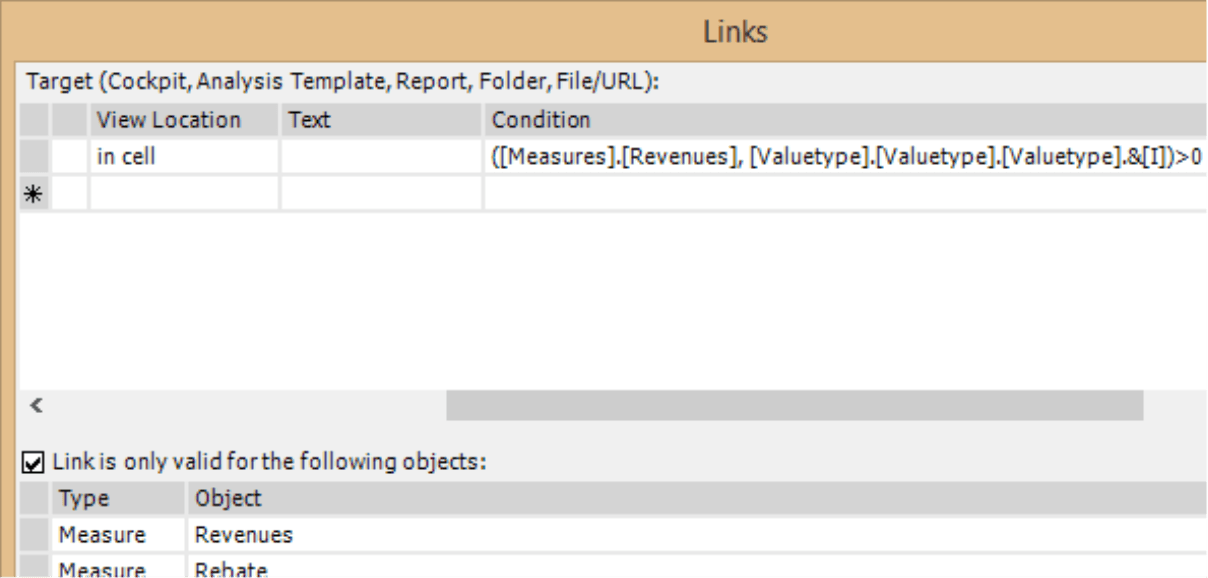
DeltaMaster will evaluate all of these criteria dynamically and take them into account when it differentiates how many links (i.e. one or more) are valid for a data cell or row header. The same report, therefore, may contain a larger or smaller number of links depending on the current view.
Links and filters
One feature that is especially interesting in interactive data analysis is that links can transfer properties of the current report view to the target report. This affects the selected members in the View window as well as members on the rows and columns of the pivot table.
![]()
- If you switch to another report in the Briefing Book, DeltaMaster will always display the “new” report with the View that was saved with it. If you follow a link, however, the View will not change. If a user, for example, has set individual filters for countries, product groups, and sales channels in an overview report, these filters would also apply to the detailed reports that are available through links. Miner users will recognize this handling from cockpits. Now users in Viewer mode can enjoy this same handling through links.
- DeltaMaster can also filter the target report based on the row objects and/or column objects. If the user follows a link, DeltaMaster will recognize which dimension members (objects) are valid for this cell – figuratively speaking, how the rows and columns of the respective table cells are labelled. DeltaMaster will then open the linked report and select these exact members in the View. In doing so, the value of the cell will appear in the target report the exact same way as it was displayed in the initial report. You can activate the filters of the target report separately by row and column objects. If the links are displayed in the row heading, you can only filter row objects; the option for column objects will be deactivated. If neither option is activated, the link will work as if you changed to another report with a constant View.
- You can also transfer a measure similar to how you would transfer dimension members. If you have defined a link to an analysis template from a Ranking where the customers are sorted by revenues, you can also use the same link for all other measures of the pivot table. This will create a ranking of customers by revenues, discounts, margin, etc. depending on which measure applies to the cell containing the link. If the link target works with more than one measure (e.g. Portfolio Analysis or pivot table with a KPI overview), this option will have no effect. See DeltaMaster deltas! 5.5.1, feature #10 for more information.
The View Context, which applies to filter settings in Viewer mode, determines the dimensions that Viewer users can see and where they can make a selection. This also applies to filters that are set by links. The view context of the initial report has precedence over the context of the target report. The Default Selection (see DeltaMaster deltas! 5.5.7, feature #22) will not apply and be removed in all hierarchies.
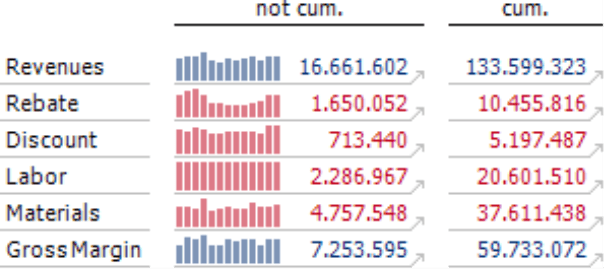
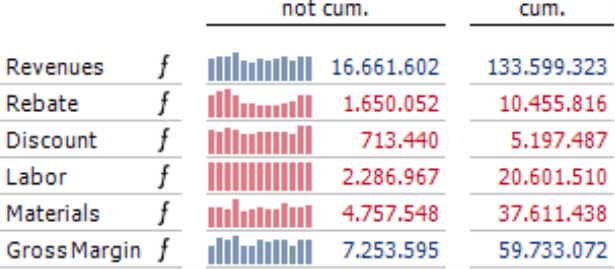
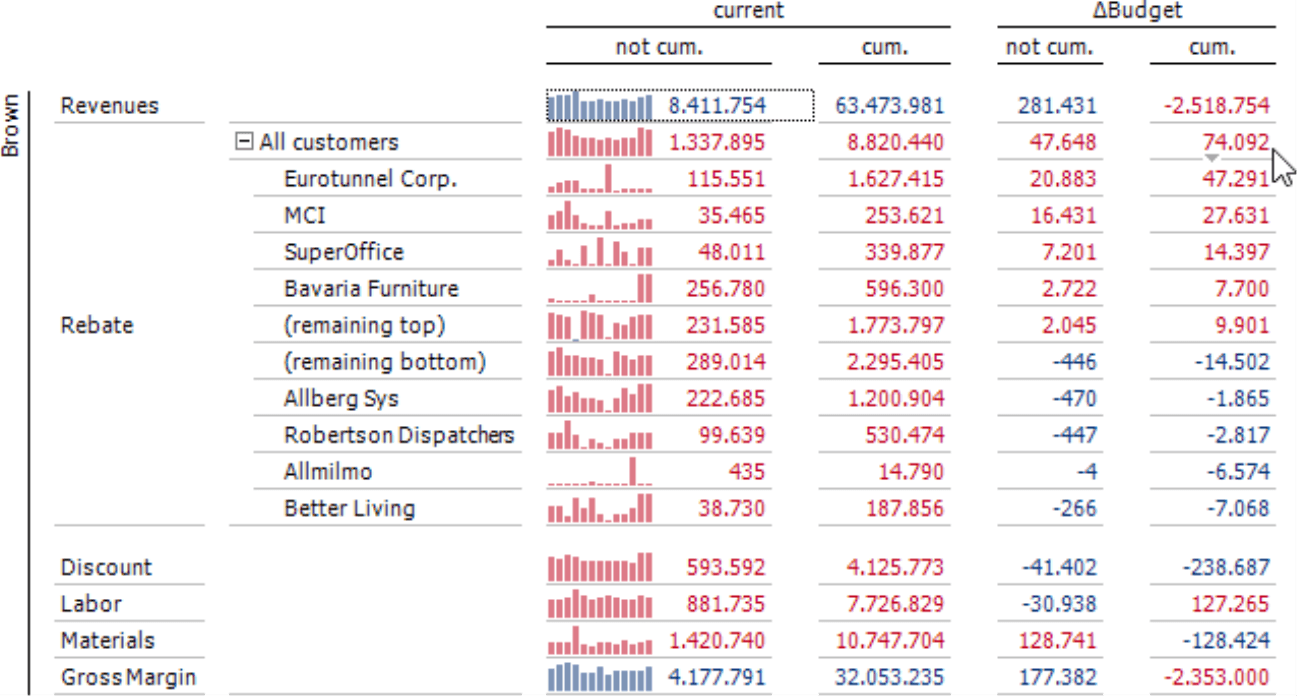
The example below links all cells to the same target (i.e. the report “Customers Overview”). The link is configured to filter row objects and column objects as well as transfer the measure.
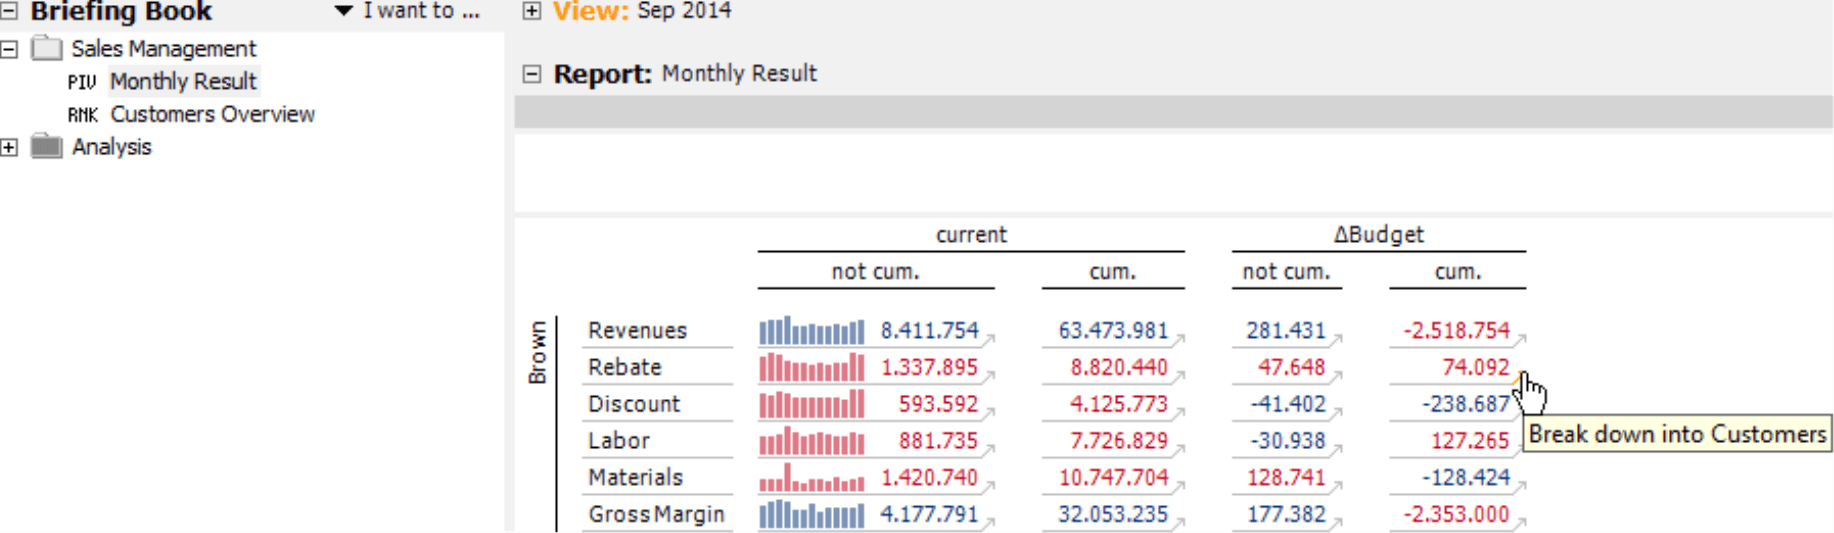
If you follow the link for the selected value “74.092”, you will see the following:
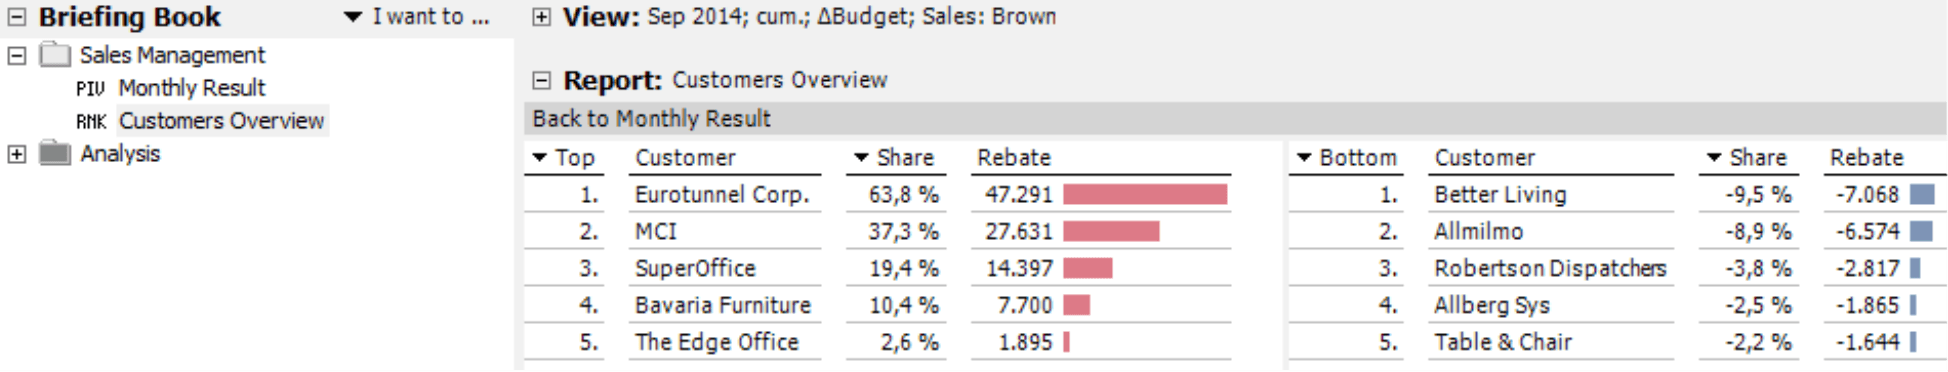
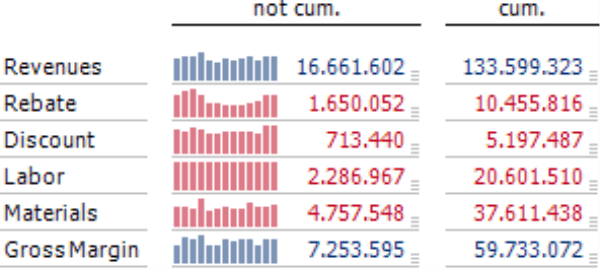
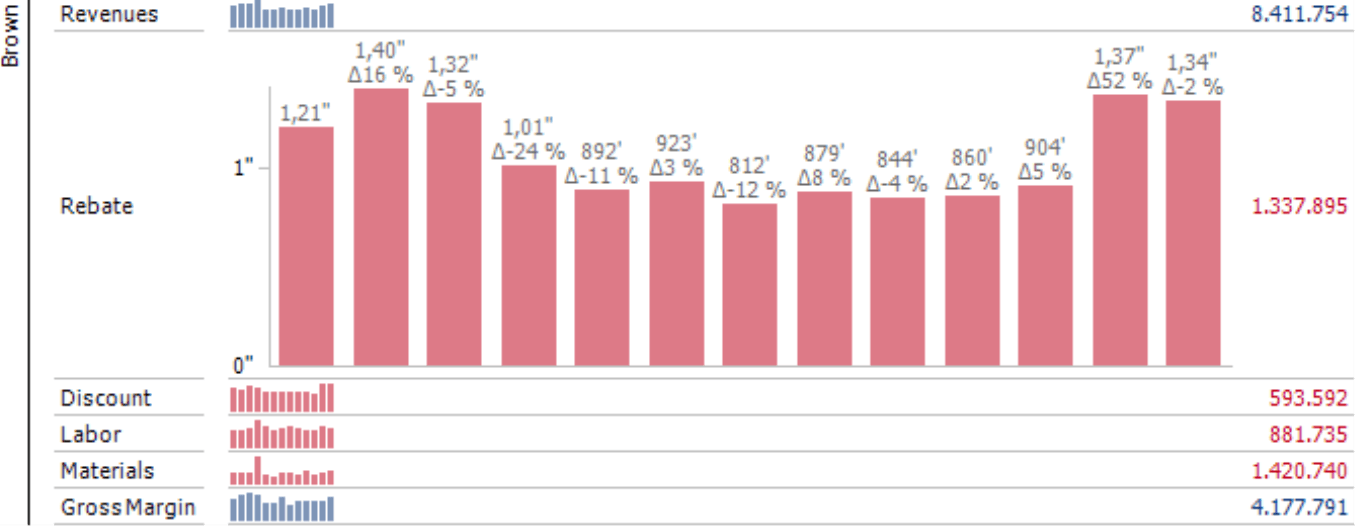
The report “Customers Overview” is now selected in the Briefing Book and displayed for September 2014 – as it is in the initial report. From this report, DeltaMaster has also taken the row object “Sales: Brown” and the column objects “cum.” and “?Budget”, which are all selected in the View window and act as a filter on the target report. DeltaMaster has also transferred the measure “Rebate” to the target report.
Returning back
You may want to offer the option to return back to the link’s origin from a linked report. DeltaMaster will then display this return link above the report as shown in the screenshot above. You can also link multiple pivot tables like a chain. Before you use this option, please take into consideration that multi-level analysis paths can quickly get confusing and require a great deal of concentration from the individual users.
![]()
Analysis paths just like in Miner, yet simple like in Viewer
You do not need to use links in Miner mode, because it offers the same functionality in a different way. In Miner, you can, for example, use the drag-and-drop function to transfer measures from a pivot table to an analysis method (Threaded Analysis Technology), and the View remains the same when you switch from one cockpit to another. You can implement these functions in Viewer mode with the help of links. For this purpose, you will need to define which detailed reports and analyses are possible in advance (Miner mode) to provide users with logical in-depth analyses for that given situation.
Alternatives: Keeping the context to prevent change blindness
Links are not the only way you can offer detailed analyses of pivot tables in Viewer mode. In many cases, the Pivot Navigation offers a good, or even better, alternative. And if you want to offer a time series for more detailed analysis, you can also use sparklines in combination with the Semantic Zoom function. These alternatives both provide additional information in the original context by expanding the existing report step by step and not switching to a different report. For more information, please read DeltaMaster clicks! 04/2014.
With the Pivot Navigation, users can display, for example, the main customers who have caused a variance as additional entries directly within the original report (see DeltaMaster clicks! 02/2015).
To examine absolute and percentage changes from period to period, you can also zoom into sparklines that are displayed in the report. The smooth transition from a cell graphic to a chart makes the content easy to understand.
The resulting visualizations are very comprehensible. The types of comparison stay the same and you never lose sight of the analysis path. This helps minimize the risk of change blindness, a natural phenomenon in which people completely oversee even major changes when their attention is focused elsewhere. This effect can occur with links. If the entire picture changes as the readers switch from one report to the other, they must concentrate more to stay focused and not forget which values and context they were examining in the first place – similar to getting lost in hyperspace. This problem does not occur with the Pivot Navigation and Semantic Zoom functions, which keep the original context and give the reader a firm holding.
Design options
As a thoughtful report editor or application designer, you should always check whether links, the Pivot Navigation, or sparklines with the Semantic Zoom (in the case of references to time) are the best way to offer details to your readers. If you want to present the details in the same structures as the initial values, the Pivot Navigation is the best choice – provided, of course, that you have valid licensing for the Navigation Option or use DeltaMaster Navigator. In cases where you need or want to change the visualization (e.g. to jump from a pivot table to a Geo Analysis map), links are the only option.
When planning analysis paths with links, you should also take the structure of reports into consideration. In cases where the users keep filters or measures while switching to another report, they should expect that the basic assumptions and main structural characteristics will stay the same. For example, the reading direction should remain constant so that the previous year, budget, variance, and forecast values are all displayed in the same order. These types of design decisions play a pivotal role in determining if the application is easy to use and understand.
Questions? Comments?
Just contact your Bissantz team for more information.
