![]()
Greetings, fellow data analysts!
Does this ring a bell? The report is long and the screen is wide. Scrolling is tedious and interferes with reading. Help is at hand with the Graphical Tables from DeltaMaster 6: They support table wrapping, which distributes long tables over multiple display columns and wide tables over multiple display rows – dynamically and automatically, depending on the data to be displayed and the available screen space. Some people call this “responsive design” – but it is not a discipline in controlling. Controllers deal with data and what they mean, and are happy to let the design take care of itself. That is why we have provided a brief description here of the check mark you can use to activate the table wrap so that you can quickly get back to working on the data. And we really do mean check mark in the singular: There is just one.
Best regards,
Your Bissantz & Company team
A before-and-after comparison makes particularly clear what a table wrap is – see the next page.
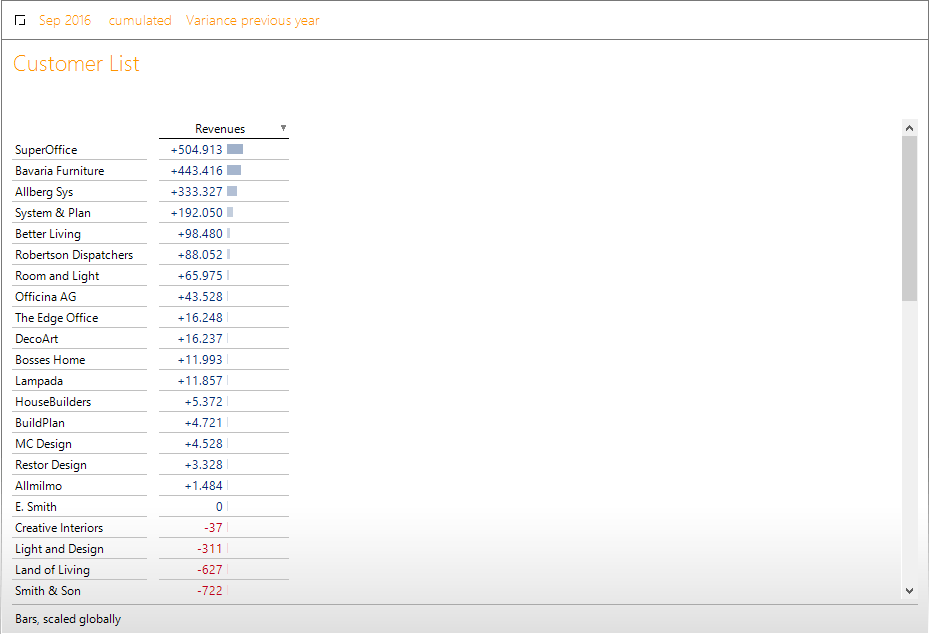
Before: A long, un-wrapped table – or rather an almost empty screen and a list whose length can only be gaged with the scroll bar. Well-versed readers will have a hunch that even though the table starts with good news, such as the pleasing changes at the customers SuperOffice, Bavaria Furniture, etc., at least one piece of bad news will be lurking at the end of the list – the short bar next to SuperOffice suggests this. If you scroll to the end of the table, you will lose sight of the beginning. There would actually still be space here, …
After (see below): The same list in the screen section of identical size, wrapped and readable in full, including the already feared sharp negative variance.
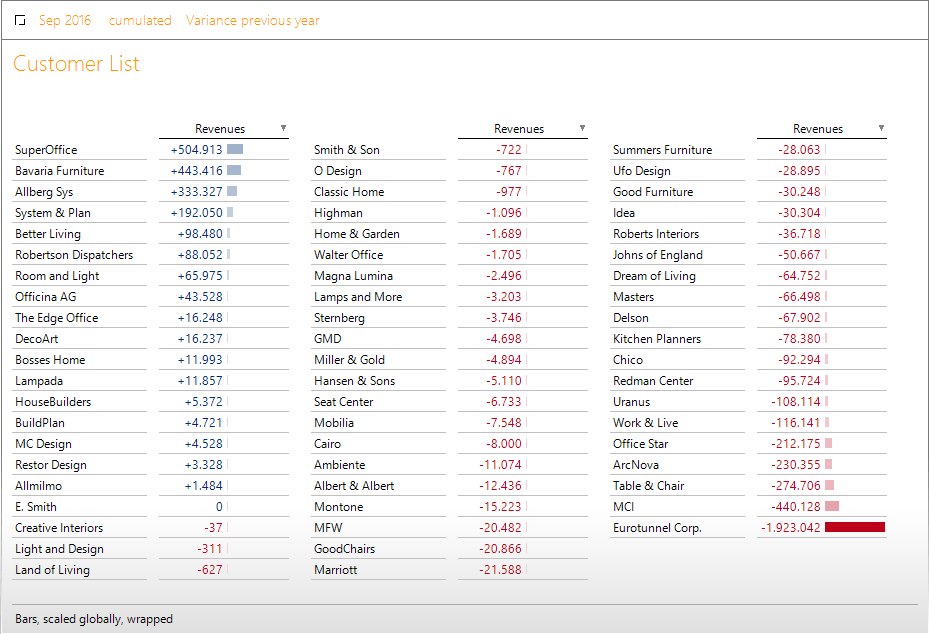
Further suggestions on how to compare positive and negative variances in the same report can be found in DeltaMaster clicks! 02/2015. – The above illustration is an example of a vertical wrap: A long table with one fixed column and one data column is wrapped across three display columns. DeltaMaster repeats the labeling of the columns automatically. The status bar points out the wrap so that you can see that the layout is a result of the formatting rather than of the structure (i.e. in the example, the revenue is always the same, and there are not three different measures with the same name, for instance).
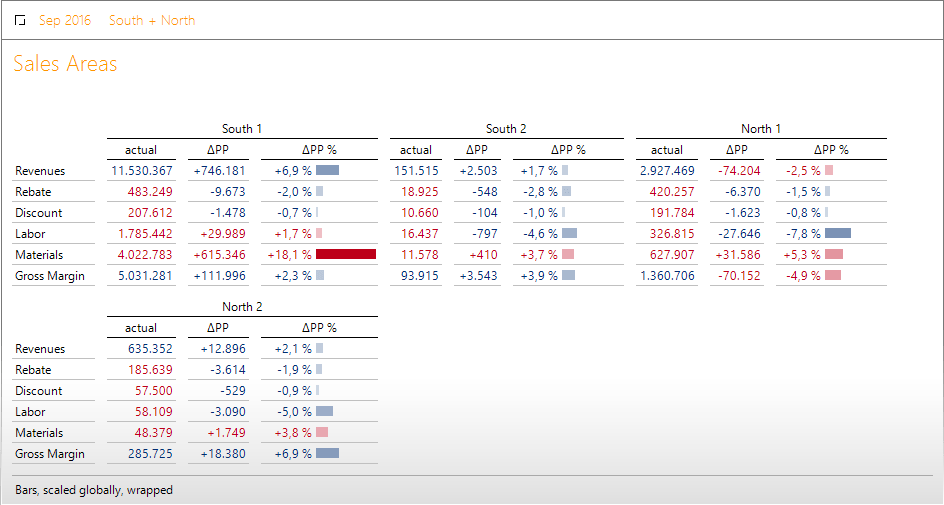
The following illustration shows an example of a horizontal wrap: A table that was previously too wide, …
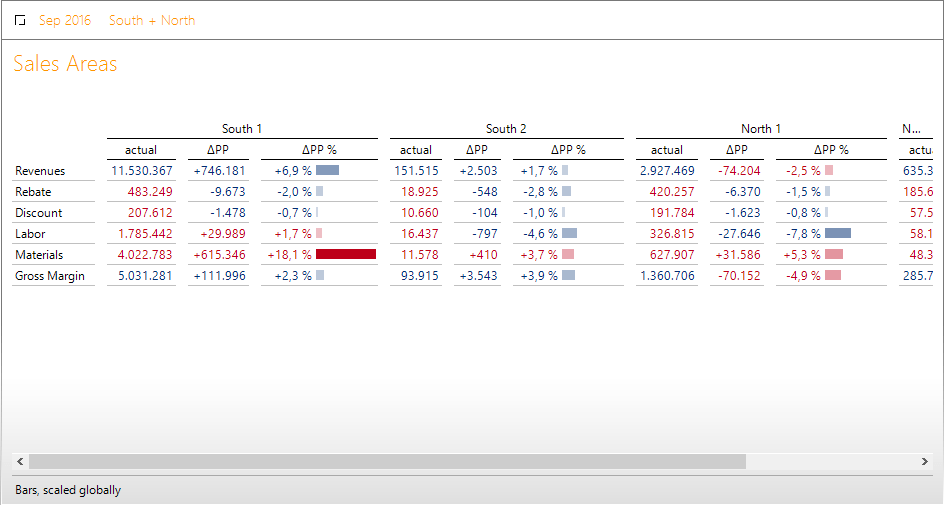
… fits entirely on the screen and is easy to read. Again, the screen section is the same as in the continuous display.
Give the wrap a try
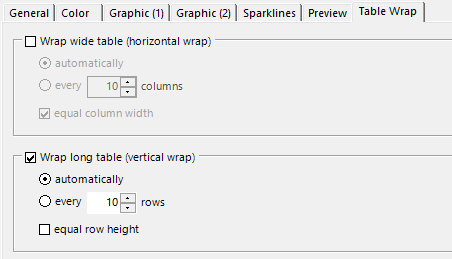
You can activate the Table Wrap in Modification mode if you edit the properties of the Graphical Table (Edit menu, on the right) on the corresponding tab.
You have already encountered the two alternatives in the above examples.
- The horizontal wrap is suitable for wide tables: After a number of columns automatically determined by DeltaMaster or predefined by the user, the table is wrapped to the right, and the further columns are shown in a new display row. In figurative terms, what no longer fits at the back of the screen is continued underneath from the front (in a line pattern like a Z).
- The vertical wrap is suitable for long tables: After a number of rows automatically determined by DeltaMaster or predefined by the user, the table is wrapped at the bottom so that further rows are shown in a new display column. In figurative terms, what no longer fits at the bottom of the screen is continued at the side from the top (in a line pattern like a W).
Automatically wrapped is best
Where a choice can be made between automatic and custom in DeltaMaster, we generally recommend automatic. This also applies to the table wrap: In automatic wrapping, DeltaMaster derives the number of columns and rows dynamically from the available screen space in order to make optimum use of it.
In special data situations, you may wish to specify the number of columns or rows, for instance if the report needs to follow a specific symmetry. In the illustration on the right, the report already wrapped above is structured with the sales areas in such a way that the sales areas of a region appear in pairs: South 1 next to South 2, North 1 next to North 2.
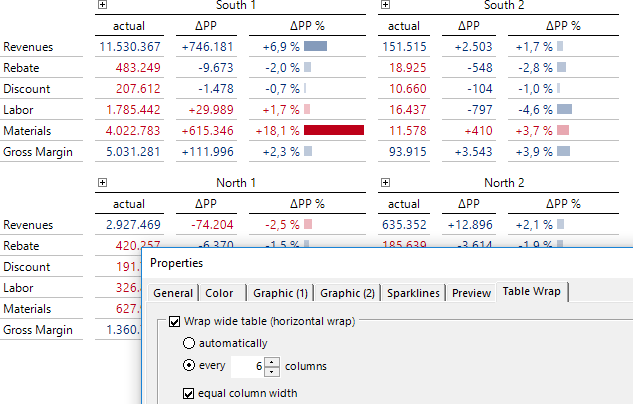
An essential condition for special cases such as this is normally that the structure of the data to be displayed is constant and the length and width of the report are independent of the Filters (View). In the case of nested axes, the columns and rows on the very inside are counted.
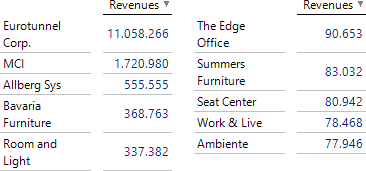
The options for equal column width or equal row height ensure a consistent grid in the wrapped table and therefore, in some cases, a more harmonious appearance of the report. This particularly applies if the labels in the column/row headings have differing lengths or have one row in some cases and multiple rows in others, as shown in the following example – without standardized row height on the left, and with on the right.
 |
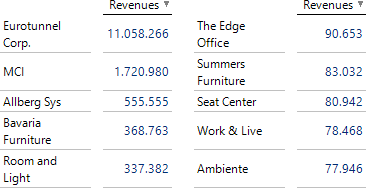 |
The starting point was a table with ten entries and a fixed column width (Properties of the Graphical Table, General tab); the wrap was forced after predefined five rows.
Editing a wrapped table
The table wrap is highly dynamic. An essential condition for that is a dynamic environment in which DeltaMaster has absolute authority over the output. This results in certain limits regarding use, namely by other programs (Microsoft Office, web browsers) and by other DeltaMaster functions that compete with the table wrap for control of the precious screen space. For instance, in the event of export, the table wrap is only retained if you export the table as an image; the WebClient does not support the table wrap currently. Automatic row and column structuring (separation) cannot be used concurrently with the table wrap. The analysis functions Zoom and Navigate, searching on the row axis, and displaying as Small Multiples are also not possible in wrapped tables. (Incidentally, the display of Graphical Tables as Small Multiples also adapts very well to the available screen space; despite different concepts, a certain similarity with the table wrap may be seen here.)
Apart from this, the table can still be adapted and structured in Modification mode. For example, you can:
- change the structure of the table by adding, removing, or changing the sequence of dimensions and measures;
- calculate and display variances (Magic Button Deltas);
- display graphics and Sparklines (Magic Button Graphic or History or the Edit menu);
- calculate and display shares (Magic Button Share);
- drill down and roll up branches; and
- display and hide member properties (context menu).
In particular in operational reports, e.g. evaluations of customers, products, or materials – you can make the reports much easier to read with the table wrap. Give it a try now!
