![]()
Dear data analysts,
the inventiveness of the people of Middle Franconia went down in the history of the German language as the “Nuremberg wit”. A wit was once understood as expertise, sophistication, and smartness. Today, this meaning can be felt only in a few phrases. One of them: the staircase wit. It does not stand for a humoristic story told on a staircase, but rather: a quick-witted response that didn’t occur until after the event; a well-put comment that would have fitted excellently into the previous situation – if only one had thought of it a little earlier; an intelligent remark that was left undone because the thought about it came to mind too late.
DeltaMaster users have a clear advantage here – they are equipped with manifold analytical functions taking them straight to the interesting matters in the nick of time. And the instruments are extended permanently: In the current clicks!, we are happy to introduce a new data mining module that will arm you with further powerful arguments: the Stairs Analysis.
Kind regards,
Your Bissantz & Company team
![]() Since the DeltaMaster 5.1.5 release, a new analysis module for data mining is available: the Stairs Analysis. Occasionally, this approach is also referred to as waterfall or bridge analysis. Its goal is to explain the reasons for differences in individual dimensions, especially deviations between actual and budgeted values or the changes between two periods.
Since the DeltaMaster 5.1.5 release, a new analysis module for data mining is available: the Stairs Analysis. Occasionally, this approach is also referred to as waterfall or bridge analysis. Its goal is to explain the reasons for differences in individual dimensions, especially deviations between actual and budgeted values or the changes between two periods.
Typical questions you can answer with the stairs analysis are:
- Which customers have scored gains compared to the previous year? Where are the setbacks?
- Which products were sold over plan, and which ones fall short of our expectations?
- How about the distribution of the overall budget deviations among our product groups?
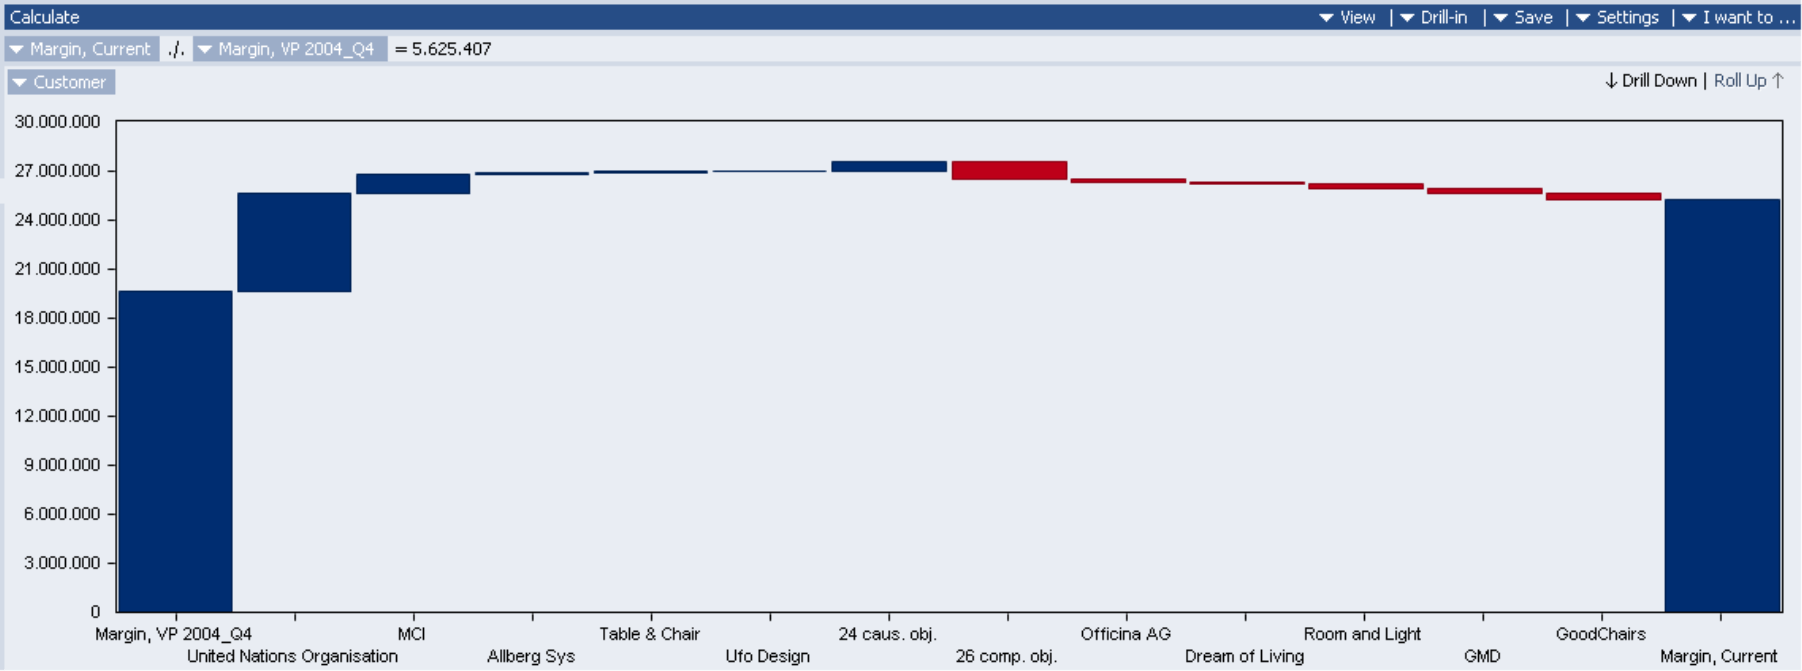
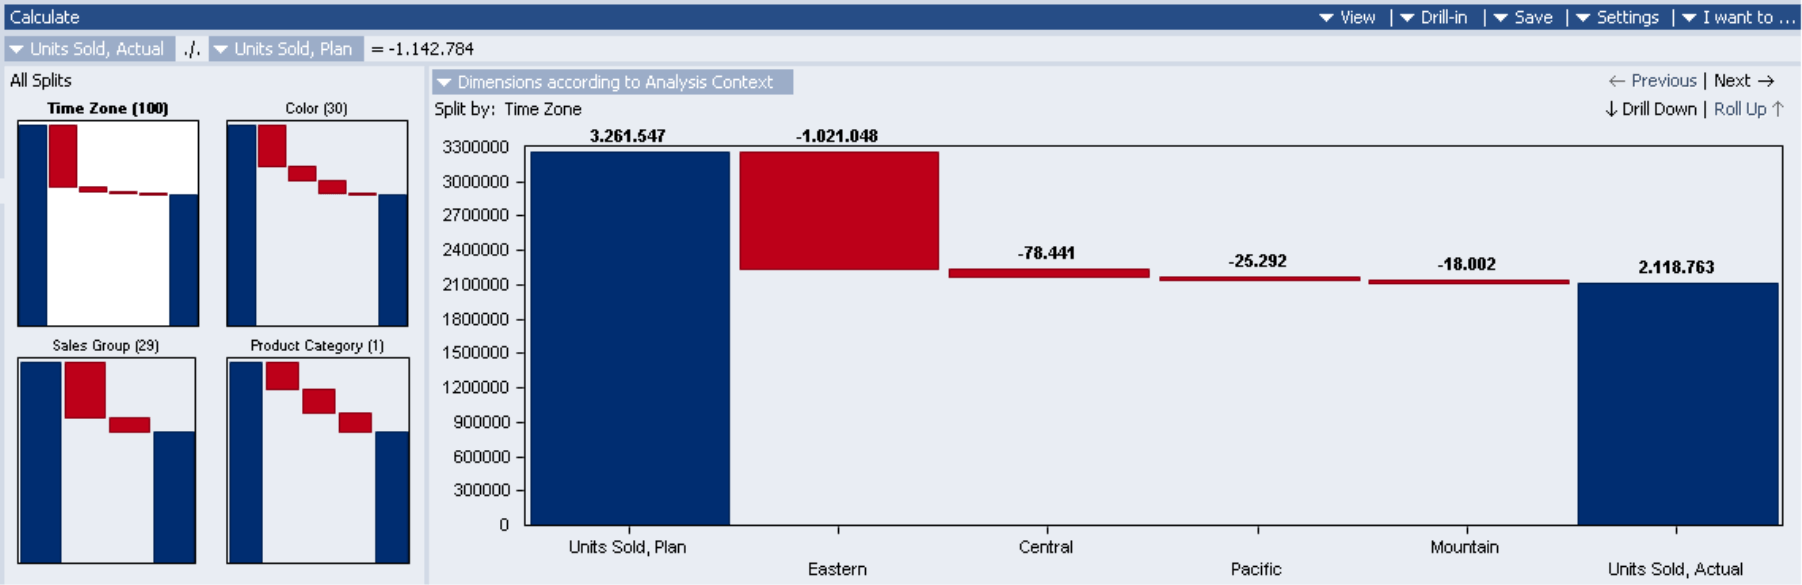
To get in on the analysis, you select two measures whose difference you’d like to explain – for example the current turnover and the budgeted turnover, or the current margin and previous period’s margin. The stairs analysis calculates the difference (deviation, change) between these two quantities and indicates how it is distributed among the elements of a certain dimension. The result is a chart like the following one:
Stairs, Archs, Bridges
One can clearly recognize how the stairs analysis came to its name. On the left side, the “start value” for the analysis is shown (mostly a budget, or the previous period as in the example), and the “end value” (actual, current) on the right side. The “path” from the start value to the end value is depicted along the elements of a dimension in the shape of “stairs” whose height reflects their contribution. From left to right, DeltaMaster first shows the causing objects (in the example those who contributed to the total difference in a positive way) and then the compensating ones. The individual values are sorted. Due to this order, the result looks like an arch or a bridge. (We hope that you’ll face triumphal archs rather than bridges of sighs!) Depending on the data, the results may also have other shapes: A “suspension bridge” indicates an overall negative deviation, for instance due to cost cuts or turnover drops. If there are only causing and no compensating effects, the chart resembles an up- or downward flight of stairs.
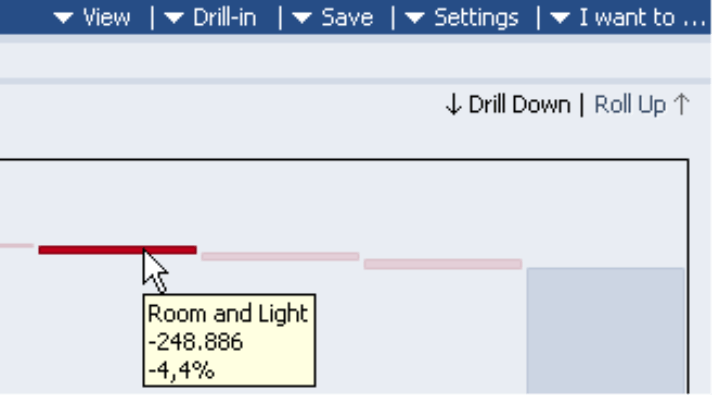
If you point to one of the graphical elements with the mouse, the corresponding absolute value and the share percentage of the total deviation will be shown as a tooltip. The threaded analysis technology is supported in the stairs as well: You can focus on any object and perform further investigations with a simple double-click. With the Drill Down and Drill In buttons, you switch the view to the first (and most important) causing object; these functions are equivalent to double-clicking on the first “stair”. Roll Up goes back one step in the analysis thread and reactivates the previous view.
Please note that when you select the measures for the module, the first quantity reflects the end value (right side of the result) and the second quantity the start value (left side).
Remainders in Groups
Like elsewhere, DeltaMaster is endeavoured to present only the really important aspects. Therefore, objects with little shares of the overall phenomenon can be grouped.
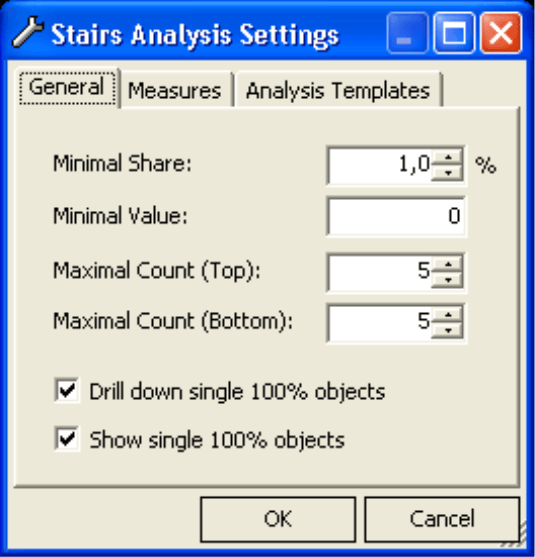
You specify the criteria for this behaviour in the Settings menu. Groupings will be made for elements
- that fall short of a certain minimal share (percentage) of the deviation to be explained,
- that are below a certain minimal (absolute) value,
- and/or do not belong to the n biggest causing (top)
and the m biggest compensating (bottom) objects.
If you set the minimal value or the minimal share to 0, the corresponding rule will be deactivated. The values are interpreted as absolute, so you don’t have to worry about the sign. We’ll go into the 100% objects further down.
The elements that are affected by these rules are called Residual Objects and shown in the stairs chart in one or two groups alternatively – one group if you want to set causing and compensating objects off against each other instead of further distinguishing between them; two groups, like in the following image, if you want to separate causing and compensating elements and show them individually.
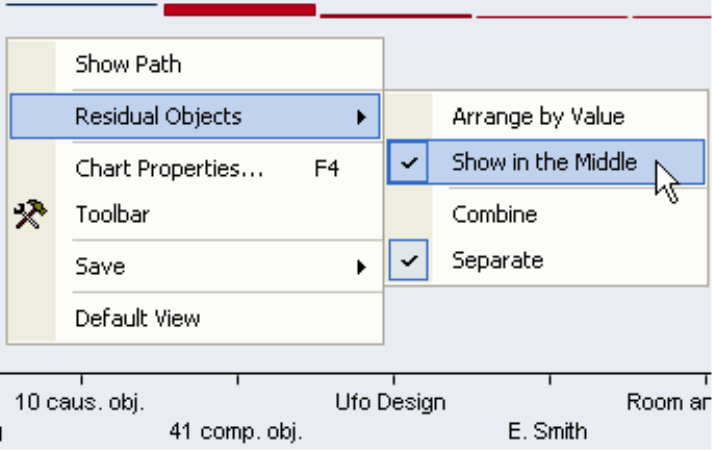
You determine the way residual objects are handled in the context menu of the stairs analysis. There you also specify where the group(s) should appear: either sorted in, according to their (totalled) value, or independent from their amount, and always in the middle of the chart. Sorting in the collection objects makes it easy to compare them with the individual ones, but this will not always be useful. By placing them in the middle, you prevent the lineup from being broken by a group object which should not be compared with the individual ones.
Multidimensional Top-down Analysis
It remains to clarify within which dimension DeltaMaster splits the deviation: Either you directly select the dimension you are interested in, or you opt for All dimensions / According to analysis context and leave it up to DeltaMaster which dimensions will be identified as particularly noticeable and thus suggested as an entry point – in the true sense of data mining. The approach resembles Navigation:
DeltaMaster determines the path to the contributors delivering the best explanation for the examined difference in a multidimensional top-down analysis. In a simplified way, a dimension is conspicuous the more uneven the examined value is distributed among the dimension elements. The dimension with the most heterogeneous structure will be suggested first. For this purpose, DeltaMaster shows an additional list containing the various determined splits in a separate window next to the stairs chart. By clicking on a preview chart, you switch to the corresponding dimension. As an alternative, you may use the Previous or Next button. For a detailed analysis of individual results, you click on the functions Drill In or Drill Down or double-click on a stair you’re interested in, as mentioned before. The chosen path will be shown in the upper part of the window, just like you’re used to from Navigation. The display of this path may be switched on and off via the context menu or the I want to menu.
100% Objects
If a dimension level consists of only one object containing a value, this object already explains 100 percent of the total value, and the split or a visualization as a stairs chart does not deliver great information gains. For these special cases, there are two further options in the Settings (see the image further above). If the first field Drill down single 100% objects is deactivated, the next level will be analyzed automatically, provided that it contains subordinate objects. The Show single 100% objects option activates/deactivates the display of dimension levels containing only a single object.
Formatting
For individual formatting, the stairs analysis contains a Toolbar like many other DeltaMaster modules. Furthermore, additional data-related parameters can be specified in the Chart properties. For instance point labels are activated here.
If you’d like to try the stairs analysis, just give us a call – our consultants will be pleased to go through the method with you individually.
