![]()
Greetings, fellow data analysts!
All beginnings are difficult…and sparklines are no exception. Where they end – namely, the current period – is clear. But where should they start? How do they react if you change where they end, for example, when you update a report to the current month? Should the start period for the sparkline change or should it remain constant? What about the start of a new year? These are just a few of the questions that need to be addressed – and many of the answers depend on how you use the report. Fortunately, DeltaMaster is well versed in using sparklines and can determine both where one should begin well as how long it should be based on the current period. Sometimes, you simply need to activate an option. In more complex cases, you can use MDX. And with the explanations in this edition of clicks!, it’s not even half as difficult as it may have sounded in the beginning.
Best regards,
Your Bissantz & Company
The less you need to change when updating standard reports, the better – and the more time you have for in-depth analysis. Ideally, all you should have to do as soon as the current data are available in the database is select the new month in the time dimension to update a report. DeltaMaster offers many different functions to provide this type of automation, especially when dealing with time dimensions. Time analysis members, for example, are very useful for making comparisons to previous periods. (see DeltaMaster clicks! 08/2007). Starting with the current period, you can automatically investigate previous ones, query values, calculate variances, etc. You can even use this method to dynamically define sparklines. If the user selects another period, DeltaMaster will simply move the starting time of the sparkline or make it longer or shorter. Please note that when we talk about automation here, we are focusing on pivot tables, the most important format in standard reporting. You can also dynamically define sparklines in a Flexreport as well, but we will delve into that some other time.
Where to start? How long?
The end of a sparkline is always the current period, meaning the member that is currently selected in the time dimension of the View window. The starting period and the total number of periods, however, vary based on the settings in the Table properties (context menu or I want to… menu). On the Sparklines tab, you can choose from the following four options:
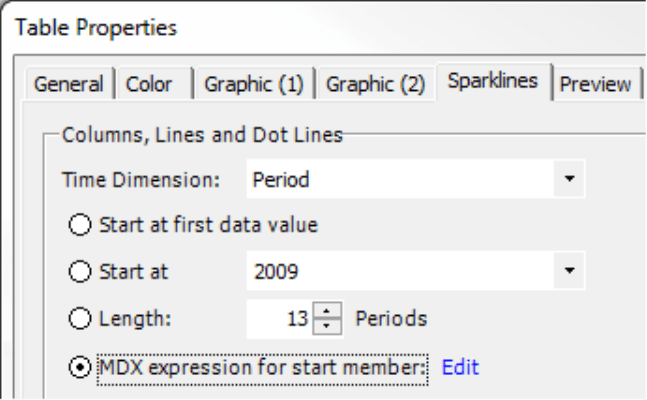
- Start at first data value: DeltaMaster will search for the earliest period in which one of the respective measures has a value (i.e. not zero). You can use this option, for example, to examine how “full” the database is. If you change the current period, the start member of the sparkline will stay constant. The length of the sparkline, however, will vary accordingly.
- Start at …: In the drop down list, DeltaMaster will list all members of the level that belongs to the current period. If you have selected a month in the View, for example, it will display all of the months. This list ends with the current period. You can use this option if want to examine the development from a set date (e.g. milestone or reference point in a given data pool). Here again, the current period only influences the length of the sparkline.
- Length … periods: This is the most common option – a rolling historical view that includes the past x periods starting from the current one. In this case, the start member of the sparkline varies with the current period. The length is constant. The default setting for new reports is 13 periods. Although that number may seem odd at first, this value takes into account that sparklines are generally used for monthly values. Since 13 months includes the respective calendar month of the previous year, you can make comparisons to the same period in the previous year. If you have selected September 2012 as the current period, for example, a sparkline with a length of 13 will date back to September 2011.
- MDX statement for start member: With this option, you neither have to define a set length or starting point. It calculates the start member for you. As always, the sparkline ends with the current period. With MDX, you can also create level-dependent definitions as shown in example 1 below. If you have selected a month as the current period, DeltaMaster will include 13 members. If you have chosen a quarter, it will only show five members.
With the MDX option, you can create very sophisticated sparklines. Let’s take a look at two examples which you can then use in your own applications.
Edit MDX statement
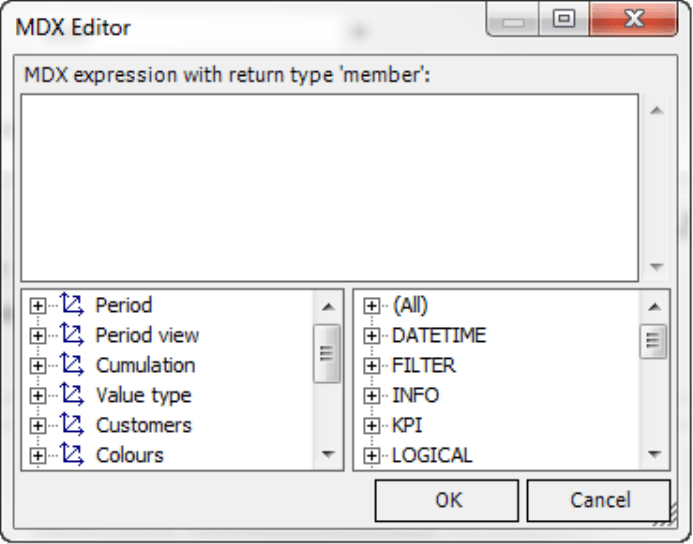
To Edit an MDX statement, simply open the Table properties, go to the Sparklines tab and click on the Edit link to open the MDX editor. You can enter the statement in the top part of the window. DeltaMaster displays the parts of the model (e.g. dimensions, measures) on the bottom-left side and an overview of the available MDX functions on the bottom-right side.
Three conditions apply to an MDX statement: 1.) the statement must return a dimension member, 2.) the returned member must belong to the same level as the current period, and 3.) that member must lie before the current period.
Example 1: Sparkline after same month or quarter in the previous year
The following expression selects the same period in the previous year as the start time for the sparkline while taking the level of the current period into account.
— one year back, same level
ParallelPeriod([Period].[Period].[Year], 1, <view2>)
If you wish to use this statement, please read the closing remarks in this edition of clicks!.
You can see the effect of this statement in the screenshot on your right and the one on the top of the next page. At first, the current period is set at May 2012. Based on that period, the MDX statement has set May 2011 as the start member as you can see from the status bar.
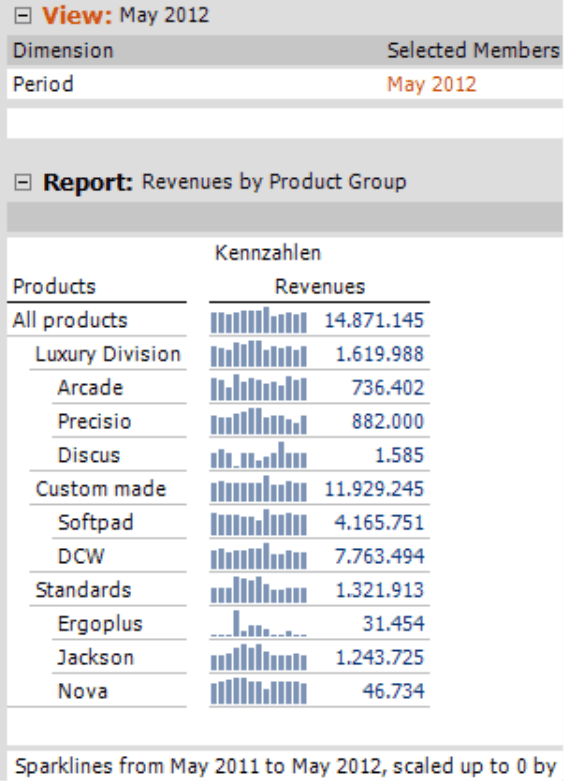
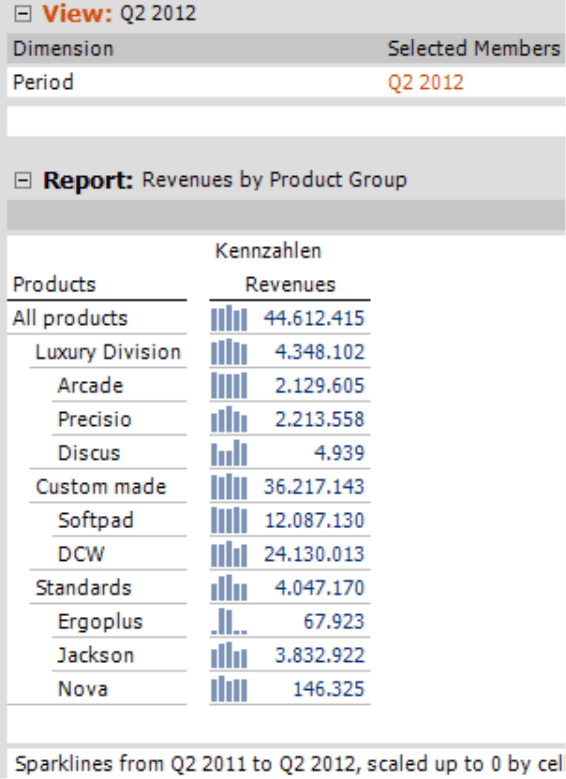
If you now switch to Q2 2012 in the View window, DeltaMaster will automatically update the sparkline, which now begins with the same quarter of the previous year and accordingly only has five columns (instead of 13 as with the months).
Example 2: Sparkline starting with the beginning of a year
The following statement returns the first member of the year and the level that belongs to the member that was selected in the View window – for example, the first month of the year if a month is selected or the first quarter of the year if a quarter is selected. This sparkline “grows” over the course of the year and automatically retracts at the start of a new year.
— Current year, first member of the current level
Descendants(Ancestor(<view2>, [Period].[Period].[Year]), <view2>.Level).Item(0).Item(0)
Again, please read the closing remarks in this edition of clicks! if you wish to use this statement.
The screenshot on your right shows a common usage scenario for sparklines – a report that automatically begins with the first period of the current year. This report shows the cumulative revenues (or another measure) for the current year to date and a sparkline showing the individual values that comprise the cumulative total. DeltaMaster lists the value of the largest measure (i.e. the cumulative value) and the individual components are compiled as a sparkline.
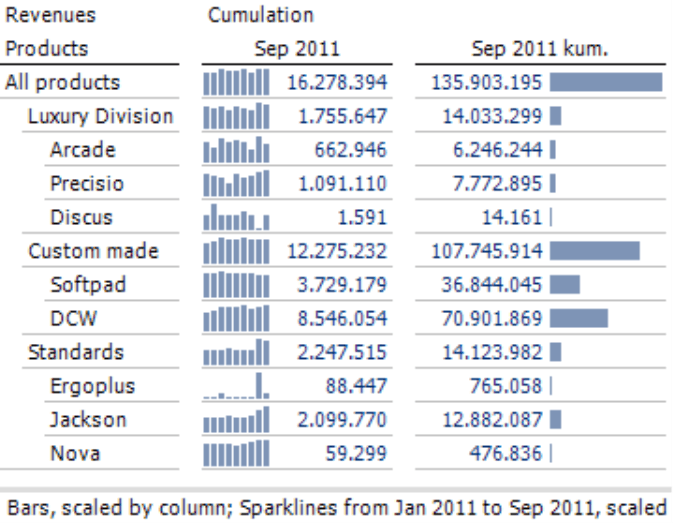
If you work with this kind of table, every once and a while someone may ask if it really needs to display two numbers at the same time (one for cumulative values and a second for the current period) or if it wouldn’t suffice to show the numerical value of the cumulation and the sparkline for the individual values without a number behind it. The conventions for interpreting sparklines provide a clear answer: No, you cannot display a sparkline showing individual values without a number. Yes, you need both numbers in order for the sparkline to work. The number serves as the label for the last point or column. It equals the value of the current period and provides the necessary “substance” to support the sparkline. Without the number, you could not roughly estimate which values the dots or columns represent. It would confuse the reader if you simply displayed the cumulated value instead of the one for the current period. As expected, the reader would associate the number with the final dot or column and incorrectly assess the previous dot or column. Bella, our consultant for all visualization questions summed it up nicely in her blog post, “Small things that make a big difference”.
The previous screenshot takes this into account correctly and displays both the current and cumulative values. The sparkline for the cumulative revenue is hidden (Column properties in the context menu of the column header) because sparklines for cumulative values only tend to add value when you are dealing with variance values. With revenues and other measures, they tend to create nondescript triangles or saw-tooth patterns.
Time dimension and “<viewX>” variable
You can copy both MDX examples and use them in your own analysis session. Please note, however, that you will need to make two modifications: the name of the time dimension or year level (in the example “[Period].[Period].[Year]“) and the variable for the current period (in the example “<view2>”).
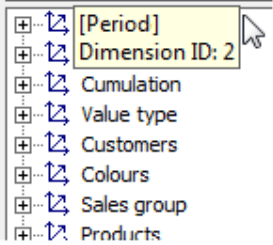
The variable has the following purpose. In the MDX statement, you generally determine the desired start member based of the member that was currently selected in the time dimension. The “<viewX>” variable enters this member in the MDX statement, whereby the “X” represents the unique dimension ID. This ID varies in each data model.
In the MDX editor, you can see which ID the time dimension has in your model. Simply go to the bottom-left side, hold the Alt key, and mouse over the desired dimension. DeltaMaster will display the ID in a tooltip. Since the time dimension in our example has the ID 2, the variable the selected time member is called “<view2>“.
The examples above contain a short comment, which starts with two minus signs (“–“), the common MDX notation. If you wish, you can copy this comment to document the definition.
