![]()
Greetings, fellow data analysts!
In Bella’s new book “Bella consults – 75 rules for better visualization”, rule #38 is: Make your message clear. And in this edition of clicks! we want to follow that rule to a tee. Our message for this issue is: A neat and orderly interface makes your work much easier.
Right now, you’re probably thinking that DeltaMaster already has a well organized interface that simplifies your work. Nevertheless, with a few simple tips you can make it even better. And, perhaps, you can even save a bit more time, which you could use to enjoy a good book – like Bella’s.
Best regards,
Your Bissantz & Company Team
A cube is the symbol for multidimensional data structures. After all, people can easily understand – and draw – its three dimensions. Multidimensional data structures in most real world scenarios, however, almost always involve more than three dimensions. And the more dimensions you have, the more difficult it is to maintain a clear overview. That’s why DeltaMaster gives you the option to group dimensions together. This leads to practical and content-related advantages:
- In DeltaMaster, you can open and close dimension groups just like you would drill down on a pivot table. That’s very practical because it saves room on your screen. You simply hide the attributes that you don’t need currently or show them as soon as they move into your focus.
- Grouping attributes also emphasizes the relationships among various attributes. The grouping adds ‘subheadings’ into the dimension list. This gives you a better orientation throughout your data model and is a sign for clean modeling.
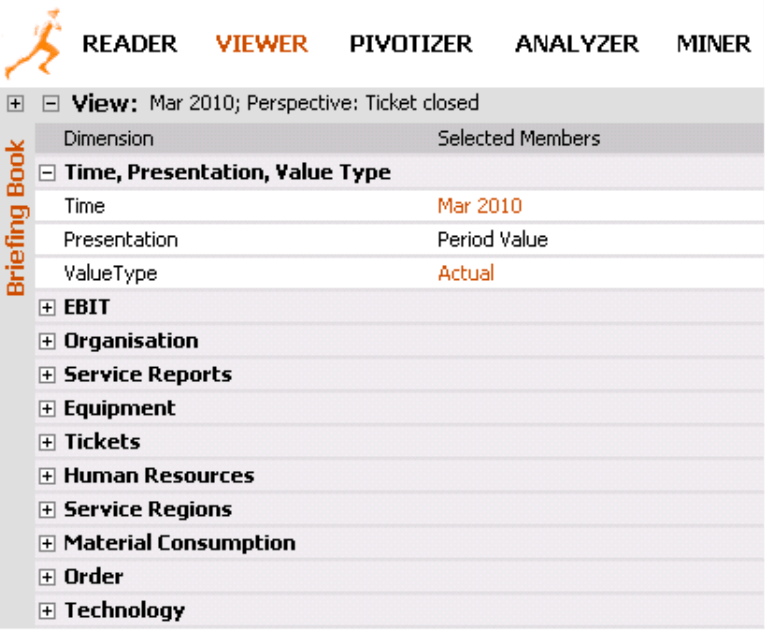
The screenshot on your right shows a service controlling data model which contains and connects many different types of content ranging from financial data to performed servies, operating reports, tickets and the installed base. The charm of this solution lies in its ability to integrate all of these different facettes. As a result, you can create very informative analyses which provide the necessary foundation for highly differentiated reporting. The model is truly multidimensional. You can select almost 100 dimensions from the View window. These dimensions could fill multiple computer screens – or less than half of one if you group them logically.
Dimension groups give your model more structure and make it easier for you to access the attributes that interest you. This especially applies in the case of comprehensive applications. But even if you have no more than a handful of dimensions, you can clean up the interface significantly if you arrange them into logical groups.
Using groups
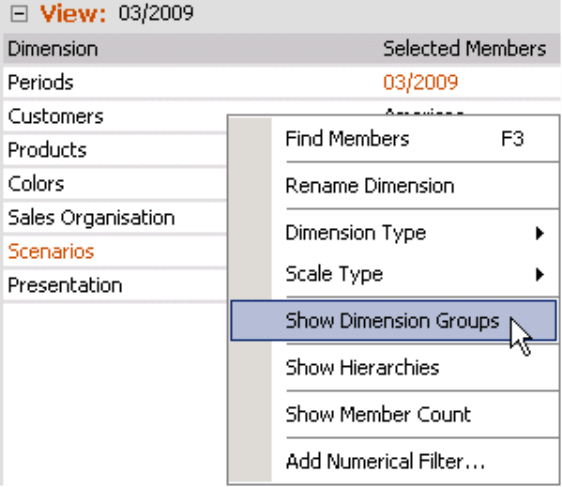
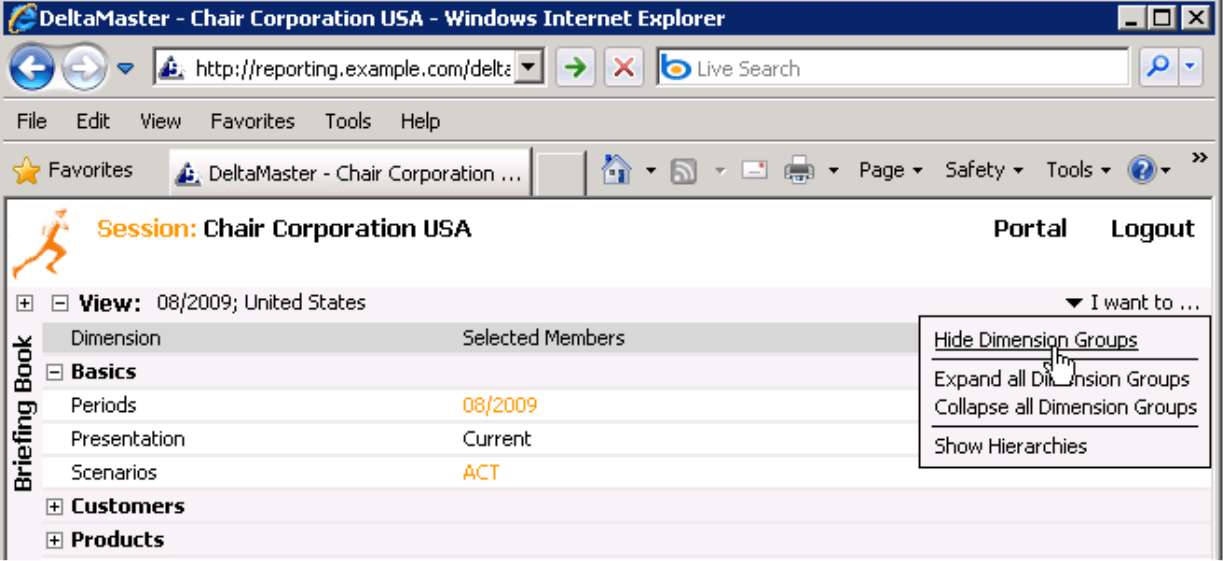
If you want to work with Dimension groups, you first need to display these in the View window (i.e. context menu or I want to… window). This display option is available starting in DeltaMaster’s Viewer mode. In the following steps, we will describe how you can edit groups; these options work in Pivotizer mode or higher.
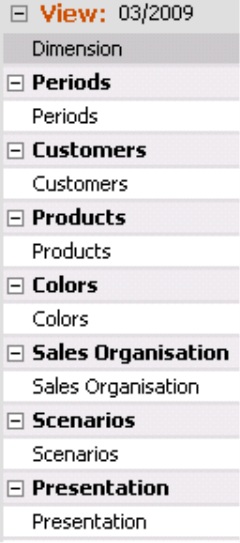
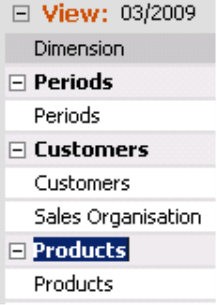
When you Show dimension groups for the first time in your application, DeltaMaster will first create a group for each dimension. In the ‘Chair’ reference model, therefore, you would first start with seven groups as you can see in the screenshot on your right. The group’s name is listed on a gray bar in bold type, similar to a headline.
If you now press and hold the Alt key, you can drag and drop the dimensions from one group into another.
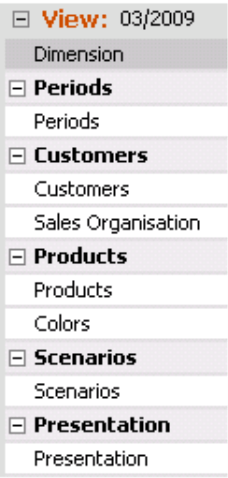
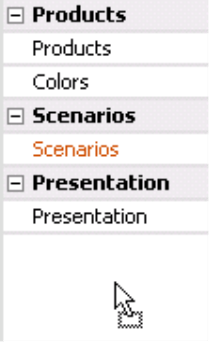
In this example, you could combine the sales-related attributes ‘Customers’ and ‘Sales organization’ into one group and the product-related attributes ‘Products’ and ‘Colors’ into another. As you can see in the screenshot on your right, DeltaMaster will automatically remove any group that contains no dimensions. This makes your list shorter.
To change the name of a group, simply double click on its name. As with all objects created with DeltaMaster, you can also create group names in multiple languages (Model menu, Model browser, Alias sets tab).
To create a new dimension group, press and hold the Alt key, drag the dimension that should be organized in a new group and drop it below the last listed dimension.
To open or close all dimension groups at once, simply select the respective option from the context menu or the I want to… menu. Alternatively, simply press and hold the Shift key while clicking on the plus or minus sign. This same trick also works for the folders of your Briefing book or the measure groups in the Measure browser.
Sorting dimensions and dimension groups
When you hold the Alt key, you can also change the order of dimensions or dimension groups by dragging and dropping them into the desired position. We recommend that you place heavily used dimensions or dimension groups (e.g. ‘Periods’) at the very top. This has two main advantages. First of all, you can give the reports or cockpits that are categorized under the View window more height without having to scroll through the View. Secondly, DeltaMaster automatically suggests the first dimension of the dimension list in many situations, for example, when you create a new pivot table. If this is the dimension that you need the most in reports and analyses, you save time because you can simply keep the dimension that the system recommends.
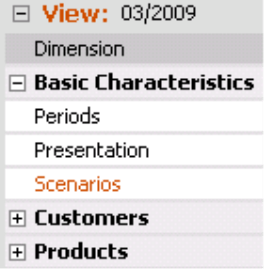
Many users organize general attributes such as ‘Periods’ (e.g. months, years), ‘Presentation’ (e.g. previous year or variance to the previous year) and ‘Scenarios’ (e.g. budget, actual, or budget/actual variance) into a group called ‘Basic characteristics’ and place it at the top of the View window.
Dimension groups are saved in the analysis session. These groups even remain intact if you later hide them using the options in the context menu or the I want to… menu.
Dimension groups in Viewer
You can edit dimension groups in the Pivotizer, Analyzer, and Miner modes of DeltaMaster. Viewer users can see but not change these groups. If the user is not allowed to select from at least one dimension per group, the group will not appear on the screen. You can determine these selection limitations for Viewer mode in the View context (context menu of a report in the briefing book, Report properties).
DeltaMaster’s WebClient will treat your settings in the same way and allows to hide or show the dimension groups.
Questions? Comments?
Just contact your Bissantz team for more information.
