![]()
Greetings, fellow data analysts!
Back in a February 2007 blog entry on “Me, Myself and BI”, Dr. Nicolas Bissantz explained why he hopes that OLAP is a 10 year workaround. Although it is still too early to take stock, you can at least avoid this workaround in certain situations as of February’s DeltaMaster 5.4.3 release. Now, you can create DeltaMaster analysis models that directly access relational databases – in other words, tables instead of cubes – without OLAP.
Of course, we can’t (and wouldn’t want to) completely forgo this technology any time soon. When working with large volumes of data, OLAP is still the better choice because it uses precalculation to improve the query speed. Plus, OLAP modeling and analysis follow a very similar logic. Sometimes, however, these aspects aren’t so important. And when you don’t have an OLAP expert on hand, you know how valuable it is when you can take matters into your own hands. We want solutions – not workarounds. And DeltaMaster is definitely a solution.
Best regards,
Your Bissantz & Company Team
As of version 5.4.3, DeltaMaster can access the information stored in purely relational databases – without having to convert it into an OLAP cube first. As a result, you can work directly with information stored in a Microsoft Excel spreadsheet, an Access database, or any ODBC or OLE DB data source.
This feature really comes in handy when you need to spontaneously analyze external data that you received from a supplier, customer, consultant, or market research institute, downloaded from the Internet or another source, or otherwise doesn’t stem from a standardized and automated transfer process. In addition, when you are creating and prototyping new OLAP applications, examining your data relationally in advance is often a great help. This way, you can see if something is missing or if certain values seem abnormally small or large.
DeltaMaster offers many different options to work with relational data. We will use an example to ease your start into the world of relational analysis and reporting.
Sample data from the entire world
Instead of using the usual data from our ‘Chair’ model, this time we have intentionally chosen an external source – the Demographic Yearbook of the United Nations Statistics Division. This source primarily contains demographic information [e.g. population (in thousands)] about every country in the world. The UN offers this data in various formats including Excel spreadsheets so that users can easily transfer them into their own applications. For this example we have used the ‘current’ 2007 edition. (The typical update cycles of Business Intelligence applications are an unattainable dream for most official statistics.)
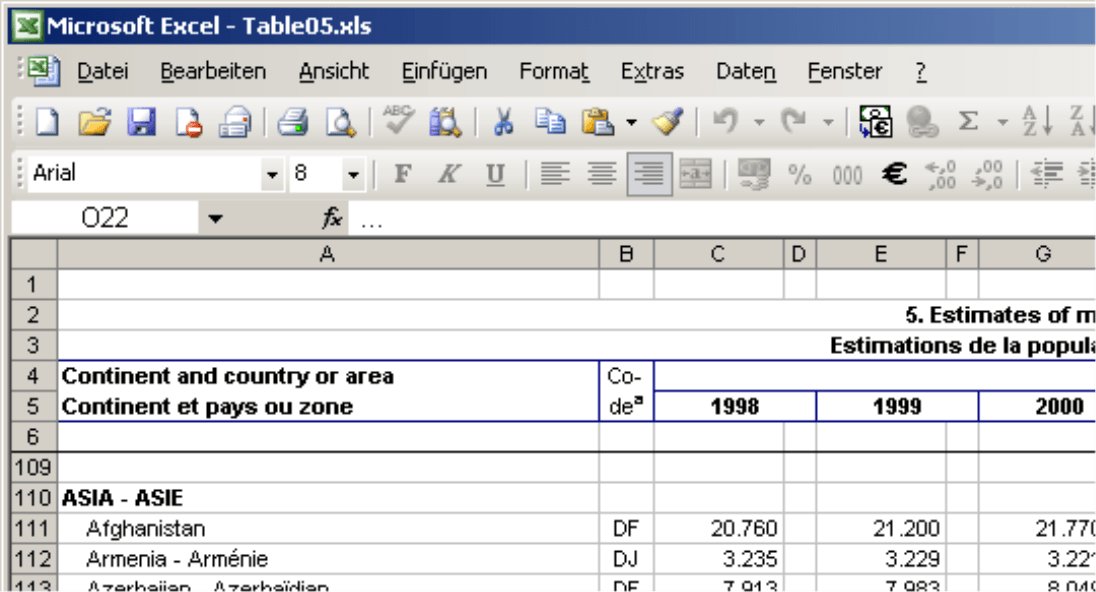
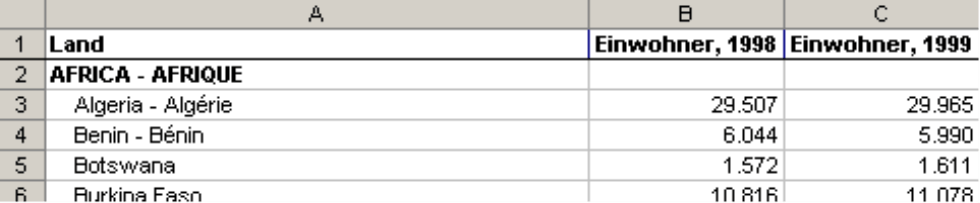
Before you process this file with DeltaMaster, you probably will want to make a few changes. It makes sense, for example, to delete some of the content such as headline rows or columns that were added for spacing reasons. This formatting not only makes it difficult for DeltaMaster to read the file, it also gets in the way when you are creating analytical applications.
Here, you can also see one of the basic problems with analytical applications that are based on spreadsheets. They crudely mix data storage, calculation logic and visualization elements. Since the data is so tightly interweaved with its positioning and formatting, examining it from even a slightly different angle is very difficult.Fortunately in this case, cleaning up the data isn’t too hard because the format of these statistics was kept simple. So let’s take a closer look at this file – with DeltaMaster!
Creating relational analysis models
To tap a relational data source, simply create a New analysis model (Portal or File menu) as you normally would in Miner mode. As of DeltaMaster 5.4.3, you can select in this first step if you want to access an OLAP or a relational database. (This dialog box will only appear if you have a license to use this feature, as we will explain at the end of this edition of clicks!. If you would like a test license, we will gladly send you one.)
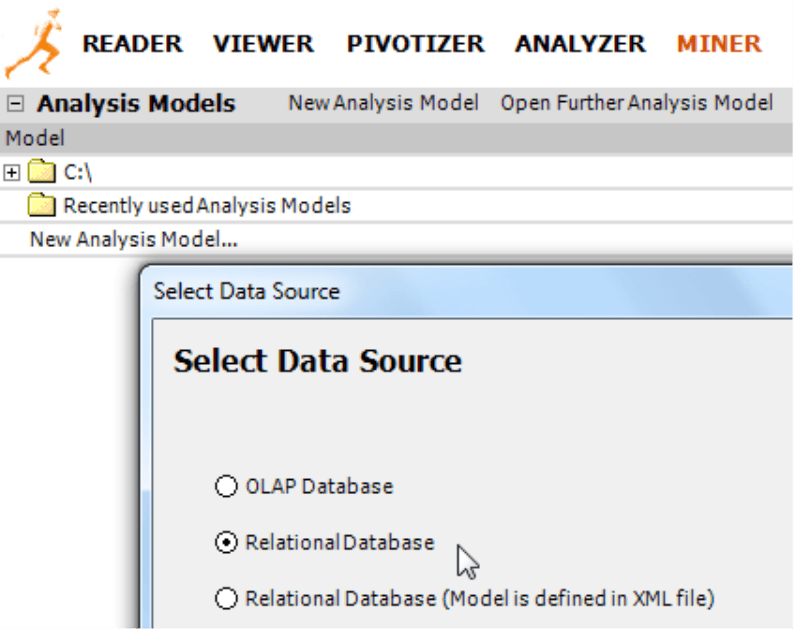
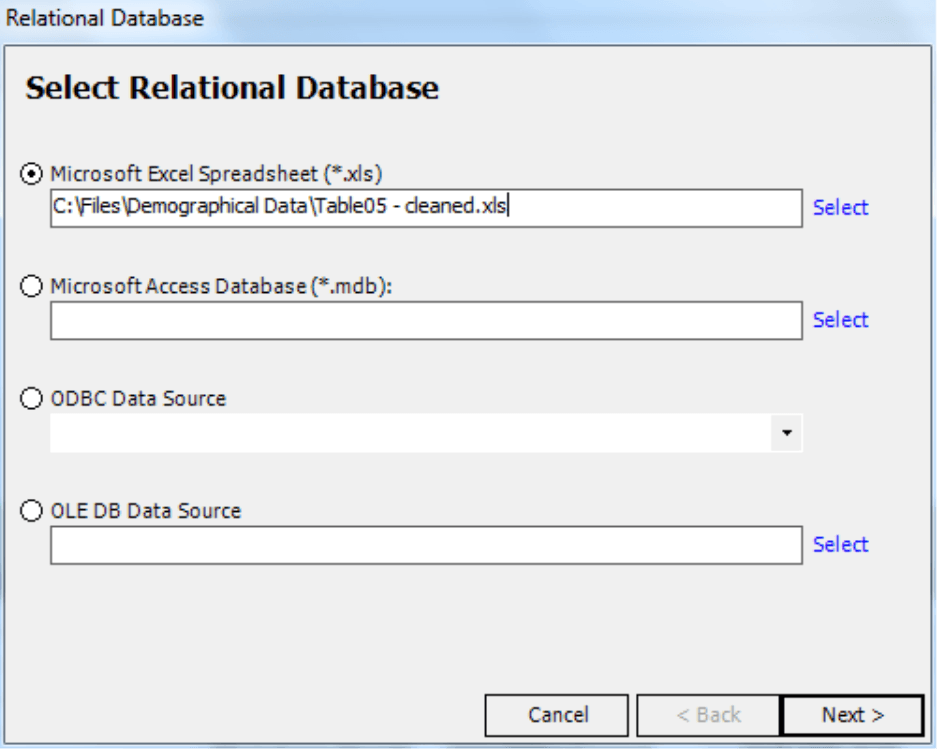
If you select Relational database, DeltaMaster will ask which type of database you would like to use in the next step. Here, you can choose from Excel and Access files (i.e. .xls or .mdb) as well as ODBC and OLE DB data sources.
The ODBC interface opens the door to many other systems. Almost all databases on the market – including DB2, Informix, FileMaker, FoxPro, MaxDB, MySQL, Oracle, PostgreSQL, Teradata, as well as Lotus Notes or other application programs – offer an ODBC interface. And now you can immediately access these and many other systems without first needing to create an OLAP model. In this example, however, you will be working with Excel – so choose the first option and Select the respective spreadsheet.
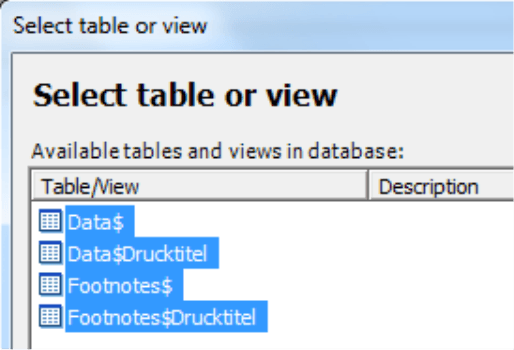
DeltaMaster will now open the file and display the available worksheets. You may now pick one or more tables. If you selected a database such as Microsoft Access instead, this view would then show the different tables and views.
And that’s it! DeltaMaster will now display every worksheet, table and view as a new cockpit.
If DeltaMaster shows the warning ‘The connection to Microsoft Excel to show the linked worksheet has been closed’ instead of the table, the file is probably still open in Excel. Please close the file so that DeltaMaster has exclusive Access.
Even though this table is displayed in the same window as a pivot table, please do not mistake it for one. It is actually a fact table which you can use to create and maintain your relational analysis model. To report and analyze this data, you simply use your regular tools (e.g. pivot tables, sparklines, hyperbrowser, analytical methods) on the structures that you have created from the cockpits based on relational tables and views
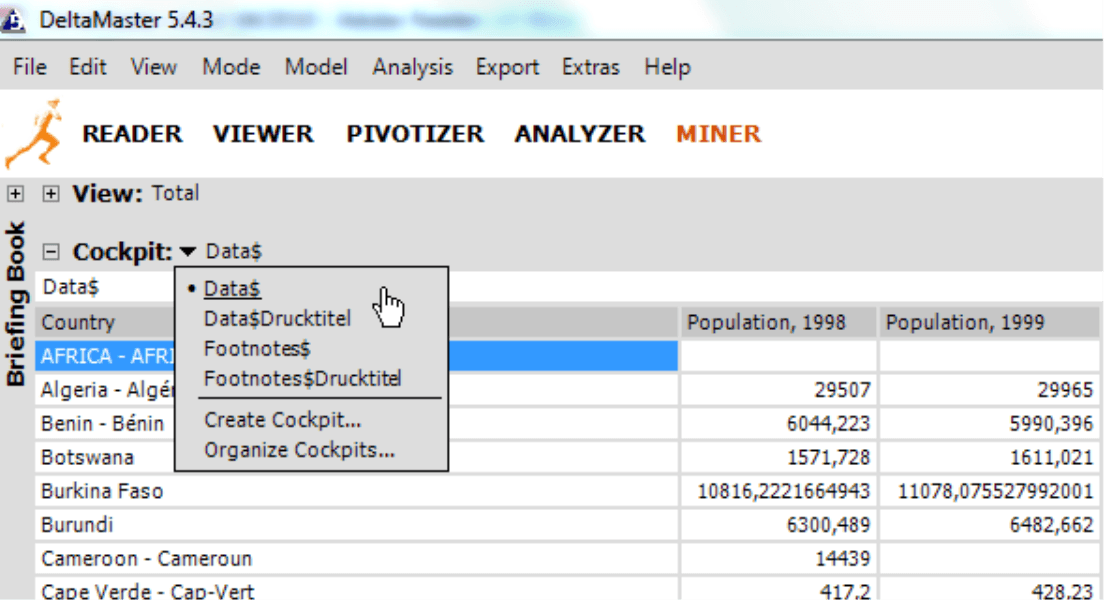
These structures are still missing in our sample application for global demographics. As you can see in the screenshot above, DeltaMaster does not yet know about any dimension. But since you need dimensions to create pivot tables and calculate analyses, we will just build them ad hoc.
Creating relational analysis models
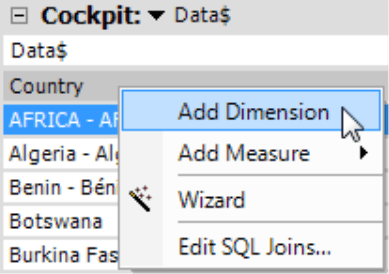
To Add dimension[s], simply choose the respective command in the context menu of the column header. DeltaMaster will then create a dimension that acts like one in an OLAP model.
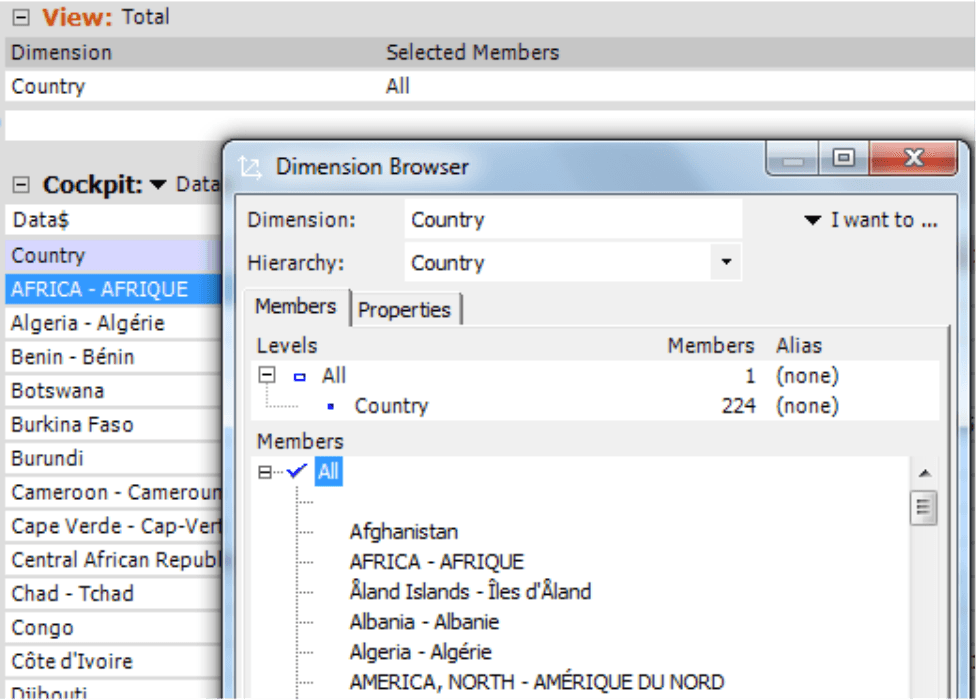
DeltaMaster will immediately display the new dimension in the View window and you can access the members using the same dimension browser. DeltaMaster will also display the column header in fact table in blue color to show that this column is used as a dimension.
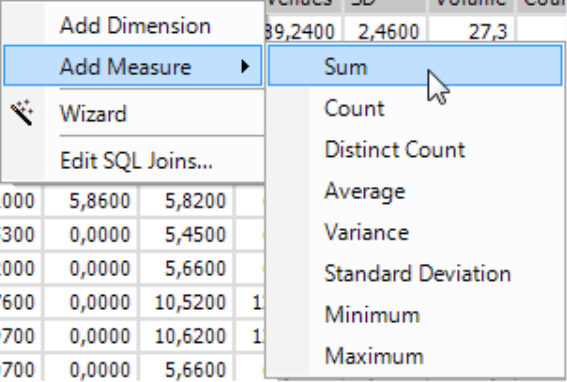
What we now need are measures, which you can also create using the function in the context menu of the column headers.
If you create a Measure, you will need to define its aggregation function just as you would in OLAP databases. The most common function is a Sum. The green coloring shows that this column is used as a measure.
As a side note, all of these modeling steps and changes will have no effect on your underlying database or file.
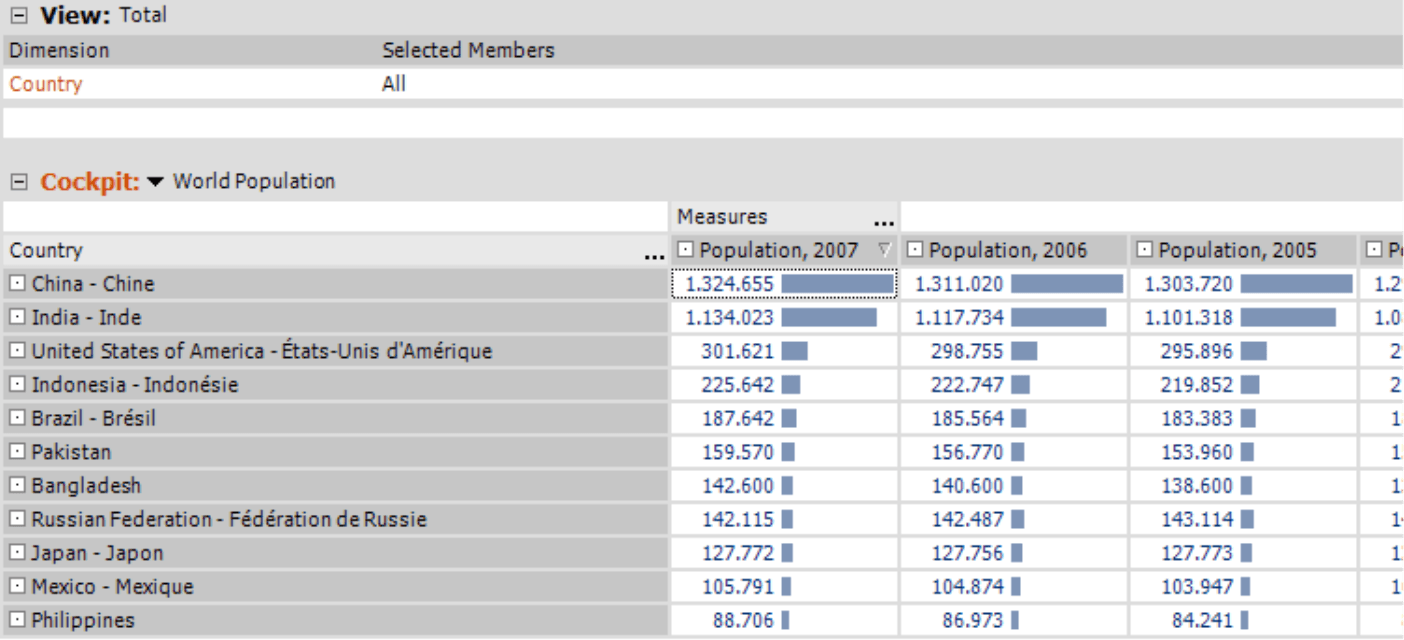
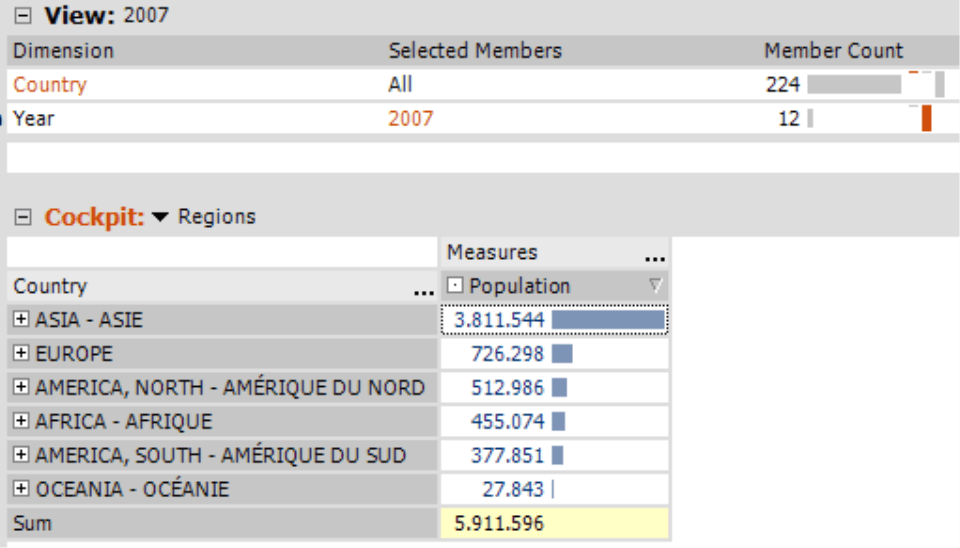
Once you have created dimensions and measures, you can use many (but not all) of the functions that you already know from working with OLAP databases. This includes generating pivot tables…
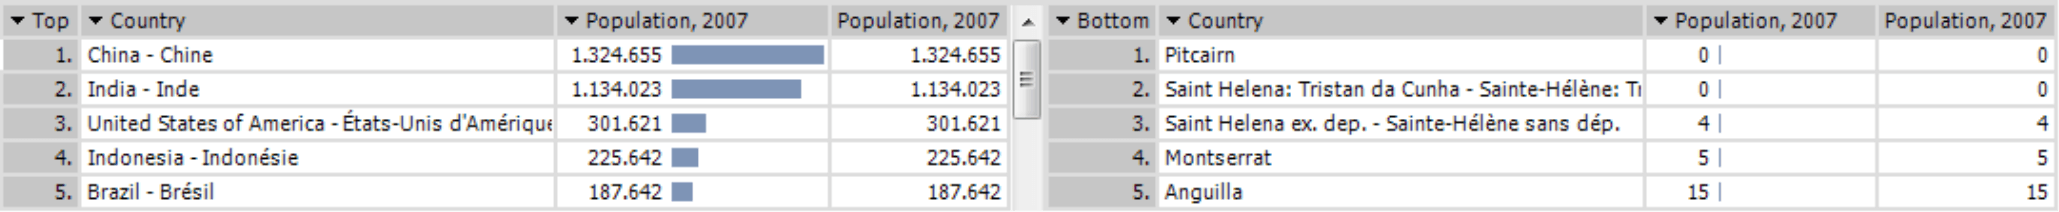
calculating rankings …
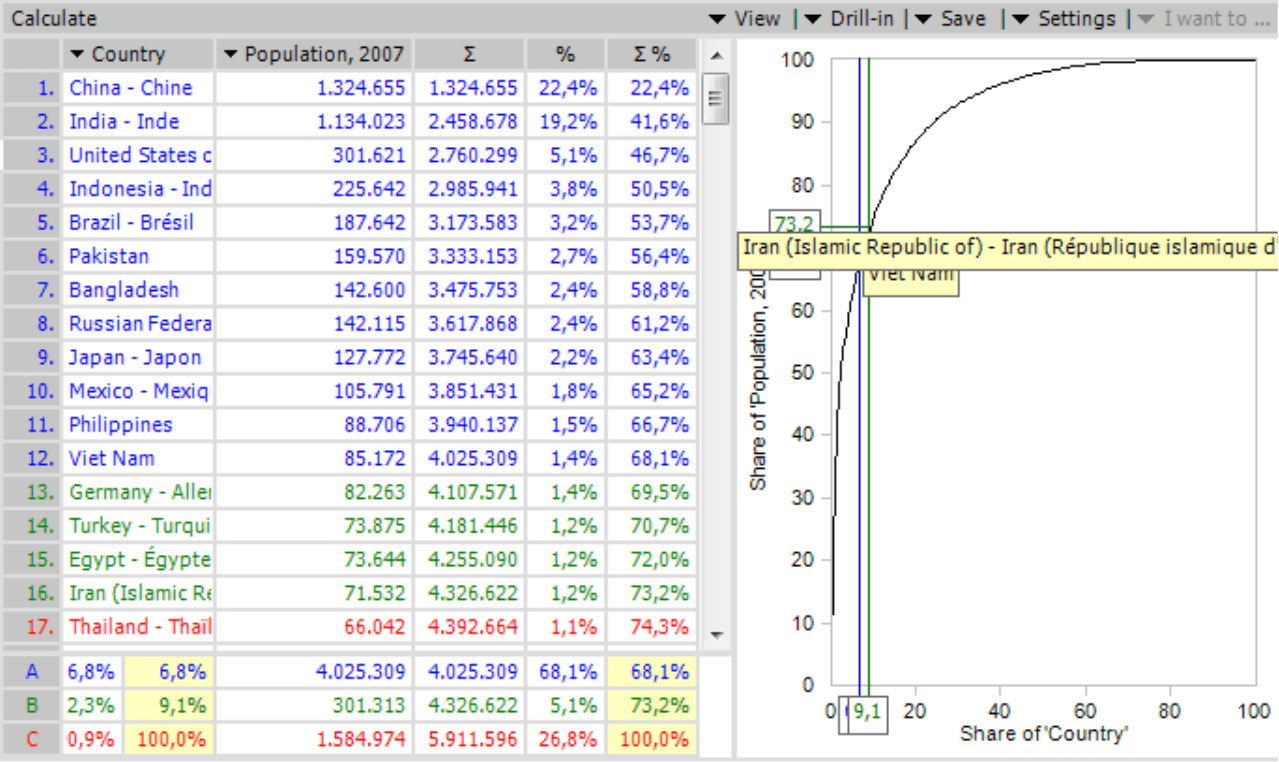
or creating a concentration analysis. Everyone knows, for example, that China and India are much larger than other countries. But did you know they and the next 9 largest counties comprise over two thirds of the total global population?
Fine tuning relational analysis models
As an experienced DeltaMaster user, the example above probably made your fingers itch. Creating a separate measure for each year isn’t exactly a best practice and can turn out to be pretty awkward in further analysis and reports. The same guidelines that apply in OLAP also apply in relational applications. There are many different ways to model the same data – and some are better than others.
Of course, we don’t want carry our example of ‘modeling’ an Excel spreadsheet too far. With a few small changes, however, you can make the model much more flexible and elegant – and the better visualization and analysis options make up for any additional effort on your part.
In this example, we would make two main suggestions:
- In the original source, the population figures for each year are located in a separate column. You should change this to reflect good OLAP practices – namely, one column for ‘Year’ and one for ‘Population’.
- The regions (i.e. continents) are listed as headlines in the Excel spreadsheet. As a result, countries are only connected to a region based on the position in the table – and not on information in the row itself. By adding an additional column that contains the headline, you can now create a hierarchy.
The following screenshots show how these changes affect the Excel table.
Instead of being a flat list, the countries are now shown as a hierarchy. As a result, you can now drill down on a continent to view the individual countries in pivot tables.
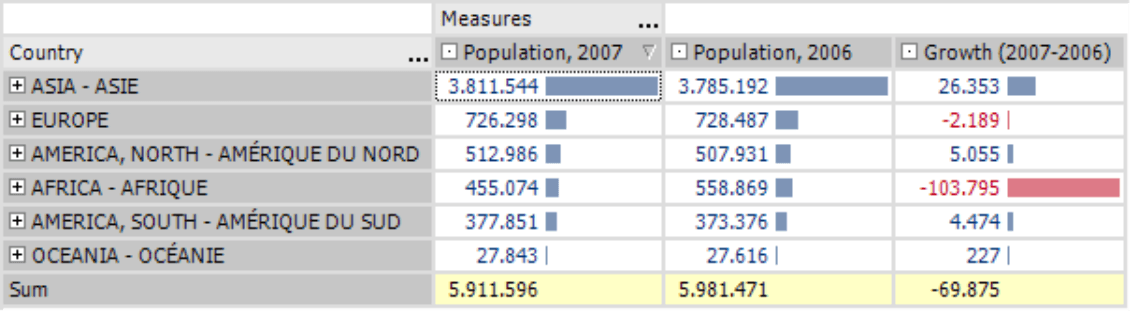
Using individual measures such as Quotient measures, Filter measures and User-defined measures in SQL (instead of MDX), you can add the necessary calculation rules to your data model. This way, you can calculate the growth rate as shown in the screenshot on your right.
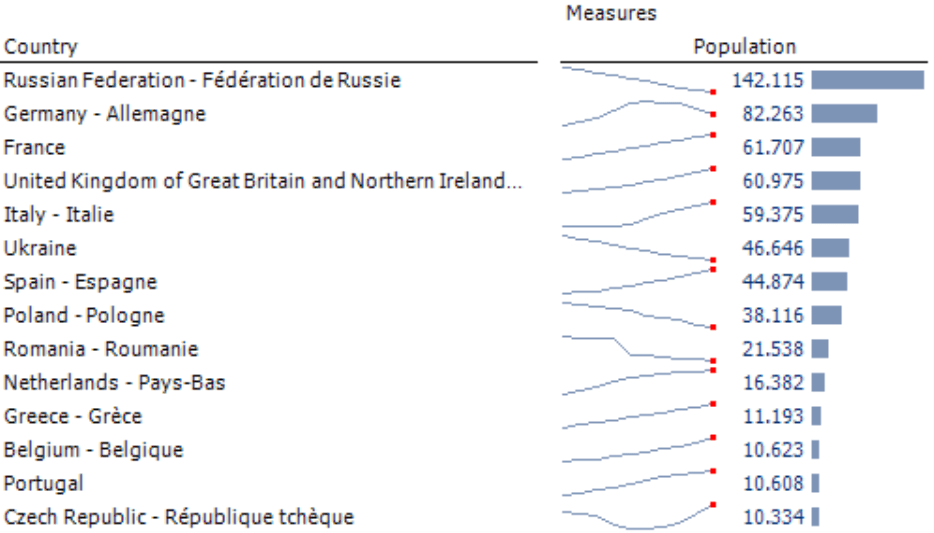
The relational analysis models in DeltaMaster currently do not support calculated members or time calculated members. You can, however, create a separate ‘Time’ dimension – and even integrate sparklines. In the screenshot on your right these sparklines use a linear scale showing the minimum and maximum values for the years 1998 – 2007. The population figures, again, are displayed in thousands.
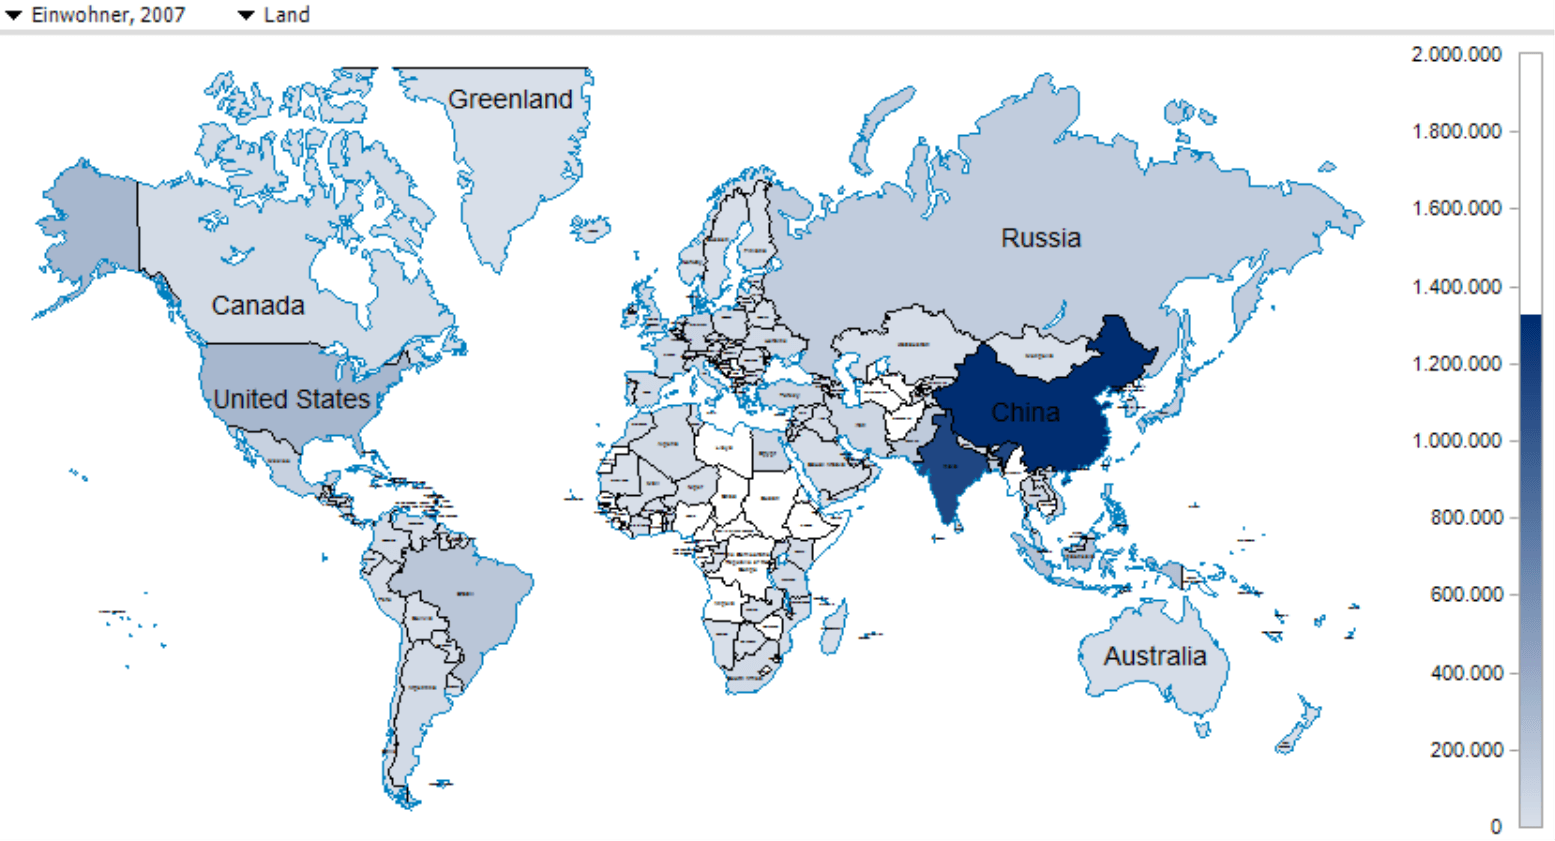
And if you add another column for the country codes, you can project your measures on maps using the Geo analysis function.
OLAP (optional)
If desired, you can also create an OLAP database (Model menu) based on your relational analysis. This conversion is performed by the ImportWizard, a product of ours that we previously offered as a separate product. We have completely redeveloped this tool and integrated it into DeltaMaster 5.4.3. The most important changes compared to the previous version are:
- The full integration into the DeltaMaster user interface and installation package
- The creation of cube files and server databases in Microsoft Analysis Services 2005/2008
You can still use this tool to create cube files for Microsoft Analysis Services 2000. However, you can no longer create server databases in Analysis Services 2000 or Infor PM OLAP (MIS Alea).
You can also continue to use your model as a purely relational application – without needing OLAP. In this case, simply save it as usual – either an analysis model (.dam file) or an analysis session (.das).
Licensing
If you want to create and change relational analysis models, you need a valid license for DeltaMaster ImportWizard 5.4.3 or DeltaMaster Modeler. If you would like to test this functionality, we will gladly send you a free evaluation license. Simply call us or send a short e-mail to support@bissantz.com.
Questions? Comments?
Just contact your Bissantz team for more information.
