![]()
Greetings, fellow data analysts!
“Show what is different – immediately.” This is rule #18 from Bella’s new book, which explains the proper way to use data and graphics (in German, available at www.bella-buch.de). In other words, what interests us the most – whether in reporting or our daily lives – is the difference or variance. As a result, we should strive to show these changes first so that our readers can spot them immediately.
Using graphical tables, we can show and even measure what is different in a very simple, elegant way. And with DeltaMaster we can choose from many different visualization options including difference bars or columns, a new feature which has been especially designed to show differences. Difference bars or columns show experienced users of graphical tables the influence of variances in a data constellation. In this edition of clicks!, we’ll explain how to use this feature as well as other available alternatives.
Best regards,
Your Bissantz & Company Team
Where have variances or changes occurred? What were their causes? These are everyday questions for management accountants and controllers. And as you already know, DeltaMaster offers a wide range of tools – simple rankings, sophisticated data mining methods, and intelligent combinations of the two (pivot navigation, see DeltaMaster clicks! 10/2007 for more information) – to help you find the answers. In most cases, the starting point for detailed analysis is a report showing variances or changes. From here, users can decide if they want to investigate any interesting details or simply accept the variance without further investigation.
DeltaMaster offers many different options for visualizing variances. In this edition of clicks!, we will introduce Difference bars and columns, two new visualization options that are have become popular among many of users, and compare them with instruments that you have probably known from DeltaMaster for years. You can use the options described below in Pivotizer level or higher. In addition, each one refers to graphical tables; we won’t get into pivot charts (i.e. business charts) which are difficult to automate at this point in time. For simplicity reasons, we also will not differentiate between the terms ‘variance’ (e.g. difference between budget and actuals) and ‘changes’ (difference over time). We simply want to focus on the differences in values and will use these terms loosely as synonyms.
Let’s take a look…
As of version 5.4.3, DeltaMaster now offers Difference bars and columns as presentation options for pivot tables. Since the options for bars and columns are identical, we will only refer to bars in the following descriptions. You can view an example of Difference bars in the screenshot on your right. By the way, Dr. Rolf Hichert also suggests using this type of visualization in his seminars.
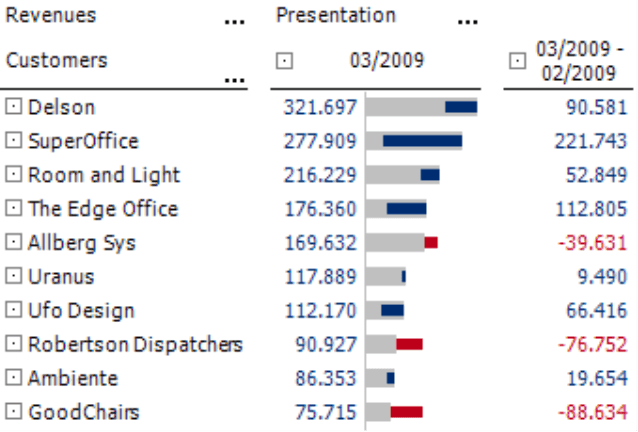
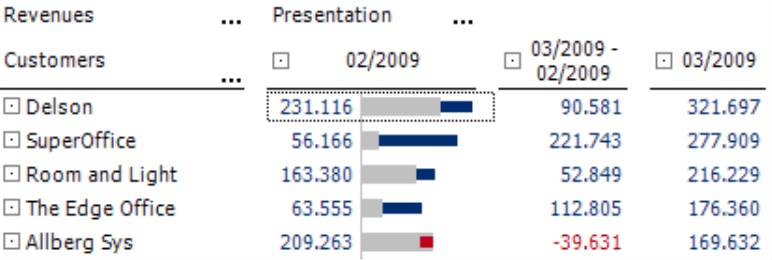
The table on your right compares customer revenues over time. The first column, which is visualized as the gray bar, shows the revenues for the current month. The second column shows the variance in comparison to the previous month. This variance is shown in the first column as a difference bar (blue stands for an improvement while red shows a decline over the previous month) placed above the gray bar.
To explain this visualization in more detail, let’s look at the enlarged section of the screenshot on your right. The gray bar from ‘The Edge Office’ represents the revenues for this customer in the current month. In addition to listing this value as a number (176,360), DeltaMaster also shows the difference (112,805) and visualizes this as the blue offset piece in the gray bar. Although the value of the previous month is not listed, it is displayed graphically as the piece from the beginning of the gray bar to the beginning of the blue one (63,555 = 176,360 – 112,085). The blue difference bar, therefore, shows how much the ‘initial’ piece has grown until it has reached the length of the current value.
![]()
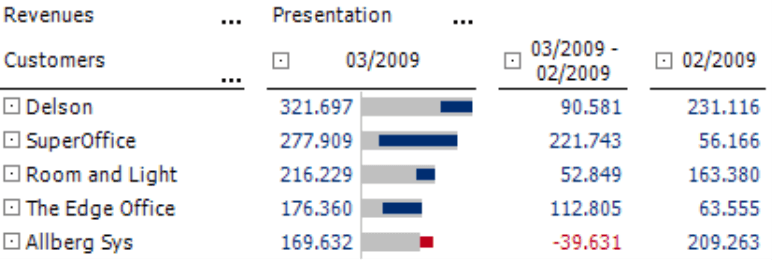
Revenues for ‘Allberg Sys’, however, have dropped. Once again, the gray bar shows the value of the current month (169,632). The red offset piece shows the difference in revenues over the past month
(-39,631). The value of the previous month equals the distance from the start of the gray bar to the end of the red one.
Want more?
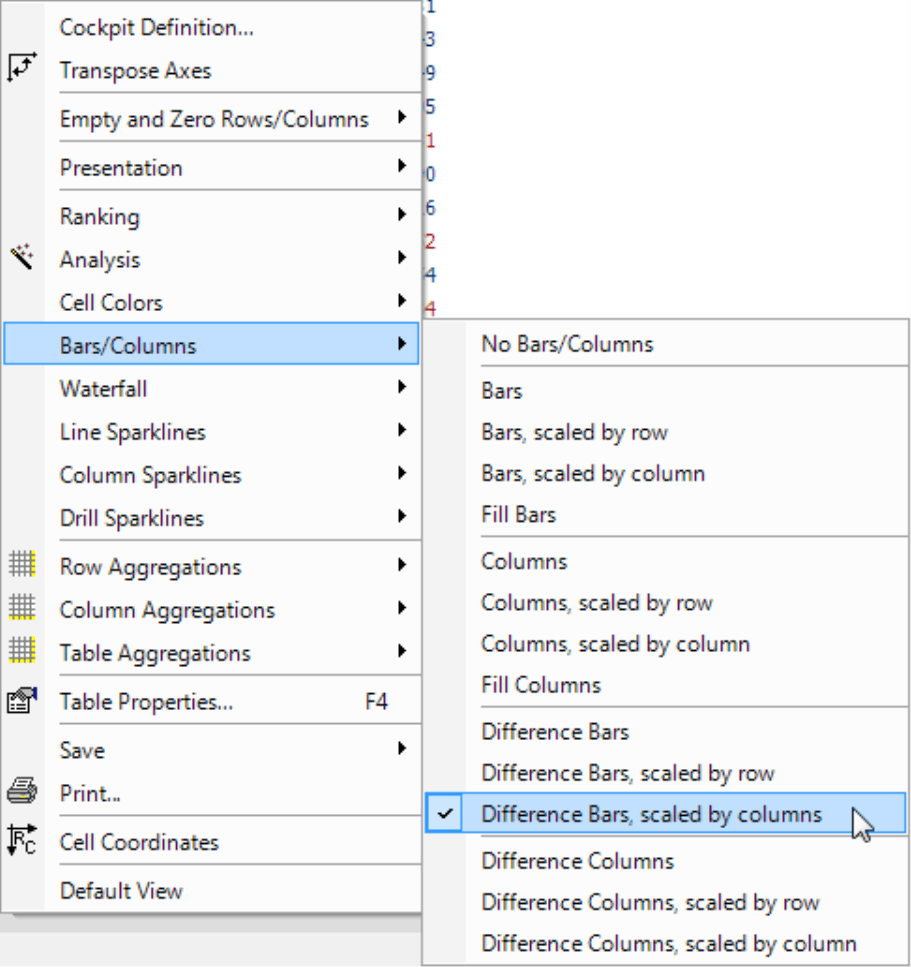
You can display difference bars and columns in pivot tables starting in Pivotizer mode using the respective options in the context menu. As with other graphical elements, you can decide which scale you would like to use: one that uses the same scale throughout the entire table (displayed in the option without additional text) or one in which the scale varies by row or by column.
When you activate difference bars for the first time, you will probably only see a gray bar without any red or blue offset pieces showing the differences. In contrast to all other graphical elements, difference bars require additional parameterization.
DeltaMaster assumes that the columns/rows stand in a certain relation to each other. The visualization requires a main value (in our example, the revenues for the current month) as well as one or more difference values (not percentages) that are located in columns or rows directly behind it.
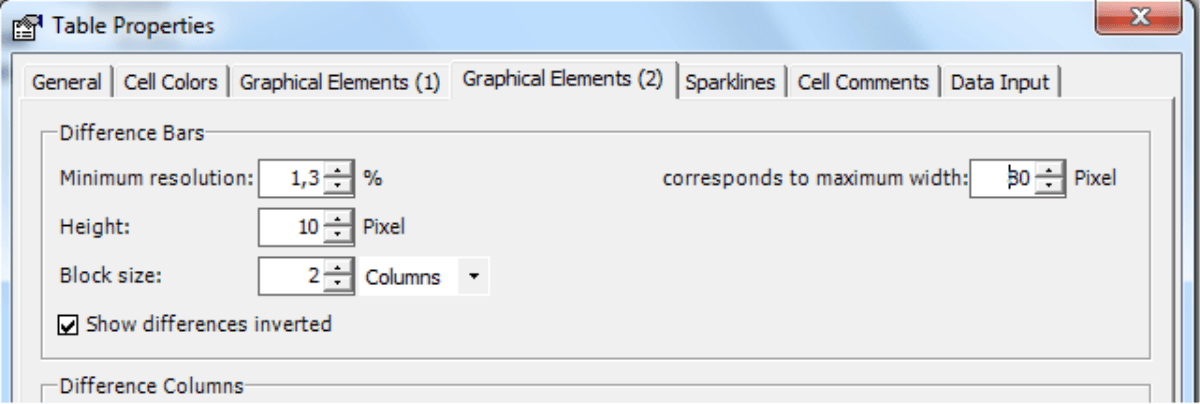
To set the parameters, go to the Table properties of the pivot table (context menu, I want to… menu or F4 key) under the Graphical elements (2) tab.
Creating blocks
The most important setting here is the Block size. This determines how many columns or rows DeltaMaster should take into account and draw as difference bars. Using this visualization technique, you can also present more than one difference value. This option, however, is for very special data constellations. In most cases, you will probably only need a Block size of 2.
DeltaMaster always interprets the first column or row as the starting value and draws it as a gray bar. The following columns and rows deliver the data for the visualization in the first column/row; as a result, DeltaMaster will not draw anything in them. DeltaMaster interprets these as absolute differences in comparison to the value in the first column/row and displays them as red or blue offset pieces. As a result, if the Block size is set to 1, you will only see gray bars. Each column or row is its own block and has a starting value but not a difference value.
To invert or not to invert – that is the question.
In this example, we have activated the Show differences inverted option (see previous screenshot showing the Table properties). As a result, DeltaMaster drew the ‘blue’ growth to the left of the right end of the ‘gray’ starting value and the ‘red’ drop in growth to the right of it. This corresponds with a column order that shows the current value (i.e. actual) followed by the variance and the comparative value (e.g. previous period or budget) – as in the screenshot. In this visualization, therefore, a positive difference is placed in the gray bar.
If you don’t choose the Inverting option, the exact opposite occurs; DeltaMaster will draw positive differences to the right and negative ones to the left from the same place. This is the equivalent to a column order that shows the comparative value (e.g. previous period or budget) first followed by the variance and current value (i.e. actual).
Bars for differences instead of difference bars
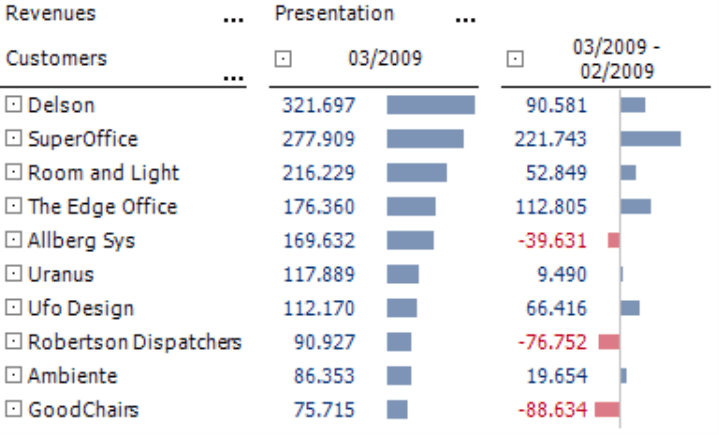
You can certainly also use other well-proven features in DeltaMaster to visualize the same data in a slightly different manner, for example by activating the Show bars option in the context menu. Together with the Notation (Model menu, see DeltaMaster clicks! 8/2009), you can create a visualization like the one below without needing to set any additional parameters.
One value, one graphical element – that is easy to understand without any further explanation.
And which visualization option is best? As in so many cases, it depends on the underlying data and the intended message.
Questions? Comments?
Just contact your Bissantz team for more information.
