![]()
Greetings, fellow data analysts!
When the ancient Babylonians invented the number 0, they turned ‘nothing’ into something tangible. Giving ‘nothing’ a name and face was a fundamental requirement for progress. After all, our numerical, decimal, and almost all denominational number systems wouldn’t work without a 0. The alternative would be to do math using tally sheets or Roman numerals – which is really difficult to say the least.
A common cliché says that the only thing that computer science needs besides a 0 is a 1. And although a ‘1’ is always unique, ‘nothing’ is not always the same, too: A missing value is completely different than a value that shows when the cash is indeed empty.
You can really philosophize over these and other variations of ‘nothing’. But we will save that for another time and place. What interests us in this edition of clicks! is how null values, the number ‘0’, and null members influence reports and analyses. You’ll see that DeltaMaster not only makes it easier to work with numbers. It is also a great help when they are missing.
Best regards,
Your Bissantz & Company Team
As we are all aware, Business Intelligence has a lot to do with numbers – and in many cases, some numbers are missing. They might not exist, for example, because you don’t have data for a customer in the years before they became one. Sometimes, too, the data is unknown because you couldn’t measure or allocate it correctly. Other times, we know the data but it equals ‘0’ (i.e. zero) because nothing has happened that you can express in numbers. In this edition of clicks!, we will briefly explain how these and other variations of ‘nothing’ are different, and how DeltaMaster makes it easier to work with them. In particular, we will explore these three different scenarios:
- There is no value in the database or it is unknown/undetermined. In database theory, these empty values are called ‘null’ to differentiate them from the number ‘0’. When we talk about ‘null’ in the following sections, we always are referring to these types of missing values.
- There is a value which equals the number ‘0’. In this edition of clicks, we will always use the Roman numeral 0 when we are referring to zero as a number to clearly differentiate it from a database null (i.e. an unknown or missing value).
- The third case is somewhat of an exception. In dimensions and hierarchies of OLAP data models, there are often one or more members that stand for objects which have either not been clearly assigned or defined. These members can often be traced back to incorrect allocations or missing descriptive attributes in the operative data. For example, if someone created a contract without documenting the customer number, branch of industry, type of service or cost center, the system cannot assign these sums to a specific dimension member. Other times, you might have incomplete data on quantities, revenues, costs or other values that you need to take into account. All of these will be categorized in dimension members called ‘not assigned’, ‘not available’, ‘n/a’, or ‘missing’. If your underlying database is well maintained, these remnants should be empty, equal 0 or carry infinitesimal values. Nevertheless, these members do exist as defaults (“dummies”). We will refer to these dimension members as Null members.
Please note: These three scenarios are completely normal and do not cause any problems in Business Intelligence systems. DeltaMaster, however, offers several options that make it easier to deal with having ‘nothing’ as values.
Cleaning up pivot tables
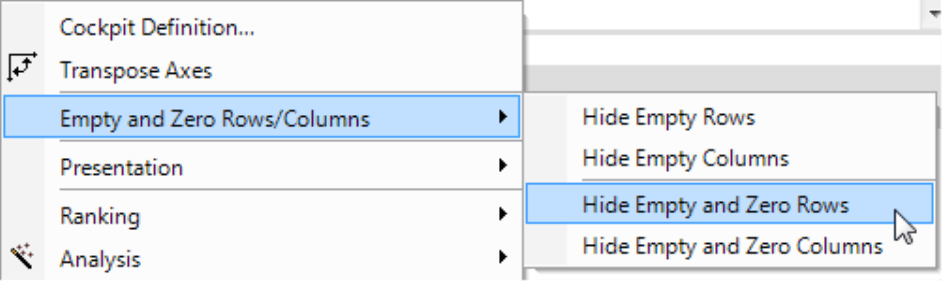
To explain null values, we will take a closer look at a sales reporting scenario because there are many times that you either have no numbers or simply don’t know them. After all, every customer of yours doesn’t buy each of your products in all variations every day of the year. As a result, sales statistics often contain many empty spaces. Sometimes, these are just what you want to analyze. In standard reporting, however, you will probably want to concentrate on the areas in which something has happened. That’s why you can either Hide empty rows and/or columns in every user level of DeltaMaster from Offline reader to Miner. Simply choose the respective option in the context menu or the I want to… menu.
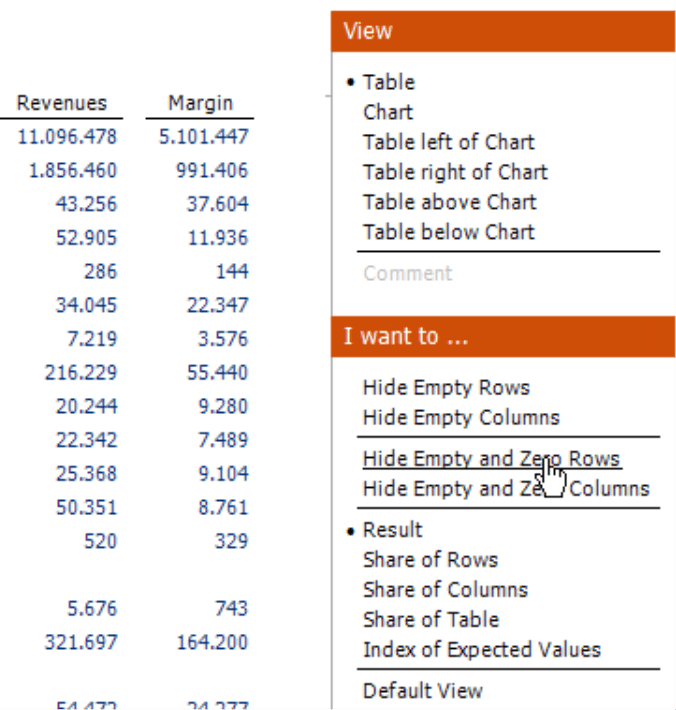
You can also use this option in the presentation mode to quickly clean up your computer or projection screen (F5 key; context menu or move your mouse to the right corner of the screen).
When you want to hide empty cells, DeltaMaster will differentiate between a null and 0. A row or column is considered empty if it doesn’t contain a value (i.e. null). If it is 0, however, DeltaMaster will not hide the row or column. Alternatively, you can opt to hide the rows or columns that contain nulls or zeros. As a result, DeltaMaster will suppress any rows without a value even if the underlying data source does not differentiate between a null and a 0 (some systems designate missing values with a 0 and not a null).
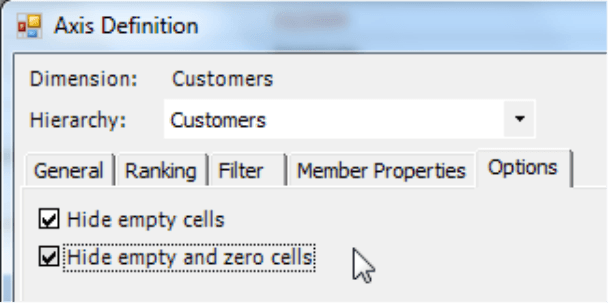
You can also find these same options in the Axis definition. Since these do not apply only to the current report state but all hierarchies of the axis, DeltaMaster will display or hide the empty cells as you wish even when you change into a parallel hierarchy afterwards.
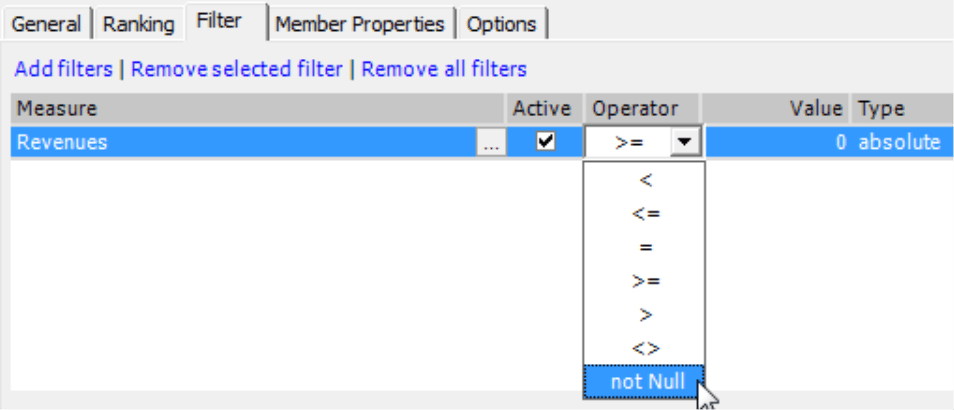
Another way to remove members with null or 0 values in pivot tables is to use the Filters in your Axis definition. You simply use numerical criteria or member properties to determine what DeltaMaster should display in your report. One of the operators is a ‘not null’ option. If you want to suppress 0’s, simply use the ‘<>’ operator and enter ‘0’ for the absolute value.
Writing nulls
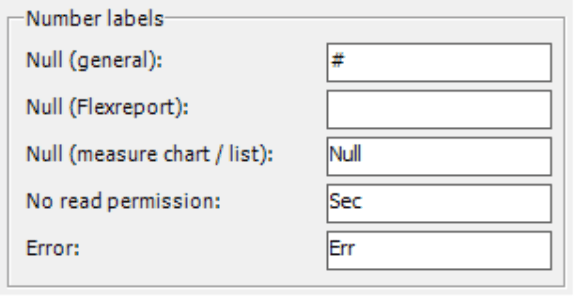
You can define how you want DeltaMaster to display null values in the Extras menu under Options on the Presentation tab. If you want to display a missing value as an empty cell, simply leave the field under Options empty. If you wish, however, you could also display a special character or term to explicitly state when a value is missing. This setting is valid for the current analysis session (i.e. .das file).
DeltaMaster presents a 0 just as it would any normal value. In other words, it uses the defined formatting options for measures and calculated members. If by some chance you wish to use custom formatting to highlight 0’s, you can use the conditional formatting options as described in DeltaMaster clicks! 2/2008. Please refer to this issue for more information on how to apply individual formats to positive, negative and 0 values using .NET character strings.
Null, 0 and filters in the hyperbrowser
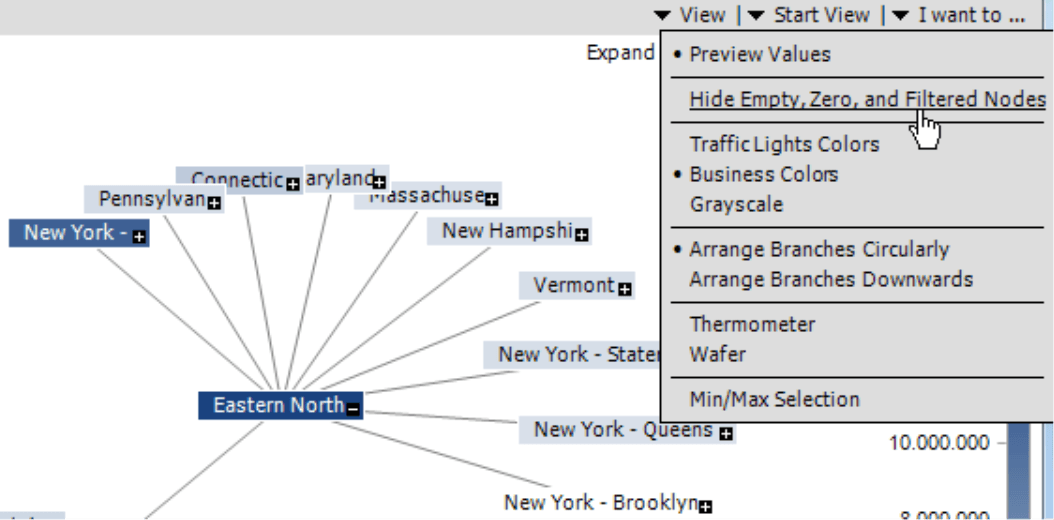
You can use a similar option to clean up your hyperbrowser. As soon as you use a measure to color the tree, you can Hide empty, 0 and filtered nodes from the I want to… menu. In addition to null and 0 values, this also accounts for numerical Filters which you can define in the upper-right hand corner of the window.
Null values in movement analysis
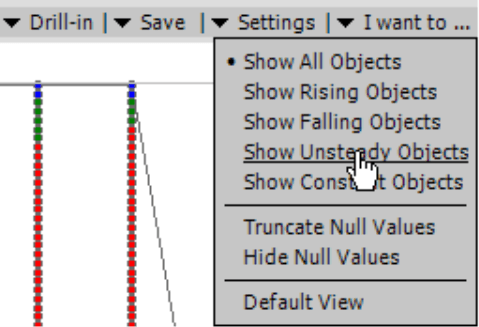
In a movement analysis, DeltaMaster uses null values to analyze the its results. This analytic method shows concentration analyses in chronological order so that you can identify rising, falling, and unsteady objects, e.g. which are ones that have moved up or down or have had at least one null value in the given time frame. This is a good example how you can use ‘nothing’ to automatically analyze and interpret your data.
Counting nulls in statistical measures
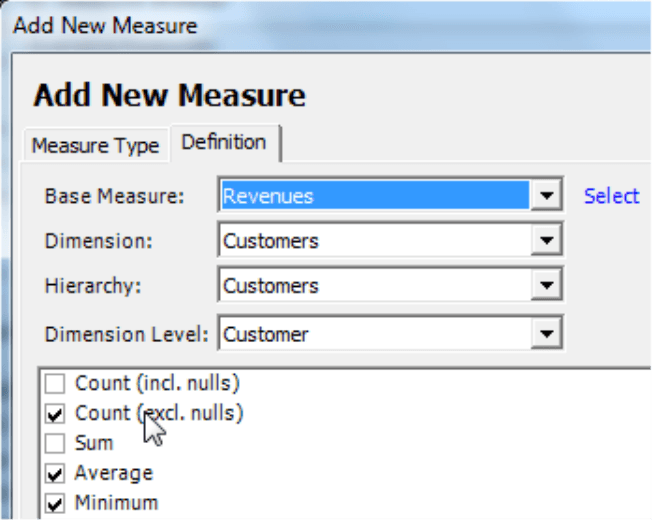
Sometimes you need to count the number of members, for example, to calculate averages. In this case, you have to decide if DeltaMaster should include the objects with missing values or not. You can choose either of these options in the wizard for creating Univariate statistical measures (see DeltaMaster clicks! 7/2009 for more information). As described at the beginning of this issue, Null values stand for missing values in the database. Zero values will be counted in both functions. The option Average ignores nulls but counts 0’s.
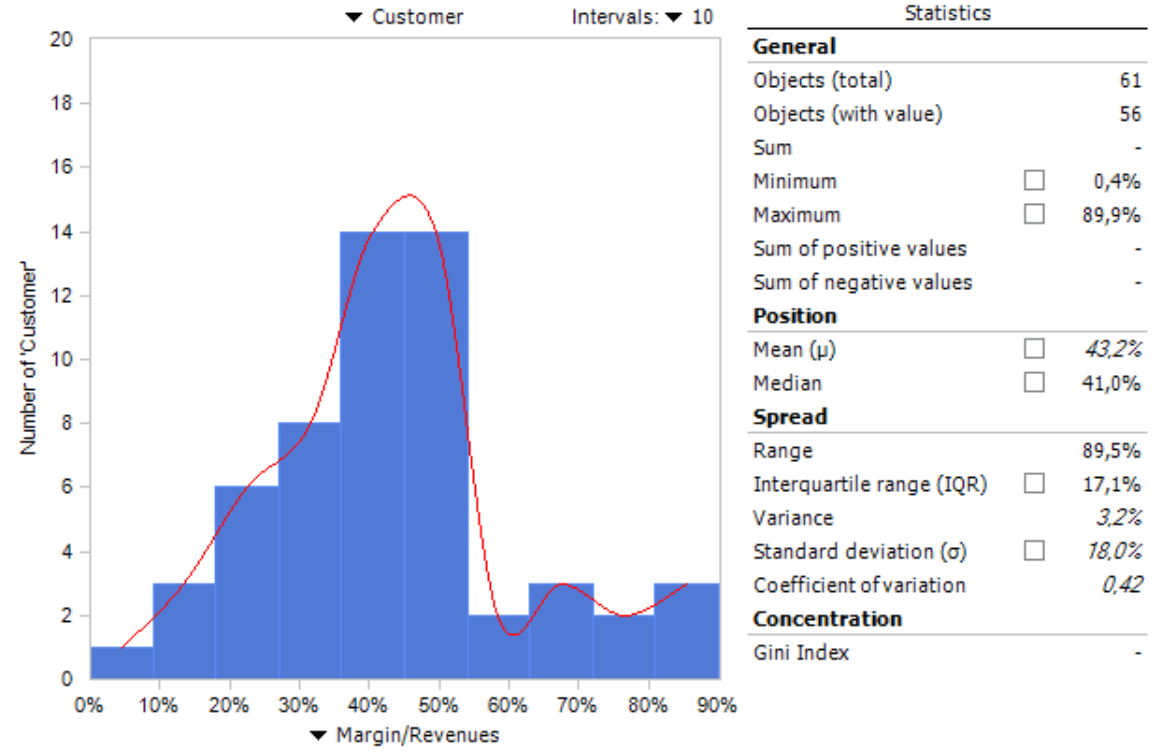
A Distribution analysis calculates and displays a series of statistical measures. Here, too, you can choose from two different ways to count: Objects (total), which include null values, and Objects with values, which also include 0’s. If you select Average, a 0 counts but a null does not – just as it does in statistical measures.
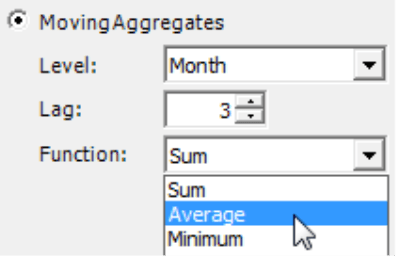
Time analysis members, which we described in detail back in DeltaMaster clicks! 8/2007, also make this type of differentiation. Moving aggregates count 0’s but not nulls. Therefore, the average of three monthly values {100, null, 20} equals 120/2 or 60, but the average of {100, 0, 20} is 120/3 or 40.
DeltaMaster always calculates the count and average displayed as Row, Column and Table aggregations in pivot tables without null values. You can use this information to describe and explain the values designated in the pivot table. After all, it would be very confusing to include phantom numbers that were not documented in the table.
Null in time series
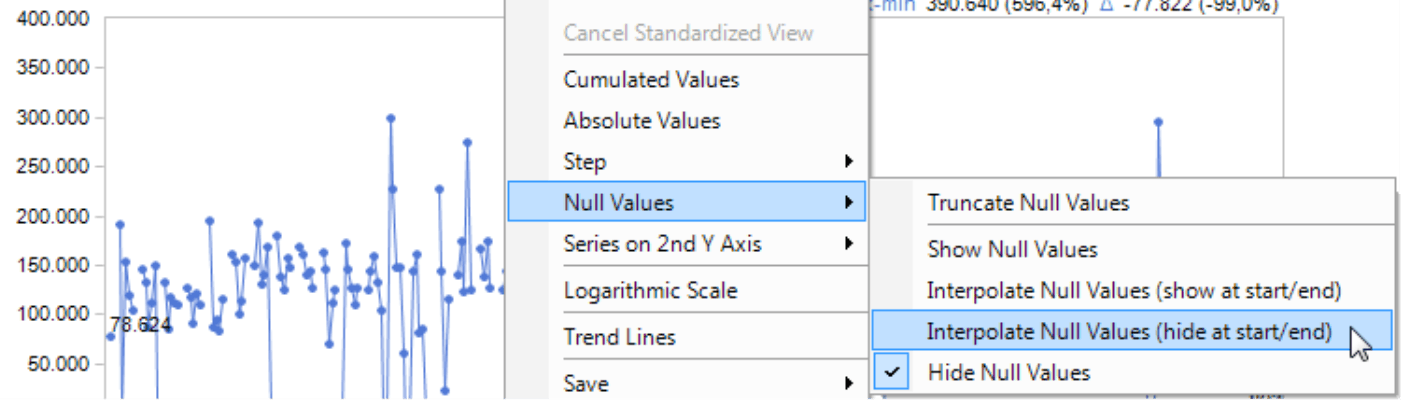
Null values are often bothersome in Time series analyses and sparklines (i.e. miniature time series). For example, when no values are collected on weekends and holidays, large ‘icicles’ can form in the chart. As a result, DeltaMaster offers the options to cut, hide or interpolate null values in the context menu or I want to… menu. If you cut them, DeltaMaster will adjust the presented time frame. In other words, it will move the beginning of the time frame so far to the right and the end of it so far to the left so that the time series no longer begins and ends with a null value. If you choose the Hide or Interpolate options, however, DeltaMaster will leave the start and finishing points untouched. If you want to bridge gaps within the time series, DeltaMaster can interpolate null values linearly. You can also determine if you want to show or hide these at the beginning and end using the respective options.
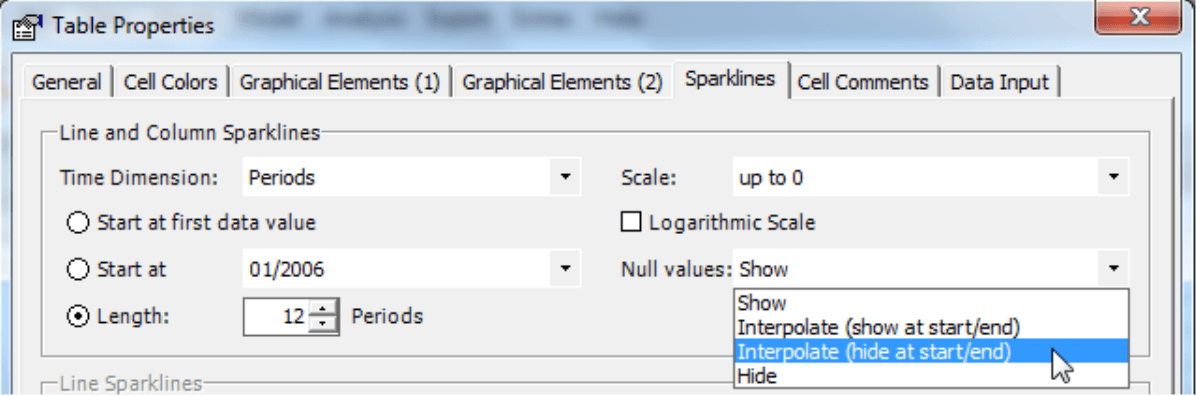
These same ptions for showing, hiding and interpolating null values are also available for sparklines (Table properties). However, you do not need to hide them here; where the sparkline starts and how long it is depends on the view and the settings designated in the Table properties.
Classifying nulls
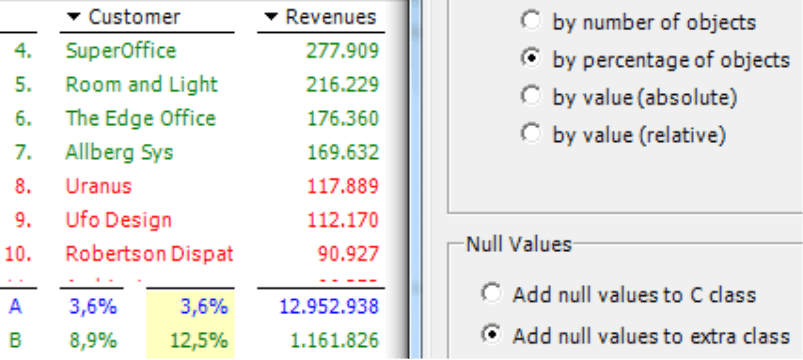
DeltaMaster has four analytical methods in which you can reuse your findings as a virtual hierarchy. These are Ranking/PowerSearch, Concentration analysis, Portfolio analysis, and Distribution analysis. In the options under Settings, you can define if DeltaMaster should display members without values in one of the regular classes (e.g. the ‘C’ class in a Concentration analysis) or if it should create a separate class separately in these four types of analyses. This is very important if you want to analyze the virtual hierarchy with another measure: What was null for one measure could be 0 or a different number for another one.
0 is a value and isn’t ‘null’
Since the number ‘0’ is just a normal value in Business Intelligence, there aren’t many exceptions or options that apply.
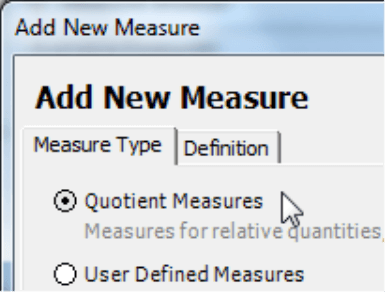
When dividing numbers, however, a 0 or null can cause problems. As you well know, you can’t divide a number by 0 or an unknown value (e.g. ‘#DIV/0!’ as Excel calls it). Fortunately, as a DeltaMaster user, you don’t have to worry about this problem – at least not when you use the wizard to Create a new measure (Model menu) to show shares, quotas, averages, or other relationships. For example in the case of Quotient values, DeltaMaster automatically checks that numbers will never be divided by unknown values. If the divisor is 0 or null, the measure will simply return null. Please note that you will have to take care of such details yourself when you work with user-defined measures. If you do, make sure a division by zero (or null) does not happen, e.g. by using a MDX expression like ‘IIf(#2 = 0, Null, #1/#2)’, which is more secure than a simple ‘#1/#2’.
Division is being used also in some measures of a gross margin flow analysis with a hierarchal structure effect. Here, too, DeltaMaster checks for division by 0. Although it doesn’t calculate the individual measure in this case, the existing values do flow into the calculation schema in order to keep the mathematical errors as low as possible.
In sparklines, time series and other types of charts, 0’s still play a very important role – especially when it comes to scaling. One common question is if you should or should not cut the axes. But that is an entirely different story that we don’t want to discuss here in detail. Bella, our visualization expert, has many different suggestions and rules which you can read in her English blog (www.bella-consults.com). For more information on her new book which includes 75 rules for better visualization (German language only), simply visit www.bella-buch.de.
![]()
Eliminating null members from analyses
As we mentioned previously, a null member is different than a null or 0. We define null members as those that don’t have a tangible counterpart in your real business, for example, miscellaneous entries for values that you can’t assign anywhere else. In a well-maintained system, these members generally have a value of null, 0 or an infinitesimal value. Nevertheless, these types of miscellaneous entries often exist as dimension members – sometimes even in every single dimension in the model – in many systems. In most situations, you can remove these null members from your reports to save space and make your report easier to read.
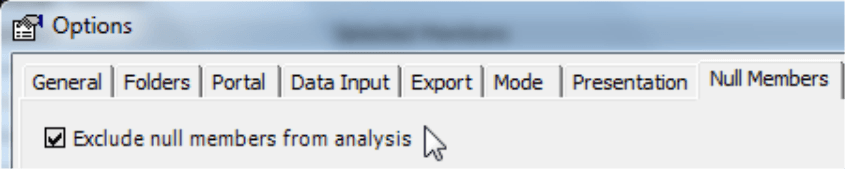
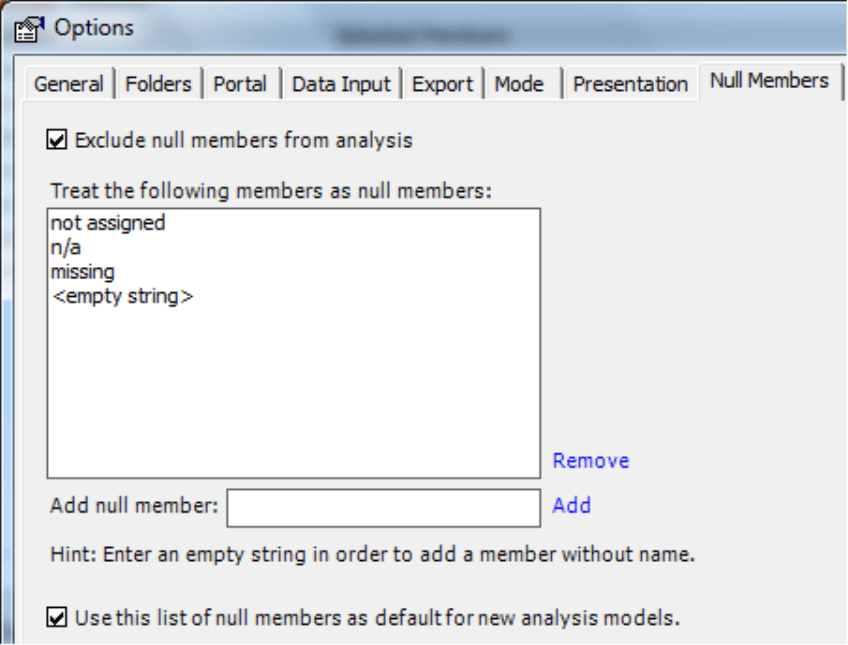
In the Extras menu under Options, there is an entire tab devoted to Null members. Here, you can decide if DeltaMaster should Exclude null members from the analysis. Once you have activated this option, you can then define which members should be treated as null members in a second separate step.
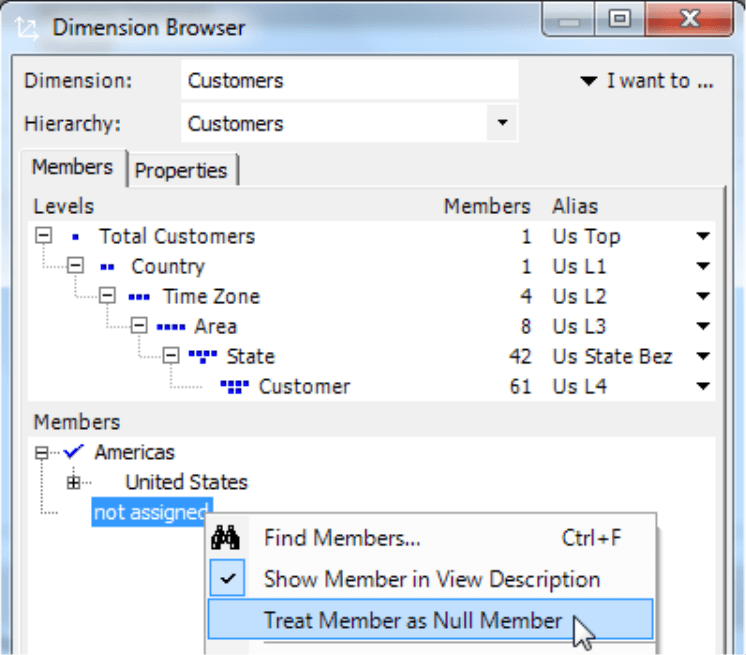
- If you want to treat specific members as null members, simply activate the respective option in the Dimension browser by opening the context menu on that member. DeltaMaster will only display this if you have already activated the option to exclude null members. The Dimension browser designates all null members with a gray font color.
- Depending on the underlying database and its data model, you might have large quantities of null members. Sometimes, you can even find these remnants in every hierarchy or group of members. In this case, it helps when you can hide all null members at once instead of just searching for and selecting them individually in the Dimension browser. For this reason, there is a data entry field on the Null members tab under Options in the Extras menu. Here, you can enter the names of the members in question (for example: ‘missing’, ‘n. a.’ or an empty character string) and Add it to the list. You can also use this list as default for new analysis models. Any models that are based on the same database system use the same names for null members – even in different applications. If you choose this option, therefore, you don’t have to define this setting again and again.
When you exclude Null members this way, it is almost like an additional, global limitation of the view. DeltaMaster, therefore, will immediately eliminate null members in cockpits, reports, and analysis results as well as omit them from calculations and visualizations. One exception to this rule is a pivot table: When you exclude a null value there, this only applies to the axes that are designated in the Level selection (Axis definition). This happens because the null member elimination is implemented based on the view concept. The Member selection and user-defined MDX expressions in pivot tables, however, intentionally overrule the view (see DeltaMaster clicks! 4/2009 for more information). As a result, DeltaMaster would display null members. But since these two options explicitly determine which members should be displayed, null members can easily be eliminated directly in the Axis definition.
When you are interpreting the results, please remember that all of this has no effect on the values of aggregated members in your database. Even though the null members are not officially listed in your report or analysis, the amounts contained in them still factored into the aggregated sum which comes from the database. If you have created sums, averages or other calculations using the Row, Column or Table aggregation features in DeltaMaster, these null members will not be included in your pivot table. For more information on the difference between aggregated values from your database and the aggregation options in DeltaMaster, please refer to DeltaMaster clicks! 12/2009.
In day-to-day business, this difference shouldn’t have any major consequences because you only hide null members when they contain no values or very small ones anyway. If this isn’t the case with your data, these null members could be a sign for incomplete or incorrect business transactions. As a result, it makes sense to analyze them carefully. If you can discover the weak spots in your data supply or problems in your operative systems and underlying processes, you can improve the overall quality of your data. In cases like these, you can quickly see if you can’t allocate significant revenue sources correctly if you do NOT suppress null members in DeltaMaster. This also applies when you are building new applications. In an iterative modeling process it is important to check the status quo every now and then to see if everything is working correctly or where fine tuning is necessary – “Analytical Modeling”.
Questions? Comments?
Just contact your Bissantz team for more information.
