![]()
Greetings, fellow data analysts!
When we ponder over good Business Intelligence, we also think about engineers and industrial manufacturing. Our industrial reporting concept, for instance, strives to increase the efficiency of (report) production and avoid manual fine-tuning while maintaining a consistent level of quality in changing data scenarios. We also feel that reporting as a whole could profit from standardized presentation forms, which are the norm form technical drawings.
In this edition of DeltaMaster clicks!, we will explore a few more parallels to the manufacturing industry: parts and usage lists. In production planning, a parts list shows which individual items and groups of items make up a product. On the other hand, the usage list shows which products use a given part. Both concepts, parts and usage lists, have equivalents in DeltaMaster; they just have different names. Using the Object dependencies dialog box, you can examine the structure of your reports and switch among the different objects that they contain – from an information-dense portal page to underlying pivot tables, from pivot tables to measure definitions, and back again. What’s more, you can even directly edit the used parts in DeltaMaster. In that case, we might even have a slight edge over the people in production for once.
Best regards,
Your Bissantz & Company team
One of the reasons why DeltaMaster is so flexible is that you can easily create large, complex applications by reusing and combining several smaller components. For example, you can define calculated members (e.g. a budget-actual variance) or user-defined measures to display them in pivot tables. You can then add this entire table to a combination cockpit or reference individual cells from the table in a Flexreport. With the help of a new dialog box, you can now easily view the dependencies of these and other objects in the analysis model from a central location. In addition, you can even quickly access and edit the definitions of the respective objects directly from the dialog box.
This edition of DeltaMaster clicks! will show how you can use the Object dependencies to navigate through the structures of cockpits, reports, and analyses as well as maintain an overview when working with visualizations containing multiple parts. These same instructions also apply to Flexreports, all other types of cockpits and reports, and even additional objects as described further below. You can use Object dependencies in Pivotizer, Analyzer, and Miner user modes starting in DeltaMaster 5.5.1.
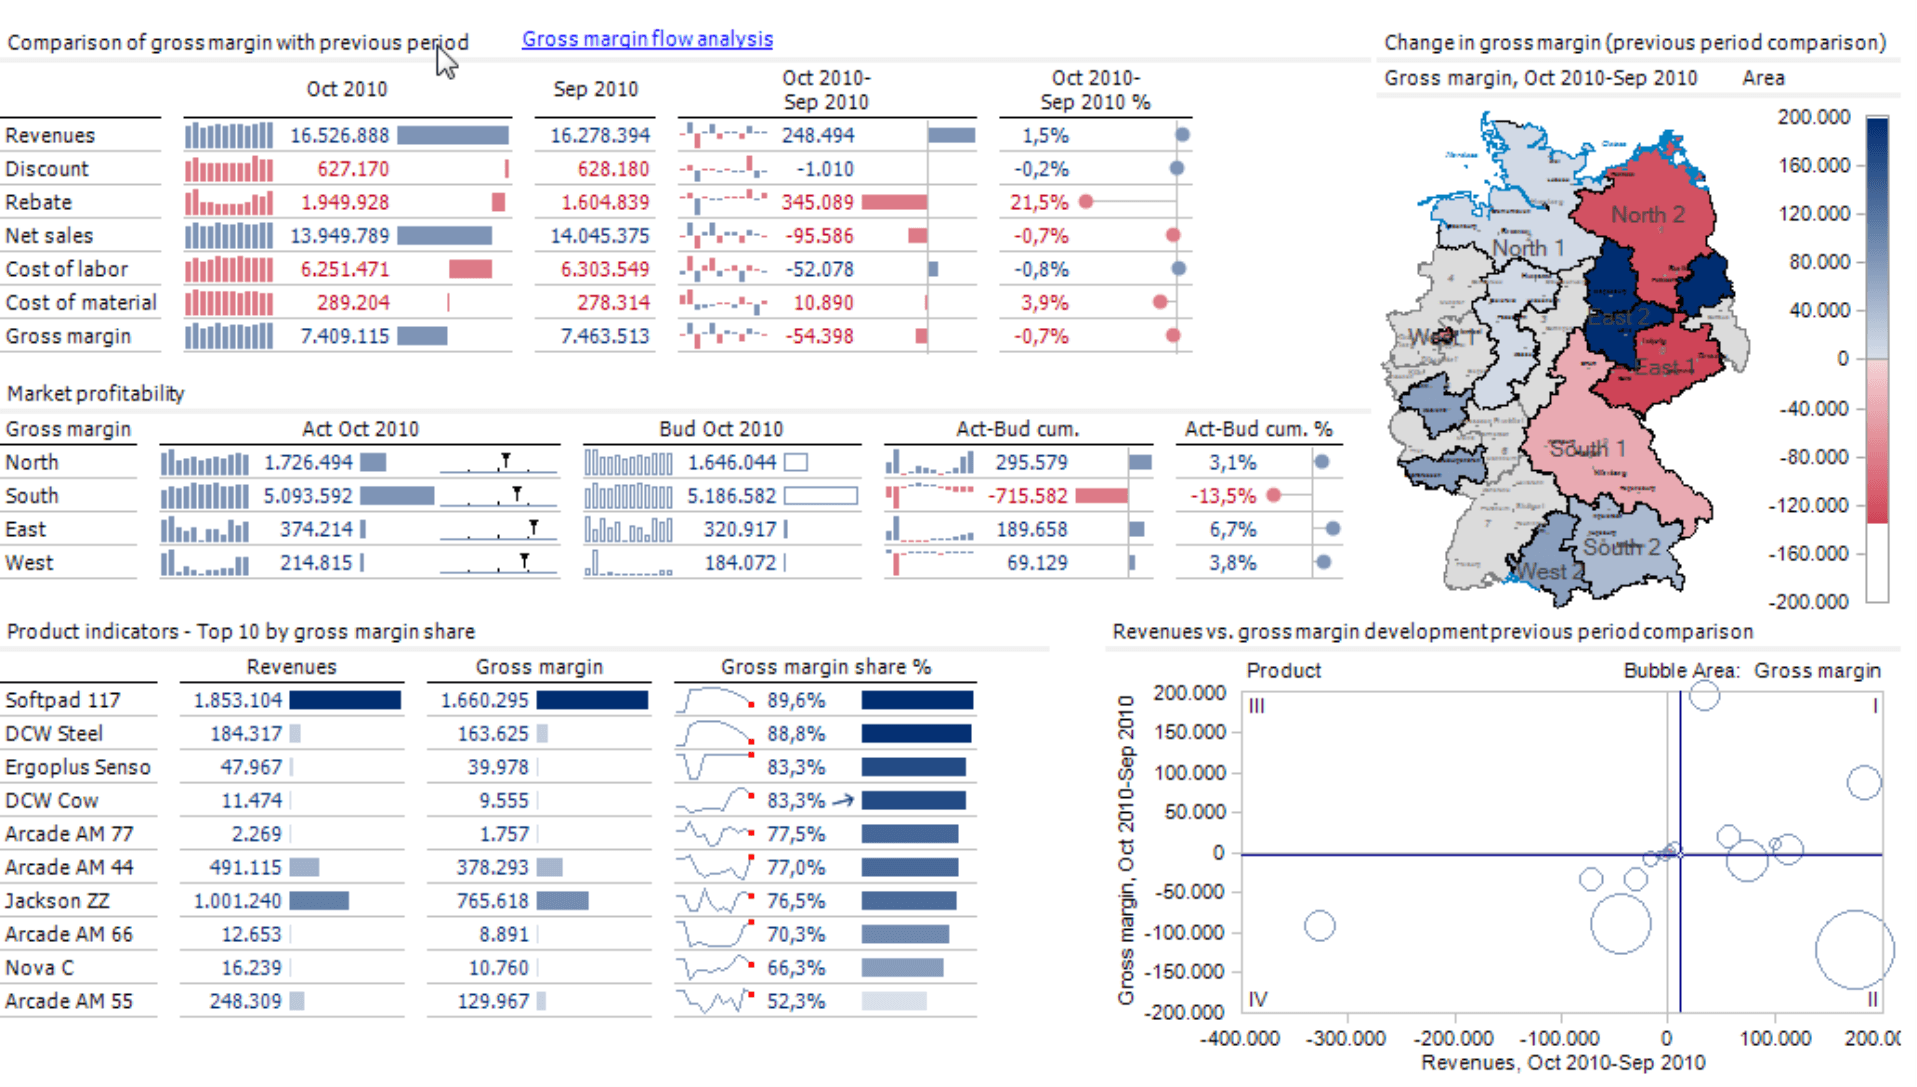
For users working on Viewer level, this “dashboard” is a report. This report is based on a combination cockpit and a view (i.e. “Oct 2010”). The combination cockpit, in turn, consists of three pivot tables (i.e. “Comparison of gross margin with previous period”, “Market profitability, budget vs. actual”, and “Product indicators – Top 10 by gross margin share”) and two analysis templates (i.e. Geo Analysis and Portfolio Analysis). The upper-left corner contains a link to a detailed visualization (i.e. “Gross margin flow analysis”). Each of these components draws on further objects that were defined in DeltaMaster. The first pivot table alone contains five of them. “Net sales” and “Gross margin” are user-defined measures, and the column axis contains three Time-calculated members (e.g. the previous period, variance to the previous period, and the relative change to the previous period). The other pivot tables and analysis templates access other objects in the analysis model which, in turn, could be linked to further ones.
Report dependencies
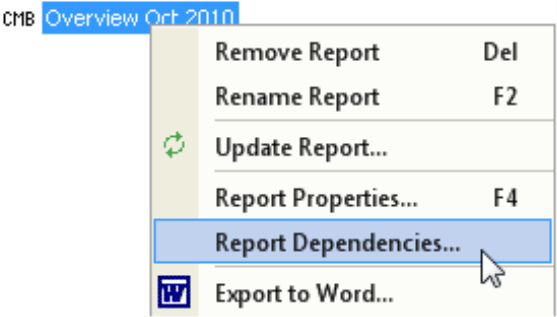
Users on Miner level can take a closer look at the report’s structures by selecting Report dependencies in the context menu of the report in the Briefing book. This option opens the Object dependencies dialog box.
The upper part of the dialog box shows the objects on which the cockpit is dependent, in other words, the objects that it contains. You will need this information when you are making changes so that you know where these objects appear. Going back to the manufacturing analogy from the introduction, this view is the equivalent to a parts list. DeltaMaster displays the contributing objects in a hierarchal structure which you can expand and collapse using the plus and minus signs.
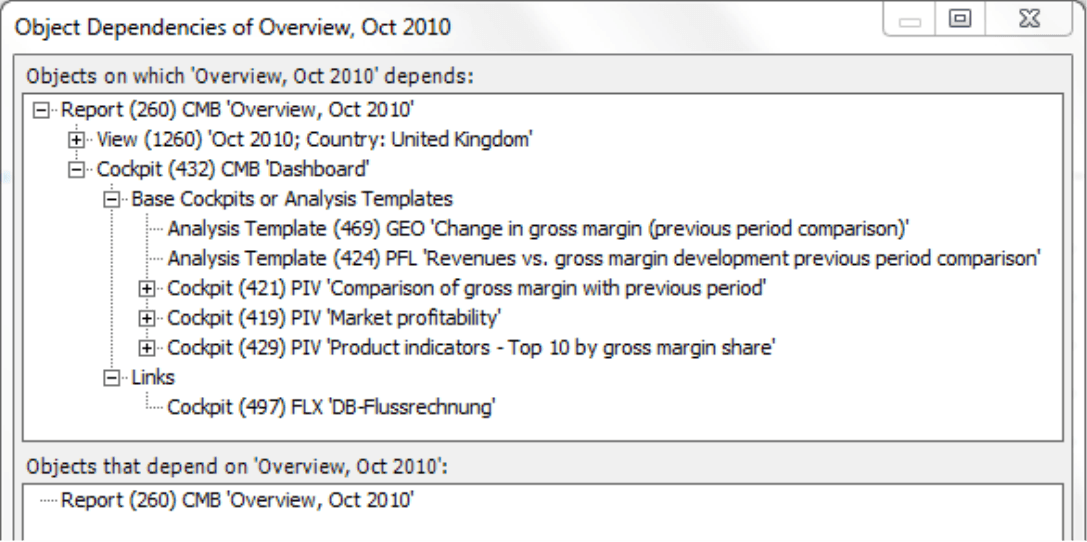
The root of the tree is the report for which you wanted to view the dependencies. You can easily identify the structure of the report. It is saved with the view “Oct 2010” and is based on the combination cockpit “Overview”. As mentioned previously, this cockpit is comprised of Base cockpits and analysis templates (two analysis templates, three pivot tables) and Links. The link in the example above refers to a Flexreport.
In the bottom part of the dialog box, you can see which other objects depend on the cockpit, in other words, in which other objects this report appears. Once again, this information is important when you are making modifications so that you can check which other parts of the application would be affected by them. In our manufacturing analogy, this would be the equivalent to a usage list.
DeltaMaster also displays the objects in this part of the dialog box in a tree structure. In this example, however, the report for which you wanted to view the dependencies is the only entry in this tree because no other objects depend on this report.
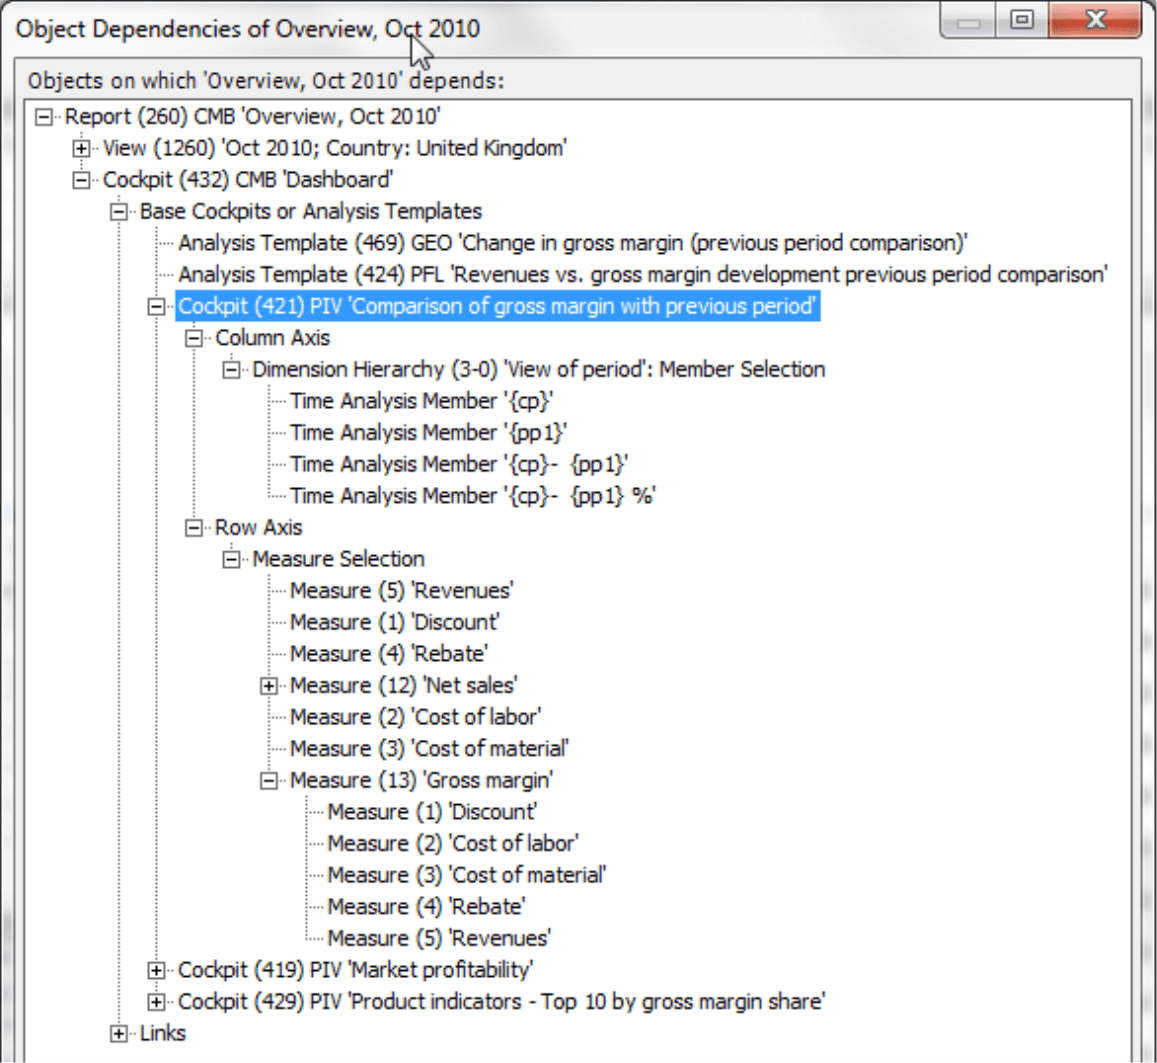
The screenshot on your right shows a drill down on the structure of the first pivot table. Now you can see which members and measures are selected on the column and row axes. If you look at the user-defined measures, you can also see which base values they use.
This example illustrates how you can dissect a presentation report (i.e. the combination cockpit) into its parts with just a few steps. In this view, some objects may appear several times, for example, because a measure that is shown in the table is also used to calculate another measure. DeltaMaster always shows the ID of the respective object in parentheses.
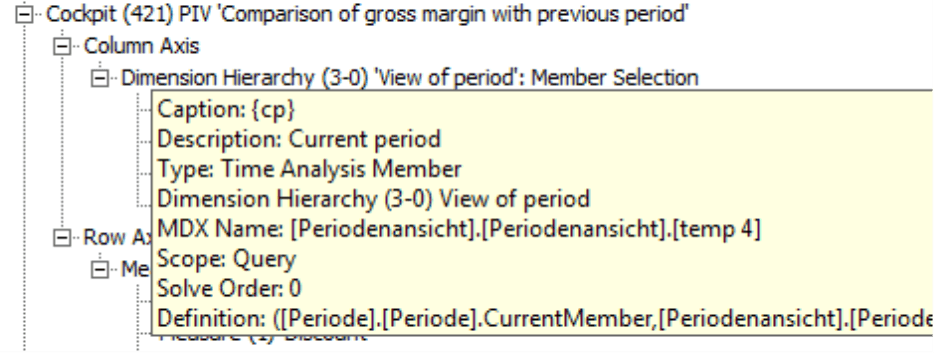
DeltaMaster will also display technical information on objects such as measures, members, calculated members, or time-calculated members if you hold the Alt key while mousing over the object. Thanks to this feature, you won’t even have to open the detailed dialog box in many cases.
Selecting objects and analyzing their dependencies
To maintain an overview of deeply nested constructs, you can select an object from the context menu. DeltaMaster will then display the dependencies of this selected object in the dialog box.
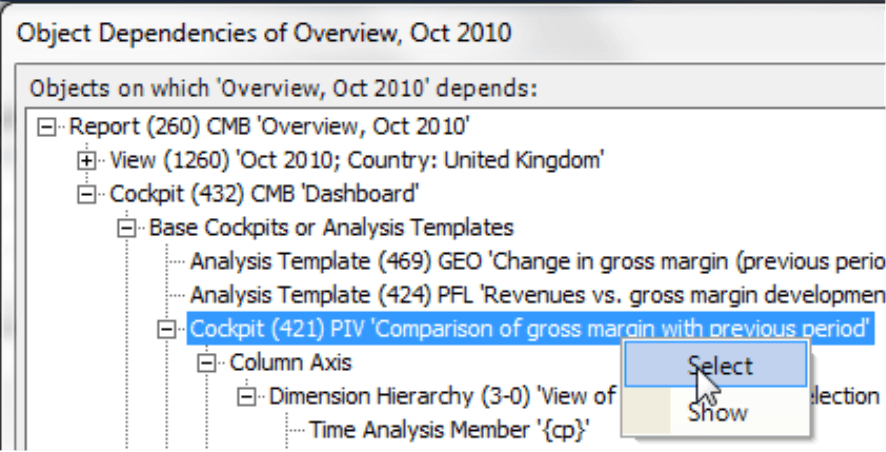
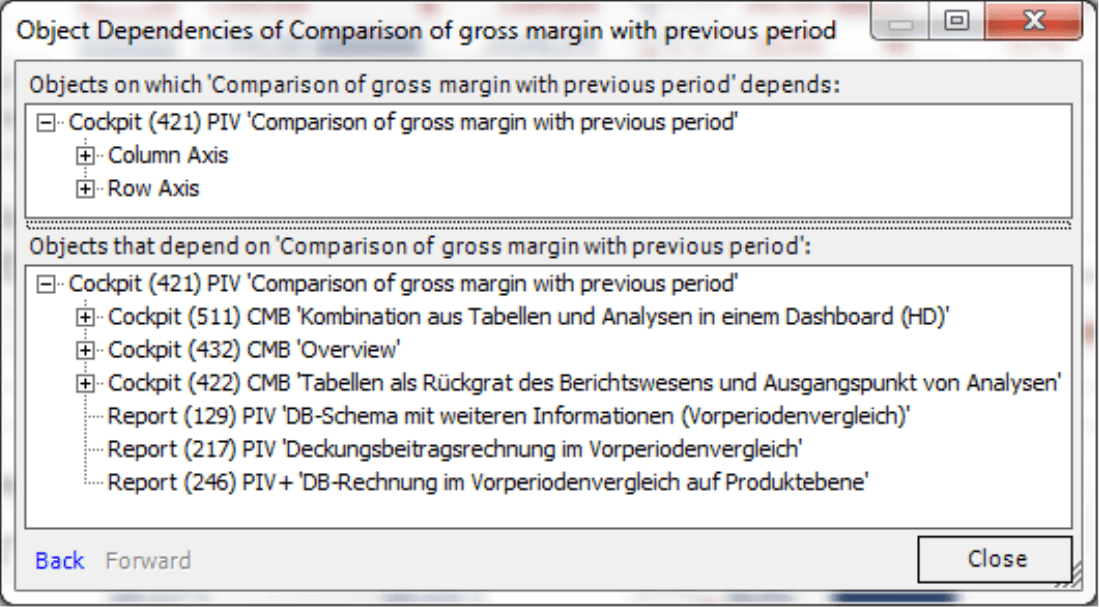
The pivot table that we had previously observed is now the root of the tree view in the upper part of the dialog box. In the bottom part of the dialog box, however, something has changed. DeltaMaster now shows that the combination cockpit “Overview” from which you previously started is dependent on the pivot table. You can also see that the pivot table also appears in other combination cockpits and, therefore, these are also dependent on it. By clicking the link on the bottom-left side of the dialog box, you can switch Back to the combination cockpit. From here, you can view the pivot table again by clicking Forward.
In both the upper and lower parts of the dialog box, you can Select objects and navigate through the pivot table using the Back and Forward links. The navigation is very similar to the principles that you know from working with OLAP and pivot tables. Here, too, you can click on the plus and minus signs in the pivot tables to show or hide (i.e. drill down or roll up on) members on lower hierarchy levels. Selecting a member is similar to a “slice”.
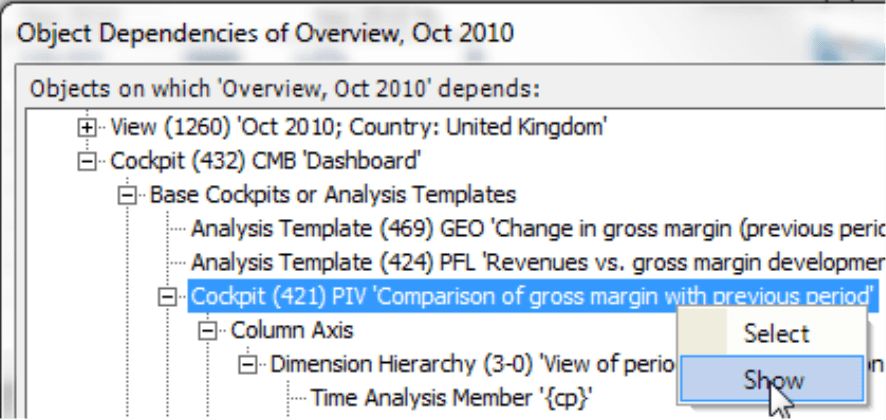
Showing and editing objects
In addition to examining a report’s structure, you can also edit its components directly from the Object dependencies dialog box. You can access this functionality by clicking Show, the second option in the context menu of the objects. Let’s say, for example, that you need to change a measure definition in a combination cockpit. Now, you can Show its Measure properties from the Object dependencies dialog box. Since DeltaMaster keeps the Object dependencies dialog box open while showing an object, you can quickly switch among the objects, make changes, and even check their effects.
- When you Show a pivot table, Flexreport, or a combination cockpit, DeltaMaster will open this cockpit in the Cockpit window. From here, you can edit and save these objects as usual.
- When you Show an analysis template, DeltaMaster will activate the respective analysis module and open the template in the Analysis window.
- If you Show a named set, DeltaMaster will open that set in the Named seteditor.
- If you Show a calculated member or a time-calculated member, DeltaMaster will open that member in either the Editor for calculated members or the Time analysis member editor.
- If you Show a measure, DeltaMaster will open its Measureproperties.
When you Show objects, DeltaMaster will only account for the current user level and grant access to objects that you can edit on that particular level. For example, you can only access Measure properties on Pivotizer, Analyzer, and Miner levels, Flexreports on Miner level, and certain analysis templates such as Geo Analysis on Miner Expert or Miner Professional levels – provided, of course, that you have a valid license for the Geo Analysis module.
Many dependencies, one dialog box
The scenario described above started in a Briefing book where you examined the dependencies of a report. In its structure tree, you discovered cockpits, time-calculated members, and measures. You could have placed any of these objects at the top of the structure tree (e.g. by clicking Select or Back/Forward). The dialog box, however, always remains the same because DeltaMaster simply adapts the display to the current contents. This is the reason why the dialog box has such a universal name. It sometimes shows Report dependencies, Cockpit dependencies, the dependencies of calculated members, and even the dependencies of named sets. Accordingly, you can open the Object dependencies from eight different places:
- Report dependencies – context menu of reports in the Briefing book
- Folder dependencies – context menu of folders in the Briefing book
- View dependencies – context menu of views in the History window
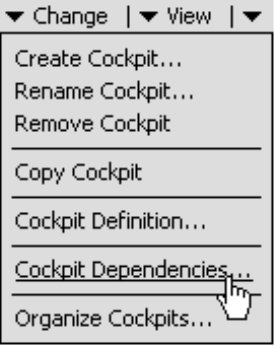
- Cockpit dependencies – Change menu of the Cockpit window
- Dependencies link – Named set editor
- Dependencies link – Measure properties on the General tab
- Dependencies link – Editor for calculated members
- Dependencies link – Time analysis member editor
No matter which starting point you choose, each one leads to a universal dialog box. You will probably use this option often to change combination cockpits and Flexreports. Now, you no longer have to search in Designer or the Cell properties for the name of a referenced or integrated pivot table so that you can select it in the cockpit list, change it, and switch back to the combination cockpit or Flexreport. Instead, you simply show the respective pivot table from the Report or Cockpit dependencies. You can leave the Object dependencies dialog box open so that you can switch among the respective objects with just a few mouse clicks.
Questions? Comments?
Just contact your Bissantz team for more information.
