![]()
Greetings, fellow data analysts!
When we demonstrate how DeltaMaster can be used to analyze variances during seminars and webinars on reporting, we sometimes find ourselves being asked the question: Where do you actually get the planned figures from that you use to calculate the variances? The answer is simple: From DeltaMaster! Some people may use it solely as a reporting and analysis tool, but for others, it is the most important instrument for collecting and storing planned figures. In this DeltaMaster clicks! issue, we reveal what users need to know about inputting data. The next issue will be aimed at report editors and application administrators, giving them an overview of how and where to adapt the DeltaMaster application to make data entry as easy as possible.
Best regards,
Your Bissantz & Company team
Data input reports
Planning in DeltaMaster uses Graphical Tables (pivot tables), i.e. the same format you know so well from reporting and analyses. In DeltaMaster, a data input screen is simply a report in which you can enter values using your Windows client, web browser or iPhone/iPad app. The option of making planning applications available on the web is especially popular: Planning cycles often involve employees who do not yet work interactively with DeltaMaster and instead receive their reports by e-mail or as PDF files in a user directory, for example. The web means they can be involved without having to install software – a link to the planning application is all they need to start inputting data.
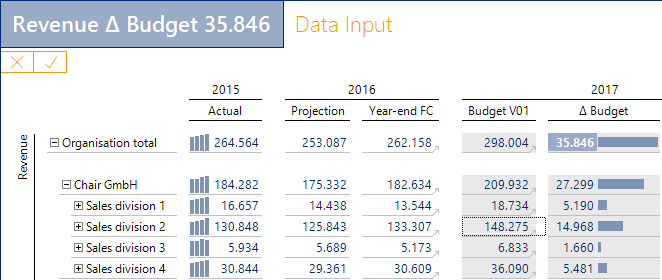
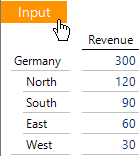
If transaction control is enabled in the application, you can start to Input data by clicking on the corres¬ponding button at the top-left of the report; otherwise you can start to input data immediately. During data input, the Input button is replaced by symbols for accepting and saving the values ![]() or canceling and discarding the data inputted
or canceling and discarding the data inputted ![]() . Filters, which can be set above the report, work in the same way as in reporting applications.
. Filters, which can be set above the report, work in the same way as in reporting applications.
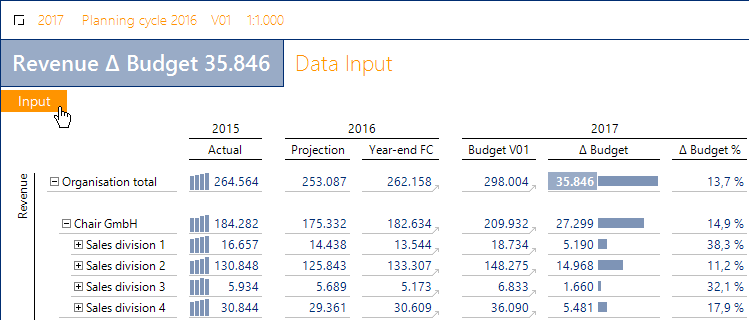
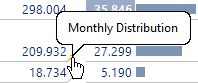
The small gray arrows and menu symbols in the cells and headers may also be familiar to you from reporting. They indicate links to other reports, typically to detailed views, e.g. from annual figures to the monthly distribution.
Select and input
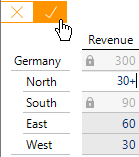
Values are inputted intuitive¬ly: Select the desired cell and enter the new value or change calculation using the keyboard. Values can be inputted in cells with a gray background; the other cells are not editable.
• Click on a cell to select it. A dotted border shows that the cell has been selected. You can also move between cells using the keyboard, either with the arrow keys or using Tab and Shift+Tab.
• Type the new value or change calculation into the selected gray cell. If you are used to doing so, you can switch the selected cell into input mode beforehand using the Enter key or the F2 key, but you don’t have to do it this way. Enter the new value then hit the Enter key.
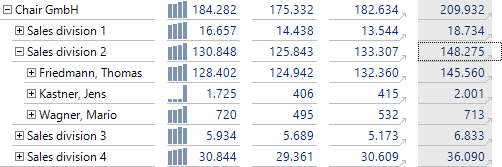
Once you have completed your input by hitting the Enter key, DeltaMaster automatically moves the selection to the next cell down or to the right (depending on the configuration). The double-click, by the way, has the same function as in reporting applications: It is used to perform a predefined navigation step or – in DeltaMaster 6.1.5 or later – an automatic navigation step if no or no more navigation steps are predefined. This is worth noting because you can actually input values in cells displayed as a result of navigation. In many cases, this can be especially useful as automatic sorting picks out the most important items in each navigation step, e.g. the products or customers with the highest revenues – and once these have been processed, you may well have already planned a good amount of the total value.
To select a cell in the app, touch it until the on-screen keyboard appears.
In-cell calculations
The value entered can be an absolute value that replaces the previous value or it can be a calculation – a little formula that calculates the new value based on the existing value and the change entered. This eliminates the need for pocket calculators or other tools.
Absolute values are inputted as simple figures with or without an algebraic sign before the value. Values inputted with a percentage sign are interpreted as decimals. For example, entering “8%” results in a value of 0.08.
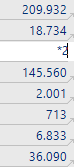
DeltaMaster recognizes calculations when one of the operators “+” (plus), “-“ (minus) or “*” (multiply) is placed after the figure. The following calculations are available:
• Addition, subtraction: The operators “+” and “-“ are used to add the value entered to the existing value or to subtract the value entered from the existing value. These operators must be placed after the value entered, as otherwise they will be treated as algebraic signs. Absolute figures (“10+”) and percentages (“10%+”) are acceptable arguments. In the case of percentages, DeltaMaster calculates the proportion of the existing value and adds or subtracts it accordingly.
• Multiplication: The operator “*” is used to multiply the existing value by the value entered. It may be placed in front of or after the value entered. Percentages may also be used in this case.
The following table illustrates how the input formats work:
| Old value | Input | New value | Explanation |
| 300 | 10 | 10 | |
| 300 | +10 | 10 | |
| 300 | 10+ | 310 | Increased by 10 |
| 300 | -10 | -10 | |
| 300 | 10- | 290 | Decreased by 10 |
| 300 | 10% | 0.1 | |
| 300 | +10% | 0.1 | |
| 300 | 10%+ | 330 | Increased by 10 percent |
| 300 | -10% | -0.1 | |
| 300 | 10%- | 270 | Decreased by 10 percent |
| 300 | 1.1* | 330 | Multiplied by a factor of 1.1 (increased by 10 percent) |
| 300 | *0.9 | 270 | Multiplied by a factor of 0.9 (decreased by 10 percent) |
| 300 | *10% | 30 | 10 percent of the old value |
DeltaMaster also supports rules on how the values entered are calculated and saved in the database. This is known as input forwarding. Relationships between the measures can also be taken into account. More information can be found in DeltaMaster clicks! 07/2014.
Automatic aggregation and distribution of changes in values (splashing)
When you input values in hierarchies, DeltaMaster ensures that the totals are always correct. The parent and child elements in the hierarchy are adjusted automatically when values are entered: The aggregated elements are updated (bottom-up) and the change in value is automatically distributed proportionately (top-down) so that the total corresponds to the new value and the proportions remain the same. This is also known as splashing. The process is fully automated, so you do not need to do anything yourself.
 ?
? ?
?
Fix values
If your planning encompasses multiple dimension levels, you may wish to selectively disable the automatic value adjustments performed by DeltaMaster when aggregating/splashing. Certain values can be “frozen” so that they remain unchanged even when the parent or child values change. To ensure that the totals are still correct, DeltaMaster will automatically distribute the change in value around the frozen values. Cell fixation is the tool in question. You can turn it on or off via the context menu for a cell or by hitting the F6 key (provided the respective measure and the report are configured accordingly). The illustration shows how the fixation works.
 ?
? ?
?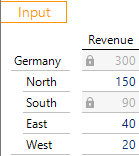
In the example, an increase is planned for the North region but the total for Germany is fixed. This means the values for the other regions must be reduced. However, one of the regions, South, is also fixed. DeltaMaster therefore distributes the change across the East and West regions, as the following breakdown illustrates.
| Customers | Old value | Fixed | Input | New Value | |
| Germany | 300 | Yes | 300 | Fixed, so unchanged | |
| North | 120 | +30 | 150 | Increased directly by input | |
| South | 90 | Yes | 90 | Fixed, so unchanged | |
| East | 60 | 40 | Reduced by 2/3 of the change in value | ||
| West | 30 | 20 | Reduced by 1/3 of the change in value |
In the report, the lock symbol is used to designate fixed cells. A gray lock indicates fixing that can be set and removed by the user when inputting data (in Presentation Mode), e.g. in order to distribute planned values to various customers without changing the total. A black lock indicates fixing that can only be set and removed in Edit Mode; the effect is the same.
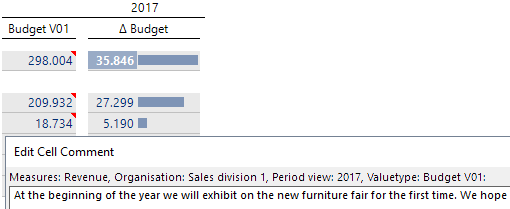
Cell comments
The reason why a planned figure comes about or the considerations behind it are often as impor¬tant as the figure itself. With this in mind, com¬ments can be stored for all planned values. To enter, edit, and delete cell comments, use the corresponding function in the context menu (or the key combination Ctrl+F2 in DeltaMaster 6.1.6 or later). A small red triangle in the cell corner indicates that a cell contains a comment. Depending on how the application is configured, comments are also displayed at higher levels so that the user does not miss them even when the respective branch is closed in the report. More detailed information can be found in DeltaMaster clicks! 10/2015. Cell comments cannot be made using the app.
Report comments
In addition to the individual values, planners can also comment on the report as a whole. If this function is enabled, an icon of a speech bubble and a pen can be found in the status bar of the report on the right-hand side (![]() ). Clicking opens an input area in which you can create and edit a comment on the report.
). Clicking opens an input area in which you can create and edit a comment on the report.

The two small icons in the input area are used to accept or discard the input. Report comments are stored centrally in a database with a reference to the current filter settings (view). This means that different comments can be created for the same report for different months, scenarios, plan versions, customer groups, etc.
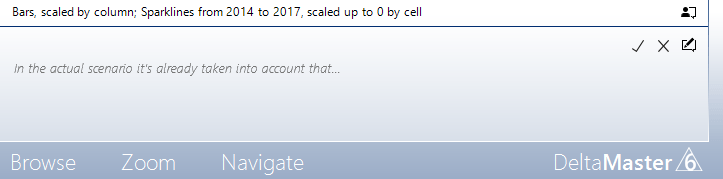
The icon of a speech bubble and a user silhouette shown above (![]() ) is for comments that can only be edited in Edit Mode, i.e. by report editors and application administrators. These comments can be shown and hidden when inputting data in Presentation Mode. In planning applications, they are often used to assist users, e.g. by providing information on the business relevance of the figures that are the subject of the query, the planning process, or the report structure.
) is for comments that can only be edited in Edit Mode, i.e. by report editors and application administrators. These comments can be shown and hidden when inputting data in Presentation Mode. In planning applications, they are often used to assist users, e.g. by providing information on the business relevance of the figures that are the subject of the query, the planning process, or the report structure.
Copy and paste
The copy and paste functions can be used to edit an entire cell area in your Windows client or web browser. The cell area is selected using the mouse or the keyboard.
• Mouse: Click on a cell at the corner of the desired cell area, e.g. the top left-hand corner. Hold down the Shift key and click on the cell in the diagonally opposite corner of the desired cell area, e.g. the bottom right-hand corner.
• Keyboard: Select a cell in the corner of the area. Hold down the Shift key and use the arrow keys to extend the area from this cell upwards, downwards or to either side.
You can use the usual key combination of Ctrl+C to copy the selected values to the clipboard. Use Ctrl+V to paste the values from the clipboard into the report. This lets you transfer values from different cell areas of the same report, from other DeltaMaster reports, or from Microsoft Excel, for instance. If you try to cut data using Ctrl+X, a confirmation prompt will appear in order to prevent you from accidentally deleting data.
Selecting a cell area is only relevant for copying and cutting, not pasting. If the clipboard contains multiple values, DeltaMaster automatically pastes these into the input-ready cells below and next to the selected cell irrespective of whether these cells are also selected. If the target cells already contain values, these will be overwritten without prompting.
Copy and paste values retaining their distribution
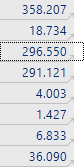
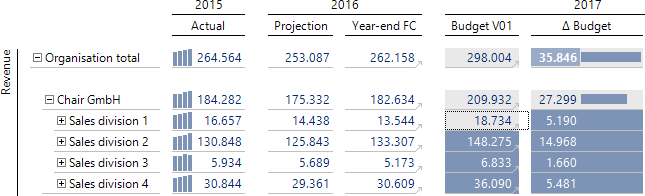
In the copying process described in the previous section, values are entered in the cells of the table in the same way as if they had been inputted directly. By means of splashing, the copied value is distributed across the cells below the target cell in accordance with the existing distribution of the target. DeltaMaster also offers a second copying variant, in which the copied value is transferred along with all of the values below the respective cell in line with the multi-dimensional data structure. This preserves the existing value distribution of the source. You can copy values while preserving their distribution by dragging and dropping in your Windows client or web browser.
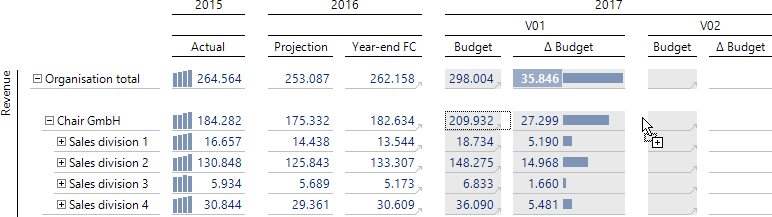
In the example, an entire value structure is dragged from one budget version to a second, empty version. This lets you quickly pre-fill the second version with values. If you were to simply enter or copy and paste the total as a value, DeltaMaster would have to distribute this value equally to all of the child cells, which typically results in unrealistic value distribution (and requires a lot of computing time).
Copy and paste data areas
The two copying processes described above (copy cell values using Ctrl+C/Ctrl+V, copy value distributions by dragging and dropping) are intended for visible cells or cell areas in the report. DeltaMaster also lets you copy, move, or fill larger data areas or even entire sections of the OLAP cube. These (copying) processes work like macros that are predefined and which include all of the settings for the copying process, so you can easily access them when inputting. The processes are often used to pre-fill planned values, e.g. by transferring the actual figures for the previous year as the planned figures for the current year or by copying seasonal distributions.
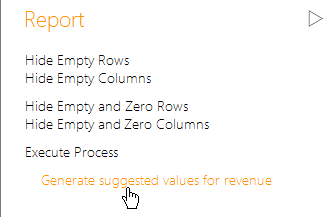
If processes are defined for the current report, these are available in the Execute Process section of the Report menu (on the right-hand side). If this section is not shown, this means no processes are defined for the current report. Launching a process initially opens a dialog informing you about what the process will do and letting you set parameters depending on the configuration of the process definition. Information on working with processes can be found in DeltaMaster clicks! 09/2014.
Run special functions
A project-specific additional DeltaMaster module lets you integrate an action menu with application-specific functions into the interface. This is displayed next to the application menu in the top left-hand corner of the DeltaMaster window. Like the menu, it is only visible when the mouse pointer is moved to the menu bar area.
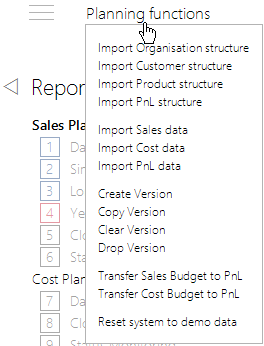
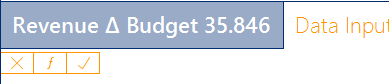
If a calculation or simulation function is implemented in the planning project, DeltaMaster displays an additional button with an “f”, the symbol for mathematical functions.
Inputting data records with SQL Drill Through
All of the processes described here relate to inputting data in Graphical Tables. You can also input data in SQL Drill Through and save it in a relational database. The underlying concept, the application scenarios, and the preparations in terms of the database are different to those for the typical multidimensional planning applications assumed in the above discussion. In particular, relational input applications let you create new data records, e.g. new inquiries or orders (transaction data) or new customers, materials, or scenarios (master data). Users typically input not only numerical values in the tables, but also other data types, especially text. We mention it here for the sake of completeness – relational inputs will be the subject of
