![]()
Greetings, fellow data analysts!
As the old saying goes, there is a time and place for everything. In good literature, for example, highly elaborate and intricate styles of writing are often a pleasure – or sometimes a pain – to read. Yet, if you have to communicate a message that people should understand quickly, it is probably best to use clear, simple language.When you analyze data from multiple dimensions, you also need a certain level of complexity. Yet, that can quickly become too much of a good thing. To help you stay focused on what is important, DeltaMaster offers many built-in features such as nested hierarchies. With this feature, you can quickly gain an overview of multiple characteristics – without getting lost in the details.
This edition of clicks! offers many helpful tips for working with nested hierarchies and pivot tables. Try it for yourself and see the difference.
Best regards,
Your Bissantz & Company Team
Nested axes are common place in pivot tables. In fact, you work with them whenever you display more than one dimension on a row or column axis. This edition of clicks! will explain how DeltaMaster deals with this type of construction and provide helpful tips on how you can adapt it to your requirements.
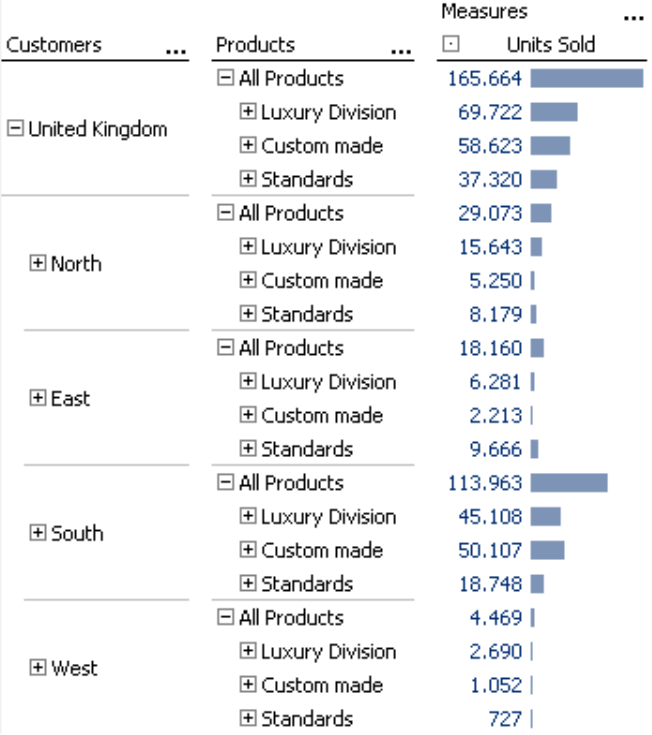
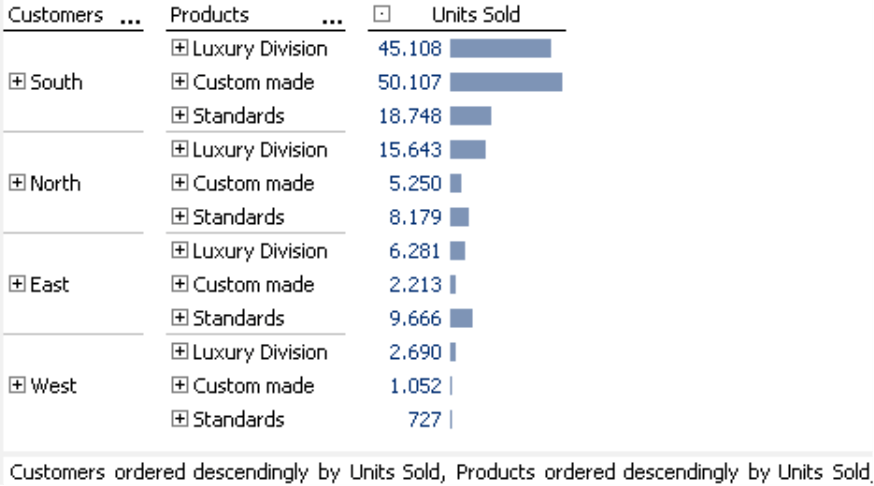
Let’s start by taking a closer look at this pivot table from our ‘Chair’ reference application. The customer and product dimensions are nested on the row axis. Here, the customers are located on the outside while the products are on the inside. The measure (in this case, ‘Units sold’) is located on the column axis. This report shows the number of articles sold in each of the four customer regions which, in turn, are broken down into three product categories.
Sorting hierarchies in a report
If you are working in Pivotizer, Analyzer, or Miner mode, you can change the order of the dimensions in the Report definition, Cockpit definition (Miner mode), or the report itself.
![]()
To change the order directly in the report, you simply drag the column header (or another dimension member) and drop it into another hierarchy column. DeltaMaster will then exchange the two columns. The same applies to dimensions on the column axis. For the sake of simplicity, however, let’s stay with the row axis for the time being.
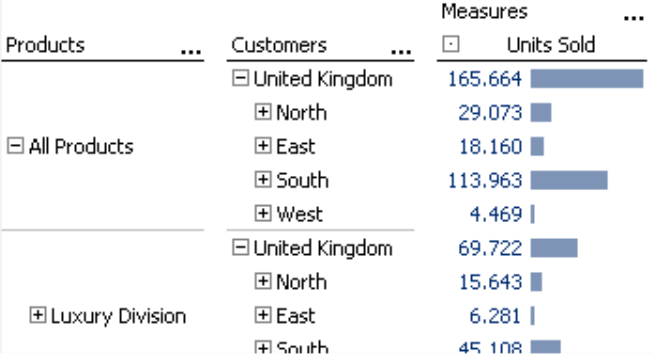
In the example on your right, you can see that the units sold are now arranged by product categories (outer hierarchy), which are then broken down by customer regions (inner hierarchy).
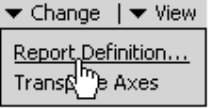
Instead of changing the order of the columns directly in the report, you can also do this in the Report definition or the Cockpit definition (Miner mode) in the Change menu of the Report or Cockpit window. To open this function even faster, simply click on the menu header ‘Change’ instead of waiting for the menu header to expand. When the dialog box opens, you can now edit the structure of the pivot table from a bird’s eye view. This makes it easier to create or rearrange a relatively complex table because DeltaMaster will wait until you have defined the entire structure before recalculating the table.
Arranging members inside the hierarchy
Even if you have explicitly defined the parts of the axes as a member selection (i.e. pick list; Axis definition, General tab), you can still arrange the members directly in the report if you drag and drop them while holding the Alt key. This functionality applies to measures as well. Alternatively, you can use the Order options in the Report or Cockpit definition; these are located in the context menu of each measure.
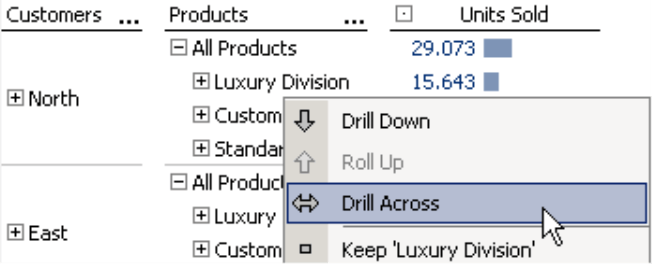
To save space in these visualizations, you can omit the sum rows (i.e. ‘United Kingdom’ and ‘All products’) so that only the regions and product categories remain. This can be done quickly by doing a Drill-across (context menu of the hierarchy columns).
Custom drill downs
When several dimensions are located on an axis, DeltaMaster creates the cross product of these dimensions. In other words, it displays all of the members of the inner dimension for each member of the outer one. This also occurs when you drill down on a branch by clicking the ‘+’ symbol.
Let’s say, for example, that you want to expand the ‘Luxury division’ member to take a closer look at your sales figures for the respective product categories. DeltaMaster will then display the subordinate members (Arcade, Discus, Precisio) in every region that sold items in the Luxury Division.
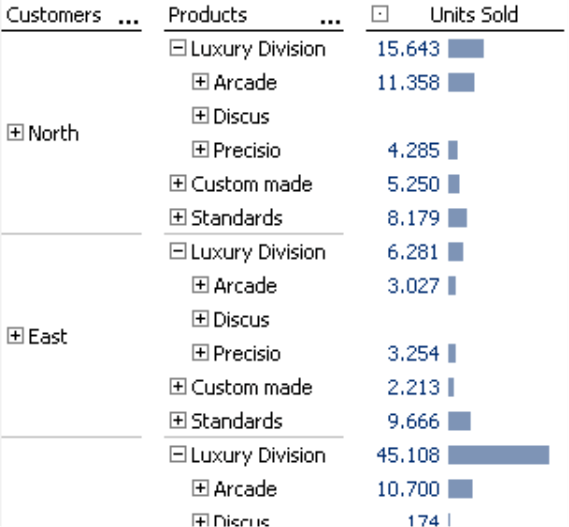
If you hold the Ctrl key and clicking the ‘+’ sign, however, DeltaMaster will only drill down on that particular row. In the screenshot on your right, you can see that the luxury division is only broken down into its three product subcategories in the North region; the hierarchy remains collapsed in all other regions.
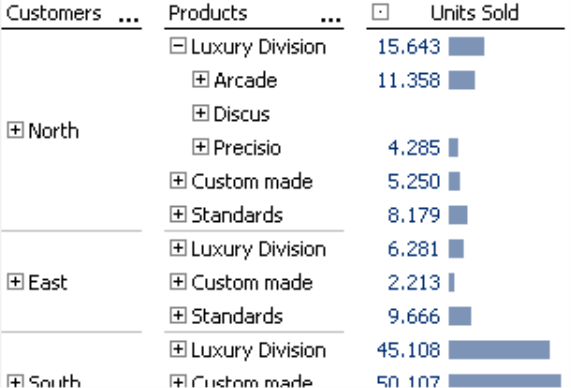
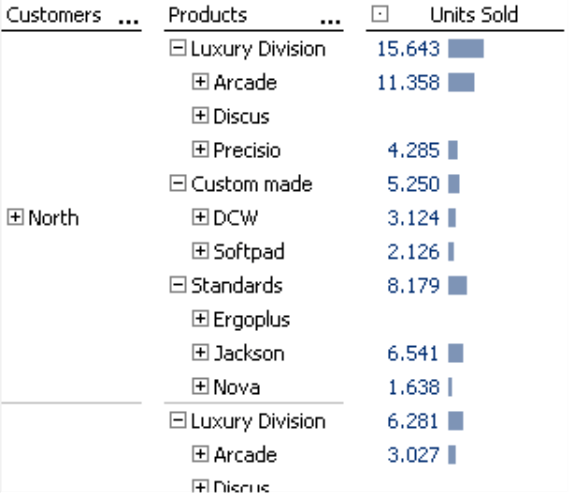
Note: If you hold the Shift key and then click on a ‘+’ or ‘-‘ sign in the pivot table, DeltaMaster will drill down or roll up on every member on that level. That means that you could expand the Luxury division, Custom-made, and Standards product groups with a single click as you can see in the screenshot on your right.
You can use both of these options (i.e. clicking while holding the Ctrl or Shift key) in Viewer mode as well provided that the Member drill down option is allowed down to this Level (setting in the Axis definition on the Options tab). Please note that you can use the Shift key function (i.e. completely opening/closing a hierarchy level) in all pivot tables. The drill-down option with the Ctrl key (i.e. expanding a single member), however, is only relevant for nested hierarchies.
Switching the order in nested hierarchies
In the previous examples, DeltaMaster displayed the dimension members in the same order as they are saved in the database. In an analytical report, however, you usually want to arrange the order based on a certain value. You can define this setting in the Axis definition on the Ranking tab for each individual dimension.
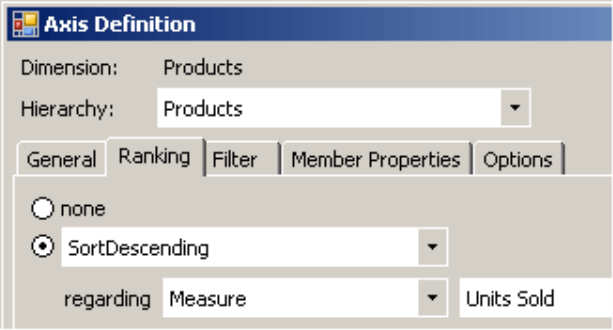
The actual order of the inner hierarchies depends on a special option in the axis definition. But let’s start at the beginning:
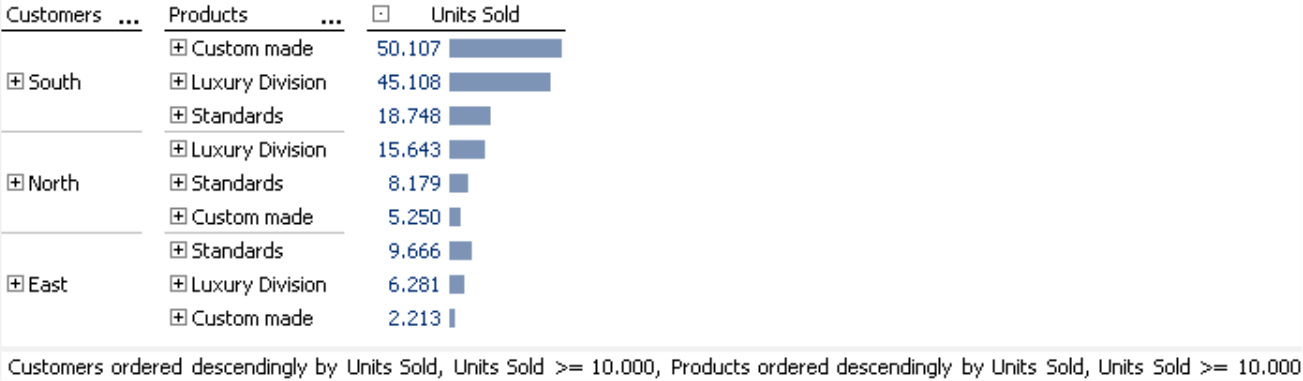
In the example on your right, the Ranking is activated for the customer and the product dimensions. As a whole, the length of bars confirms that the order of the customers is correct. Customers in South purchased the most items. North ranked second followed by East and West. But how is that within the nested products? The South region, for example, booked sales of 45,108 luxury articles and 50,107 custom-made items. Yet, although fewer units were sold in the luxury division, it ranked first while custom-made items followed at second place. Did DeltaMaster mix something up in the order? Of course, not!
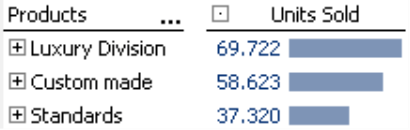
In the default setting, DeltaMaster ranks the respective dimensions independently. In this case, the customers come first (without observing the products in question) followed by the products (without observing in which region the items were sold). In the observed time frame, Luxury division was more successful than Custom-made and that, in turn, was more successful than Standards. That’s why DeltaMaster uses this order for all customer regions in the report above. In this chart, you can see which product category had the highest number of sales, even if this ranking varies in the different segments – or in this case, regions. (As you will soon see, you will even encounter this same overall order in a single segment – the one with the least amount of units sold. This example shows why you need to understand the big picture as well as the details and, therefore, need drill-down options to examine lower levels.)
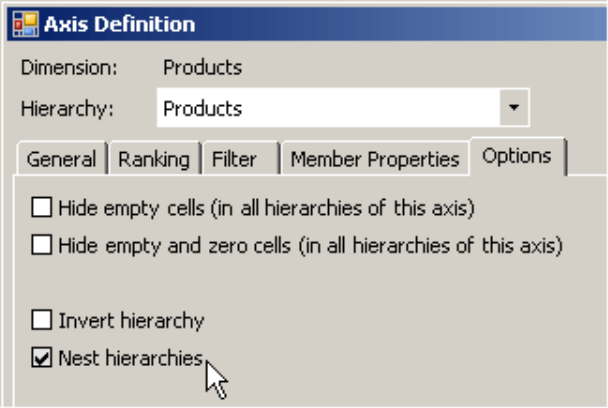
Alternatively, DeltaMaster can apply the order of the members from inner hierarchies with regards to a member in the outer hierarchy. First, however, you must activate Nest hierarchies in the Options of the Axis definition.
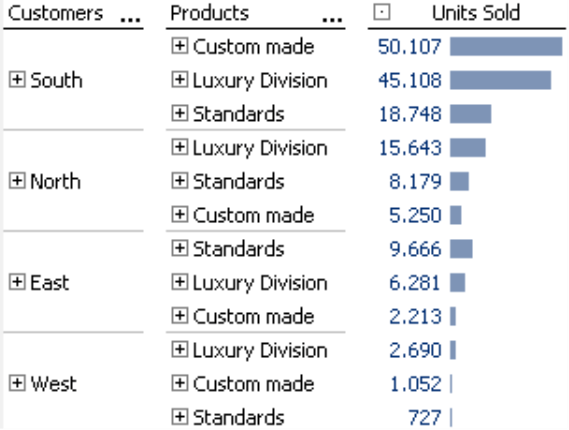
If you select this option, you will get the report on your right. The customer regions are now sorted by units sold, and within each customer region the product categories are sorted as well. The order in the South region, for example, is Custom-made, Luxury division, and Standards, while in the North region it is Luxury division, Standards, and Custom-made. Only the West region, the weakest one, has the same order as the overall market – Luxury division, Custom-made, and Standards.
The Nest hierarchies option shown above applies to all inner dimensions simultaneously. Even if you combine two dimensions with each other, you only need to check this option once. If your row or column axis only contains one dimension, DeltaMaster will not offer this option.
Filters in nested hierarchies
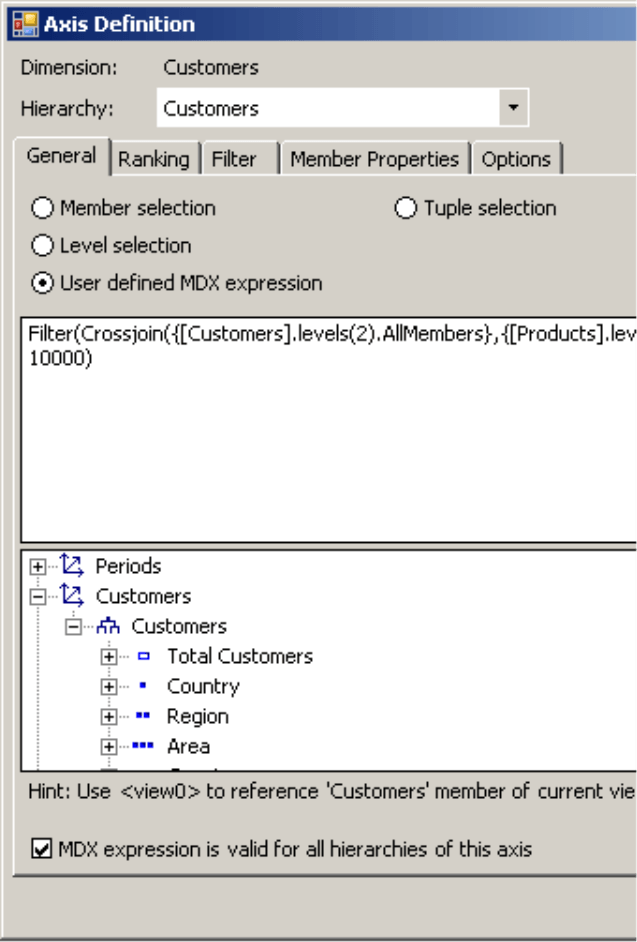
In the Axis definition, you can also opt to use Filters. In this example, you would probably only want to show objects that have at least 10,000 sold units. DeltaMaster always applies filters to the dimension in which they are defined and not to the tuple which is based on a group of several dimensions.
If you apply the filter mentioned above (i.e. Units sold >= 10,000) to the product dimension, the report content will remain the same. As you can see in the report with three rows on page 4, unit sales were higher than or equal to 10,000 in all product groups (regardless of the breakdown by regions). This filter, therefore, does not apply. If you define an additional filter in the two affected dimensions, DeltaMaster will remove the West region because its sum (regardless of the breakdown by products) does not meet the filter’s requirements. Nevertheless, the report still contains values under 10,000 because the filter does not apply to customer/product combinations.
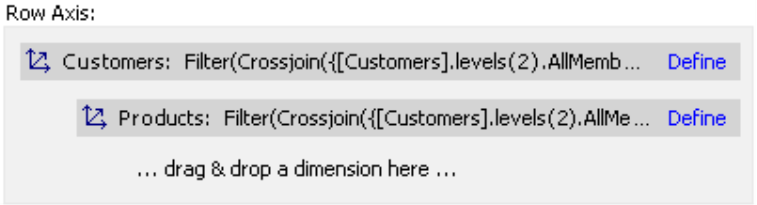
If you need to filter the tuples, you can use a User-defined MDX expression in the Axis definition (General tab).
First, open the Report definition or Cockpit definition and make sure that the dimensions you want are located in the Row or Column axes – in the same nested form that you would like to have in your report. Now, open the Definition of one of these dimensions, select the General tab, and switch to a User-defined MDX expression. You also need to specify that the MDX expression is valid for all hierarchies on this axis by activating this option at the bottom of the dialog box. Now, you can combine the filter criterion with the cross product in the user-defined MDX expression.
In this case, it would be:
Filter(Crossjoin({[Customers].Levels(2).AllMembers}, {[Products].Levels(1).AllMembers}), Measures.[Units sold] >= 10000)
The ‘Crossjoin’ command returns the cross product of the dimensions that you want to nest. ‘Filter’ is the criterion for filling the tuple – in this case, at least 10,000 units sold. You can arrange the ‘Order’ as well using the respective MDX function. You should use the dimensions that are defined in the ‘Crossjoin’ in the same order that they are placed in the Report or Cockpit definition and how they will be displayed in the report.
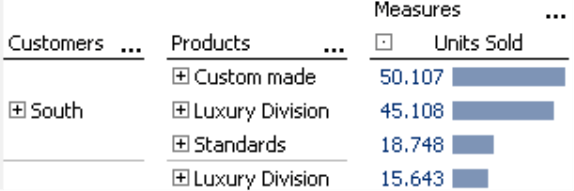
If you follow these steps, DeltaMaster will create a report that is filtered on the tuple level. As you can see in the screenshot on your right, the sample report now only contains values that exceed 10,000.
If you only want to Hide rows/columns or Hide empty and 0 rows/columns, you don’t need MDX. You can activate these options from the context menu or the I want to… menu on the Options tab in the Axis definition. In this special case, DeltaMaster also includes tuples and suppresses all rows and columns that contain no value (or zeroes) in any of the affected dimensions.
Combining members of different dimensions – the tuple editor
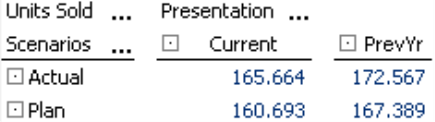
In DeltaMaster clicks! 01/2009, we introduced the Tuple editor. This tool makes it easy to flexibly combine dimension members with either measures or members of other dimensions into nested axes without using MDX programming or Flexreports. A perfect example is a report containing the previous year’s actuals alongside the current actuals and budget data. In multidimensional OLAP models, you would generally use two dimensions: the scenario (i.e. Actual, Budget) and time utility (i.e. Current, Previous year).
If you multiplied these members into a pivot table, you would get a report with four fields. One of these, however, is generally not of interest. You want to see current budget data, current actuals, and last year’s actuals. Last year’s budget, however, is only interesting if you want to analyze the accuracy of that budgeting period. As a result, you don’t need a complete cross product of the Scenario and Time utility dimensions; you need a custom combination.
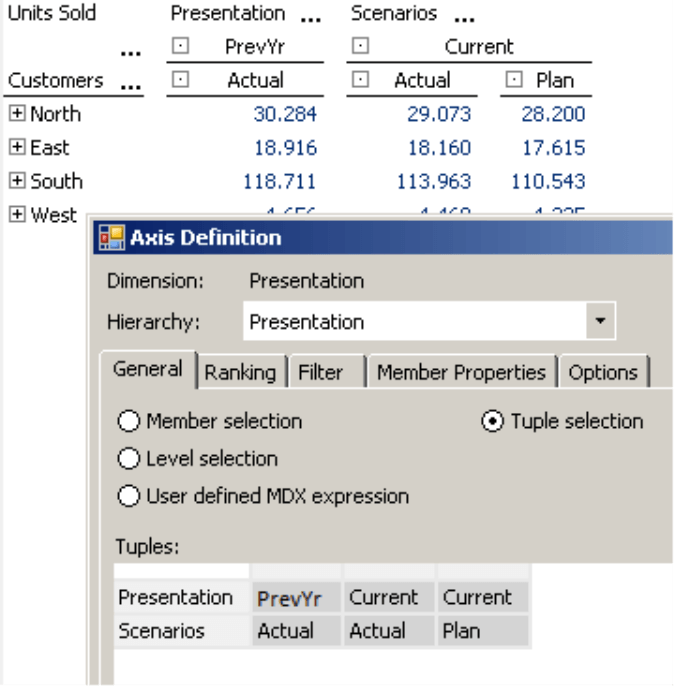
Using the tuple editor, you can perform this task easily. You can define combinations of members from different dimensions or measures – and preview the results – directly from the Axis definition. For more information about this feature, please read DeltaMaster clicks! 01/2009.
Pivot navigation – partially nested axes
The pivot navigation, which is available in Analyzer or Miner mode, uses a special type of nested axes. This tool allows you to enter further dimensions for a certain member in the pivot table step by step –without expanding all of the existing elements.
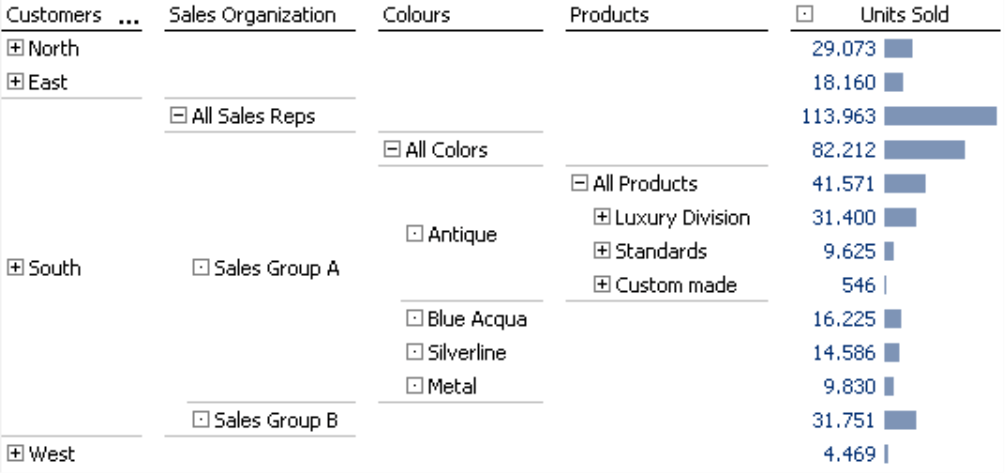
The screenshot on your right shows how the pivot navigation affects your report design. Although you are looking at four dimensions in the pivot table, the report is still relatively compact because it doesn’t just automatically combine every dimension member with the others. It only adds additional dimensions for the members that really interest you. As a result, this report only shows a breakdown by sales organization for the most important customer region – South. From here, you can observe Sales Group 1, analyze its success even further by Colors, or even see which products were sold in the most important color – Antique.
What is so special about the pivot navigation is that DeltaMaster automatically suggests this path using its built-in data mining algorithms. This helps you quickly detect the underlying causes – especially when you are analyzing variances. For more information about the pivot navigation, please read DeltaMaster clicks! 10/2007.
Questions? Comments?
Just contact your Bissantz team for more information.
