![]()
Greetings, fellow data analysts!
Let’s stick with the navigation (Pivot Navigation): Sometimes you may want to establish some sort of standard agenda within a department – a common approach how data should be analyzed and discussed. With DeltaMaster, report editors can predefine a series of analytic steps so the recipients can easily follow this common thread. When a user double clicks on a value or selects Navigate/Plus in the Analysis menu, DeltaMaster will add exactly one attribute to the table and break down (i.e. drill down on) the respective value based on this attribute. This way, the presentation is refined step by step on a predefined standard analysis path, for example, to examine revenues or cost drivers or explain variances. How do you define such a standard analysis path? We have already explained one possibility, which is to define it for and save it along with a specific report. DeltaMaster 6 offers another option: You can predefine a specific Navigation also for measures, which allows you to reflect the respective business context. We will explain how in this third part of our series on Navigating in Graphical Tables.
Best regards,
Your Bissantz & Company team
You can create one Predefined Navigation per report in both Delta¬Master 5 and DeltaMaster 6. In DeltaMaster 6, you can even define the Navigation for specific measures. This has two advantages:
- You can define the standard analysis path individually for each measure. This allows you to predefine different analysis paths e.g. for financial KPIs than for performance KPIs, for revenue items others than for expense items, or for absolute values others than for shares.
- The standard analytic path for a measure applies to all reports of the application. This simplifies the usability for report recipients: When they use the Predefined Navigation, DeltaMaster will break down the measure the same way – no matter in what report. And report editors only need to define this path once to make it available in all reports of the application.
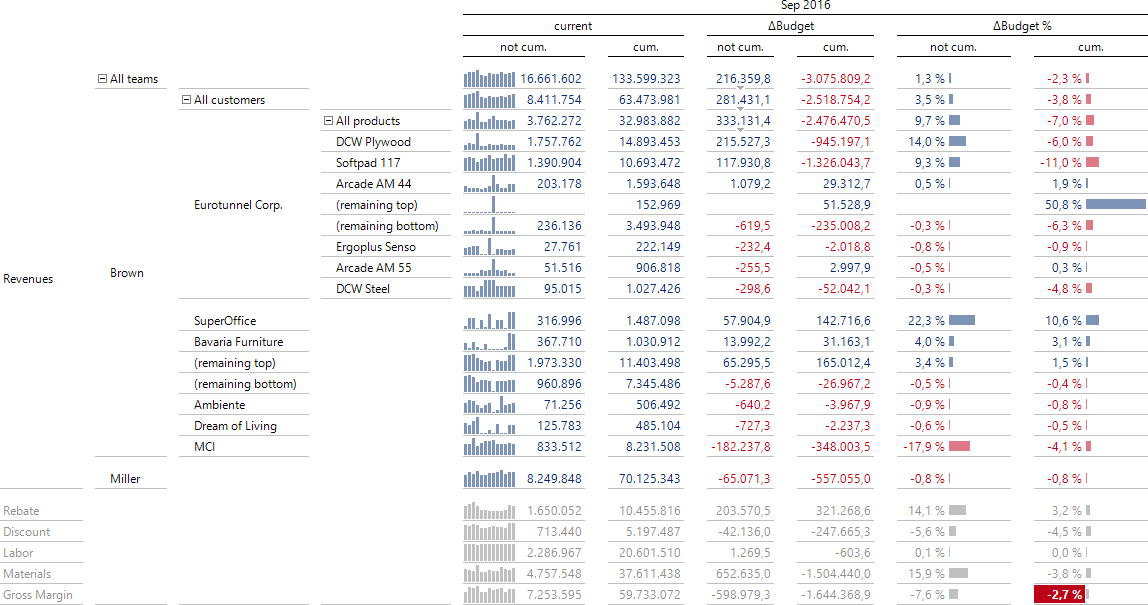
Let’s use an example from our “Chair” reference application. If you are analyzing revenues, you might want to start with sales teams, followed by customers, followed by products. In the case of material costs, however, you may want to start your analysis by colors, followed by products, followed by customers.
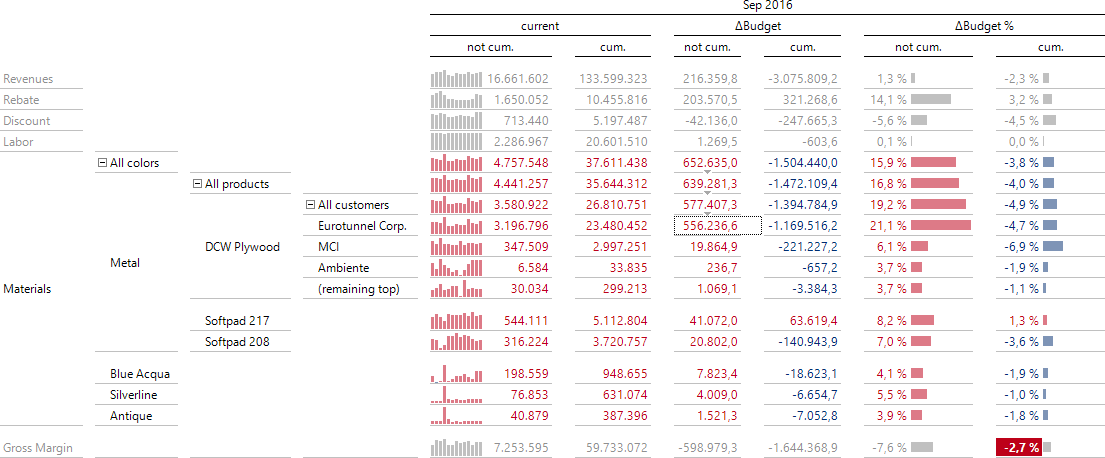
You can easily recognize the different analysis paths in the screenshots above. Of course, you could have created these views with a User-defined Navigation (using the Hierarchy Menu that is available at every value). In this case, however, the paths were predefined and run in Presentation Mode, either with a double click or by selecting Navigate/Plus. This functionality is supported in the Windows client, the Web browser, and the App for iPhone and iPad.
Defining the path with drag and drop
You can set up an analyis path in the Measure Properties. In DeltaMaster 6, you can edit these properties when Modelling, by clicking on a measure and switching to the Analysis Context/ Navigation tab. Here you can define which attributes can be used to analyze the measure (Analysis Context, left) and which attributes to offer in which order for the Predefined Navigation (right).
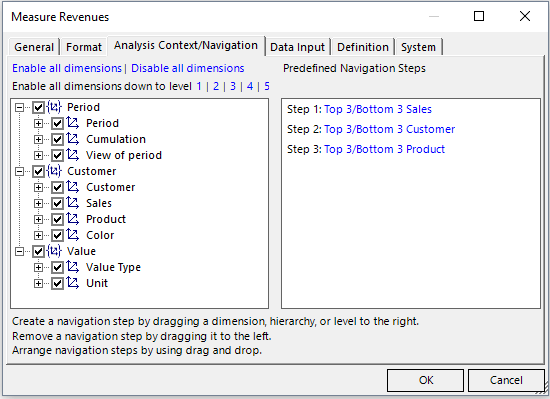
To edit the Analysis Context, use the tree structure on the left-hand side. This displays the dimension groups, dimen¬sions, hierarchies, and levels of the analysis model very similar to the report-specific Navigation Context (see DeltaMaster clicks! 10/2016) or the Filter Context of reports. If attributes are deactivated here, they will not be available in the analytic methods or in the Navigation. This includes the Predefined, User-defined, and Automatic Navigation – even when the attribute is activated in the Navigation or Filter Context of the report.
The entries in the tree structure on the left also serve as building blocks for the standard analysis path that you define on the right. The handling is very easy: Drag and drop the desired steps, arrange them as you wish, and configure them.
- Adding a navigation step: Drag the dimension, hierarchy, or level from the tree structure (left) and drop it in the field on the right. DeltaMaster will always enter a level in the path. If you move a dimension or hierarchy, DeltaMaster will automatically select a level (the first one below the “All” level).
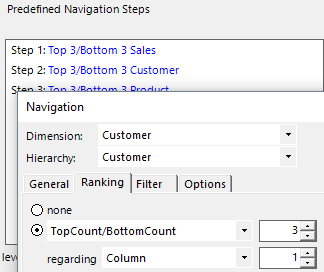
- Editing a navigation step: Select the entry (in blue font). This opens a dialog box that is derived from the Axis Definition. Use this dialog box to make detailed settings, e.g. which members to include in the step and how to display them (using Ranking and Filter).
- Sorting navigation steps: Move the entries (in black) on the right using drag and drop.
- Removing a navigation step: Move a navigation step (in black) from right to left using drag and drop.
This operation method is even faster than defining a report-specific path: First, you have to execute the navigation in the report, step by step. Afterwards, you have to save the result as a default, undo the steps, and then save the report (see DeltaMaster clicks! 05/2015). In the case of a measure, however, you can edit and save the order of the steps and the settings for the steps in a dialog box.
When you are editing a navigation step, the Ranking tab is very important. Here you define how to sort the members and if you want to limit them to a certain number. When you are analyzing variances, the most interesting options are “TopCount/Bot¬tomCount” (descending) and “BottomCount/TopCount” (ascen¬ding) because they display positive and negative variances together in the table. The column index that is used is based on the cell for which the step is run. DeltaMaster automatically selects the sort direction based on the value of the cell.
Each dimension can only be used once in the analysis path. Hierarchies with only one level and with no top member (e.g. Value Type or View of period) are not suitable because no further differentiation is possible. The levels that are included in the path should be activated in the Analysis Context (left side).
A navigation path that is predefined for a measure overrides a report-specific path. User-defined and Automatic Navigation are still possible – the predefined path is just an additional offering so report recipients can easily break down KPIs based on a standardized line of arguments.
