![]()
Greetings, fellow data analysts!
In the last issue of DeltaMaster clicks!, we showed how to use the Navigation to start an individual analysis from an existing report. This enables report recipients to work with the data on their own and transition very smoothly from an overview to the details – wherever this option is necessary or seems gainful. In DeltaMaster 6, users can navigate in every Graphical Table and also in the Presentation Mode. The Navigation becomes especially easy and efficient when the reports are prepared accordingly. In this edition of DeltaMaster clicks!, we have put together some tips – at a glance and in detail.
Best regards,
Your Bissantz & Company team
There are four starting points to prepare and set up the User-defined Navigation (Pivot Navigation) in the Presentation Mode:
- Define the Navigation Context. This allows you to control which attributes should be available in the User-defined Navigation – in other words, which entries should be available in the Hierarchy Menu offered for all data cells. The Navigation Context also limits the search area for the Automatic Navigation (data mining).
- Check the general settings. This includes setting a limit for the number of members that should be added in each step and combining the rest to residual members (“remaining top” and “remaining bottom”).
- Predefine the standard analytic path. This allows users to navigate using the Analysis Menu (Navigate: +, Auto, –) or by double clicking on a value. It doesn’t get easier than that. To predefine an analytic path, run the Navigation in the Edit Mode following the same steps that it should later use in the Presentation Mode and save this navigation step as a default. In DeltaMaster 6.1.4 and prior versions, this function is located in the Properties of the table on the Navigation tab. In future versions, you can access it as part of the Navigation of the current report in the Edit menu (on the right side of the DeltaMaster window). For more information, please read DeltaMaster clicks! 05/2015.
- Define the Analysis Context of measures. For KPIs, you can define which attributes should be available for detail analyses using the Navigation, similar as in reports. We will explain this functionality further in a later issue of DeltaMaster clicks!.
We will take a closer look at the first two points below.
Modifying the Hierarchy Menu with the Navigation Context
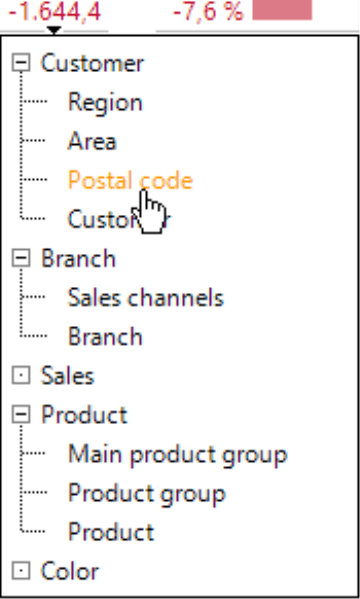
In a User-defined Navigation, users can decide in the Presentation Mode which attribute they want to break down (i.e. drill down into). DeltaMaster offers a Hierarchy Menu for this purpose. This is displayed when you point your mouse on the small, black triangle at the bottom of a cell.
![]()
A good menu setup is essential to work effectively with and build acceptance for the User-defined Navigation. The more attributes are offered the more flexibility users have in their analysis; this, on the other hand, makes it harder for them to choose which direction to take or to find the desired attribute. If users feel that the menu is too long or confusing, this is usually because the Navigation was set up too vaguely, if at all.
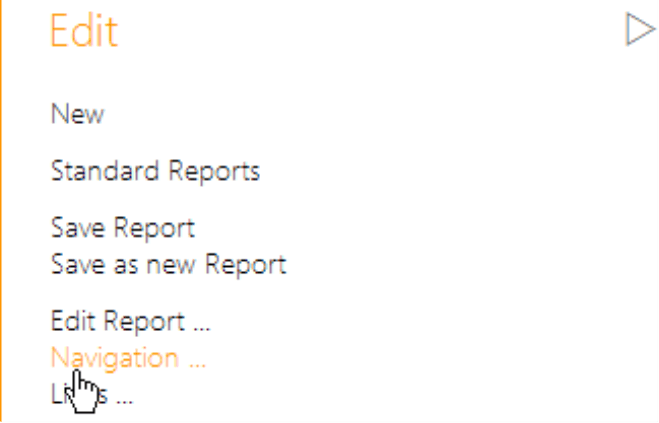
The Navigation Context allows you to fine-tune the Hierarchy Menu for a specific report. You can modify it as part of the Navigation of the current report in the Edit menu.
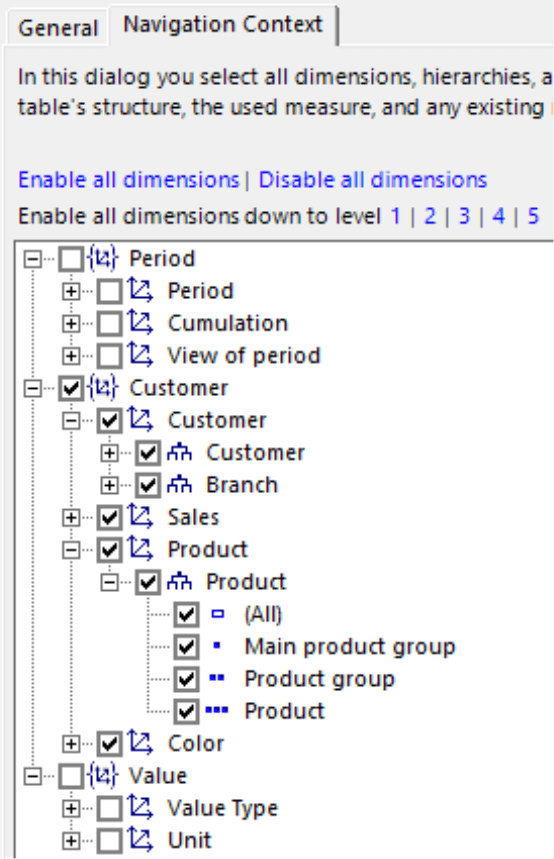
All structure attributes of the analysis model are listed on the Navigation Context tab (see screenshot on the next page):
Report editors know this tree structure from other DeltaMaster dialog boxes, such as the Filter Context (View Context) in the Report Properties or the Measure Context. By ticking the check boxes, you can activate and deactivate the respective attribute.
| |
A deactivated attribute is not available in the User-defined and Automatic Navigation and, therefore, will not be offered in the Hierarchy Menu. |
| |
An activated attribute in the Navigation Context is available, generally speaking, in the User-defined and Automatic Navigation. It can, however, be excluded because of other limitations (see section below). |
The Navigation Context is not initially limited in a new report. In other words, all attributes are activated. In large analysis models, this can lead to very long Hierarchy Menus that are hard to handle. We recommend, therefore, to always keep the Navigation Context in mind and to customize it.
When Editing, you can work with all attributes to create the Predefined Navigation because the Navigation Context is not yet in force. The limitations only come into effect in the Presentation Mode.
Navigation Context and other limitations
The Navigation Context defines the framework for analyzing data in the Presentation Mode. In actual operations, however, there are four additional factors that determine the attributes in which users (still) can navigate:
- The respective measure the user is analyzing: When Modelling, you can define an Analysis or Navigation Context for each measure, similar as you would for the report. Users cannot Navigate into attributes that are deactivated in this context – regardless if they are using a User-defined, Predefined, or Automatic Navigation.
- The filter (view) that is currently set in the Presentation Mode: Users can generally only drill down on levels below the members selected as a filter. If in a dimension, for example, a member of the lowermost level is selected as a filter for the report, no further differentiation is possible for this dimension. Accordingly, this dimension will not be offered for Navigation.
- The table setup: This also applies to members that have become part of the report through a Level or Member Selection in the Axis Definition.
- The Navigation steps that were previously taken: Finally, the Hierarchy Menu gets smaller with each Navigation step taken because each level can only be used once.
In contrast, the Filter Context (View Context) from the Report Properties only has an indirect influence on the Navigation. It determines which possibilities for changing the filter (view) of the report are available in the Presentation Mode. This, in turn, can mean that a certain attribute is available or not for Navigation. The Perspectives (see DeltaMaster deltas! 6.1.3, feature #9) only have an indirect effect on the Navigation as well.
Better few but thought-through
Our recommendation: First deactivate all dimensions using the respective link and then activate the three or four dimensions that users will most frequently need in the report. Just select the most important ones – no more, not too many, and not everything that someone might need at some point in time. This applies to dimensions as well as (parallel) hierarchies and their levels. It is often not necessary to drill down, for example, to the lowest level of material or customer master data in all reports.
The Automatic Navigation also profits from a narrowly defined Navigation Context: Fewer dimensions, hierarchies, and levels mean that the data mining algorithm needs less time for calculation – and delivers results faster.
Checking the general settings
It also is worth the time to check the other settings for the Navigation. The General tab offers three options as explained below.
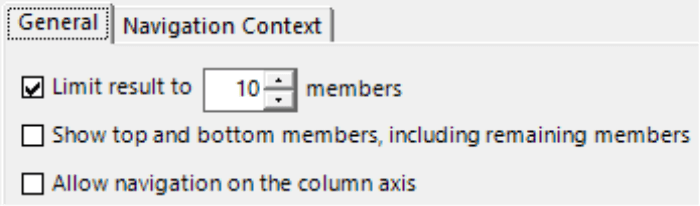
- Limit result to “x” members: This limit ensures that the Automatic Navigation only displays the “x” largest or smallest or the largest and smallest members. This “x” also serves as a default limit for the Ranking in a User-defined Navigation. If necessary, you can deactivate this limit to enter all members in the table. This, however, often leads to excessive results and should only be done in special cases. We strongly recommend limiting the results. The default setting is 10 members, but 5 – maybe only 3 – often suffice.
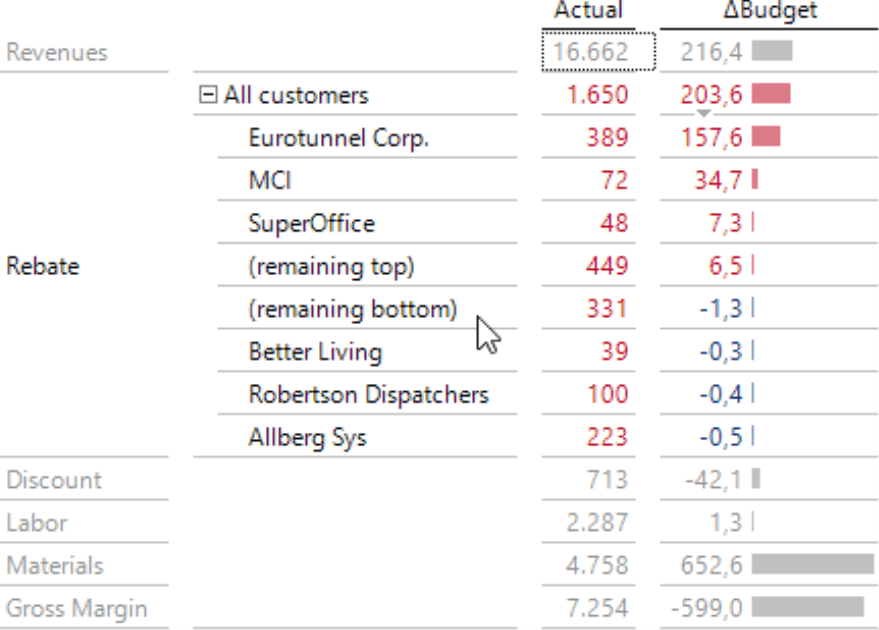
- Show top and bottom members including remaining members: This is especially interesting when users analyze variances in the report. If the option is activated, DeltaMaster will calculate the largest positive values (“top”) and the strongest negative ones (“bottom”) and insert them together in the table. At the same time, it will combine the remaining members with positive and negative values and display them as “remaining top” or “remaining bottom”. For more information, please read DeltaMaster deltas! 5.5.8, feature #13. In order for this to work, the aforementioned option that limits the result must be activated and the application must run on an MDX OLAP database (e.g. Microsoft Analysis Services or SAP BW). For further tips on how to compare positive and negative variances in the same report, please read DeltaMaster clicks! 02/2015.
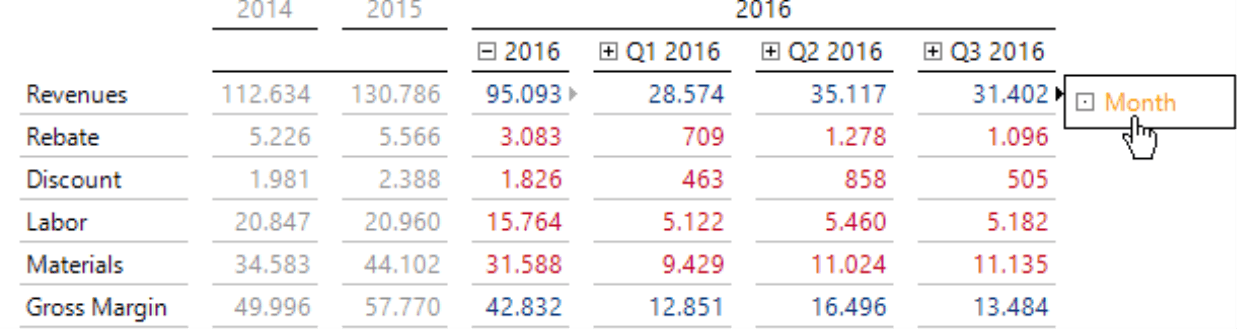
- Allow Navigation on the column axis: If you activate this option, DeltaMaster will show the small black arrow that you click to display the Hierarchy Menu not only at the bottom but also to the right of the data cells. This allows users to expand the table on the column axis. In certain data scenarios, this can make sense – for example, if you want to break down a year’s value by quarters or months. Most reports, however, are designed so that the differentiation works better “downwards”. That is why the Navigation “to the right” is deactivated in the default setting.
Using these general options and the Navigation Context, you can prepare each Graphical Table so it is easy to use in the Presentation Mode. You and your users can then explore this data in a clearly defined environment – a common requirement in Self-Service BI.