![]()
Greetings, fellow data analysts!
Each spring, both professional and hobby gardeners are busy pruning their fruit trees so that they will have a bountiful harvest in the months to come. The perfect cut is a science in itself, and it can take months until they reap the fruits of their labor.
What is useful to a gardener can inspire analysts as well. We are referring, of course, to DeltaMaster’s hyperbolic tree, which is available to professional Miner users as well as Viewer, Pivotizer and Analyzer users with a special license. In this edition of clicks!, we will teach you how to trim branches that you don’t need and other important pruning techniques for the hyperbolic tree. Best of all, you can immediately harvest your results!
Best regards,
Your Bissantz & Company Team
One of DeltaMaster’s most eye-catching features is the hyperbrowser, which visualizes the analysis model as a so-called hyperbolic tree or simply hypertree.
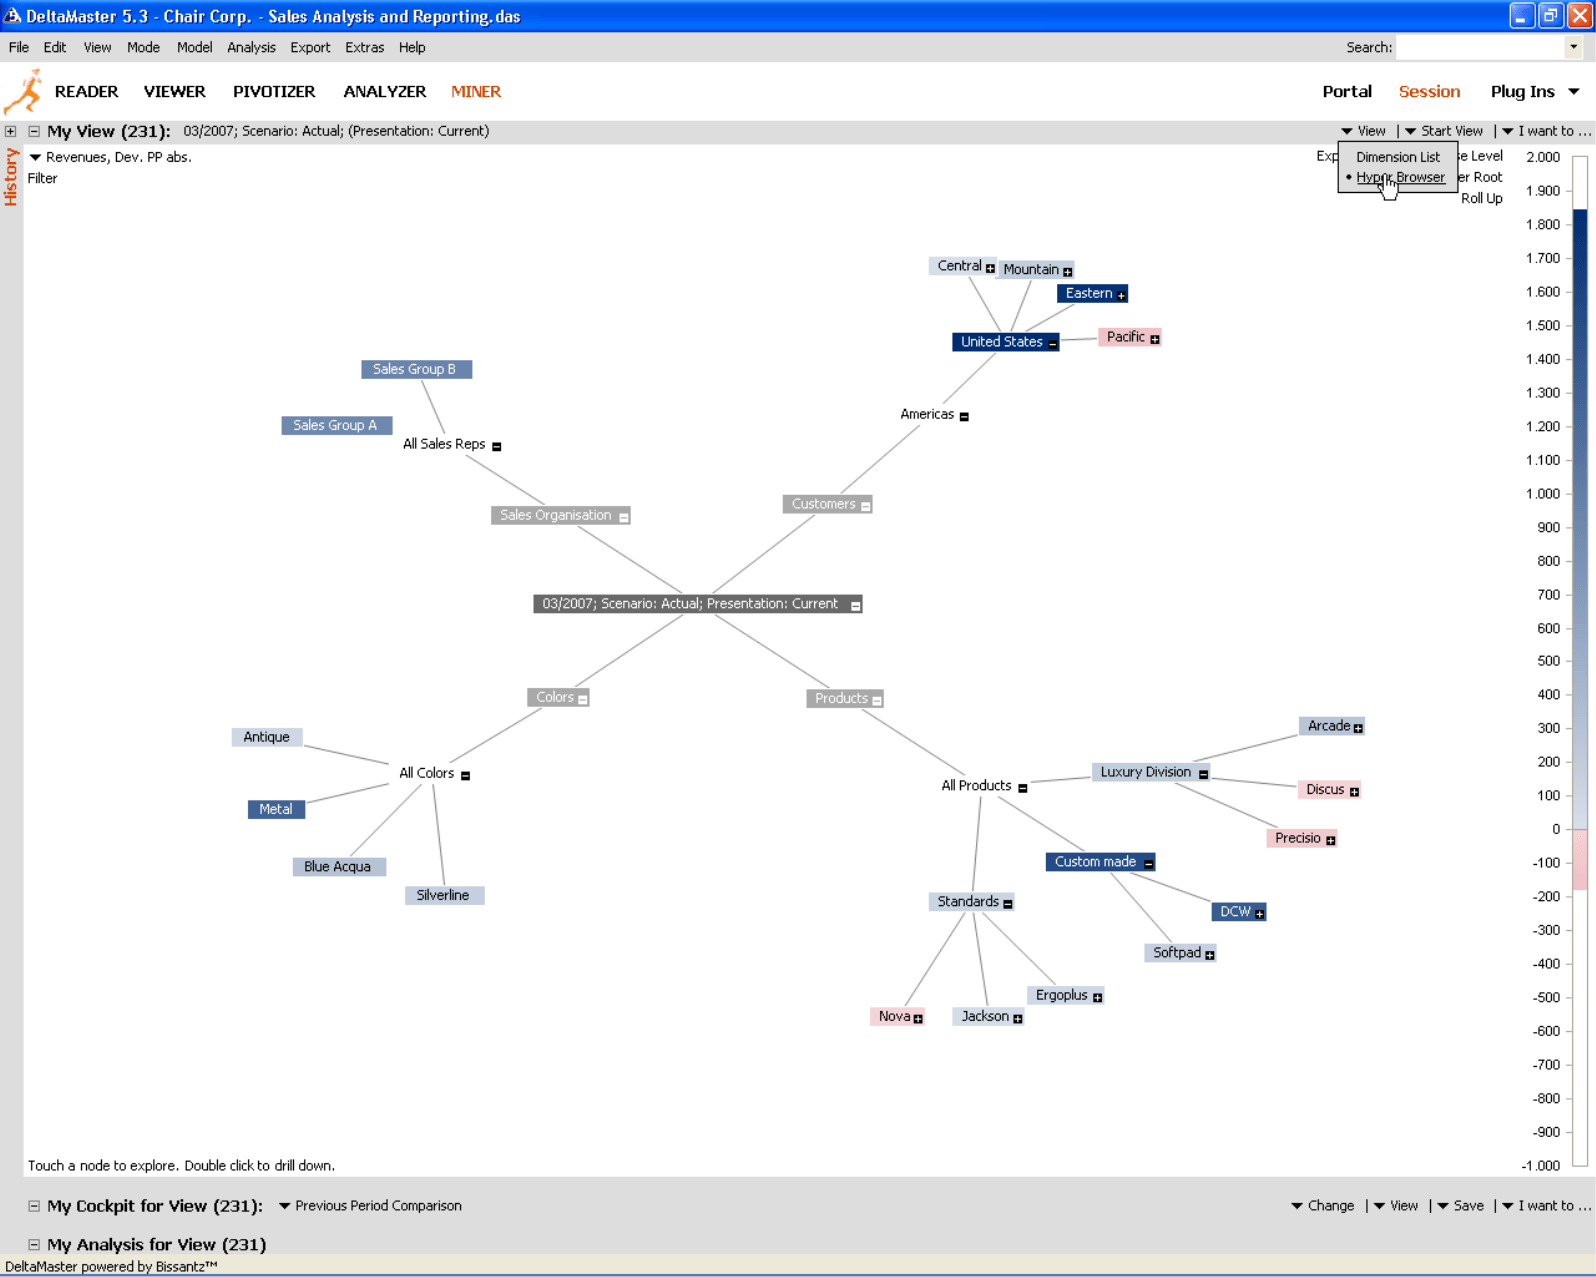
The more dimensions and members that your model has, the more crowded your screen will be. Sometimes, however, you don’t need to view the entire data model; you may just need a few select dimensions. How can you prune your hypertree to simply display the information you want? That works in one of two ways: by either selecting members or limiting the analysis context.
Choosing dimensions by selecting members
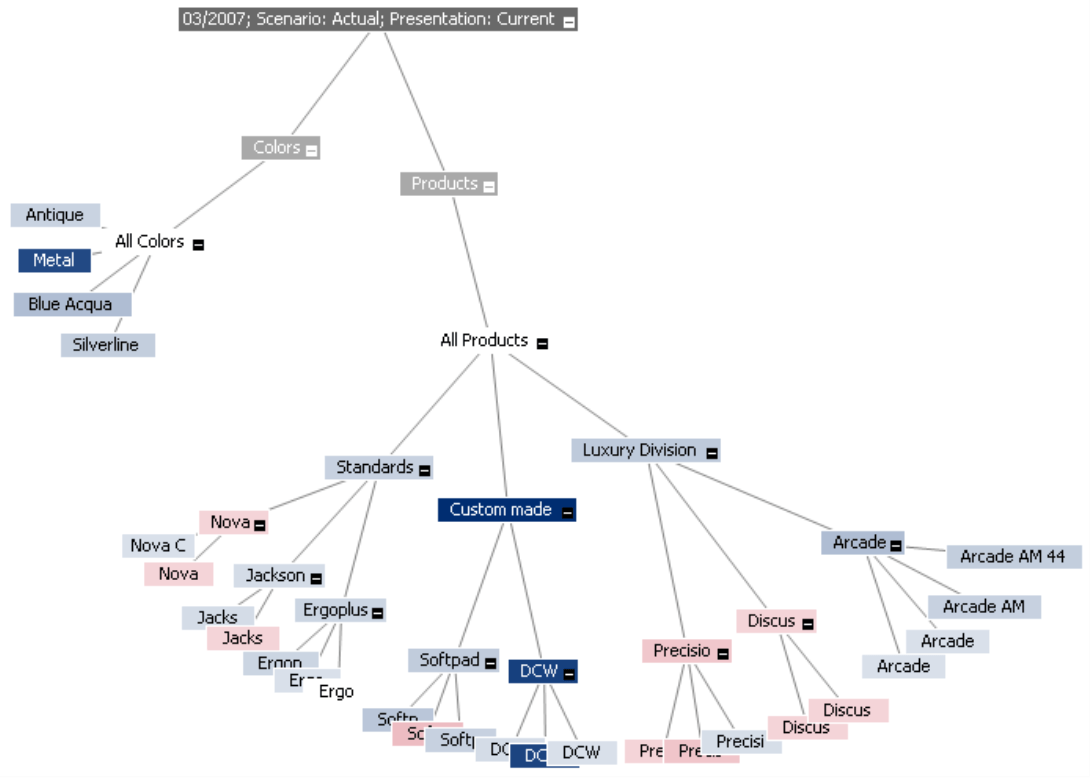
If you have selected a member on the lowest level of a dimension, DeltaMaster will hide the entire branch and display this member in the center of the tree. In the screenshot above, this is the case for the current month (03/2007), scenario (Actual) and presentation (Current).
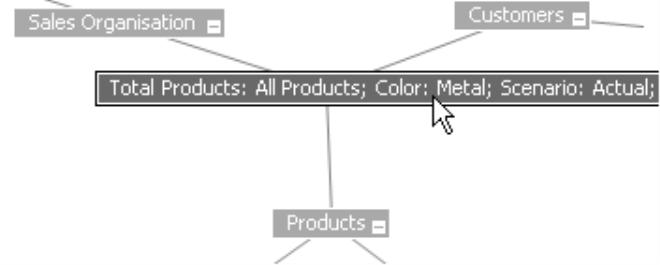
By double-clicking on “Metal“, you can select the member just as if you had chosen it from the Dimension browser. Since this member has no underlying objects, DeltaMaster will move Metal into the center node and hide the Colors branch.
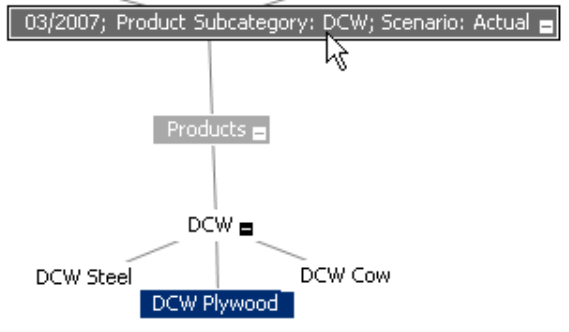
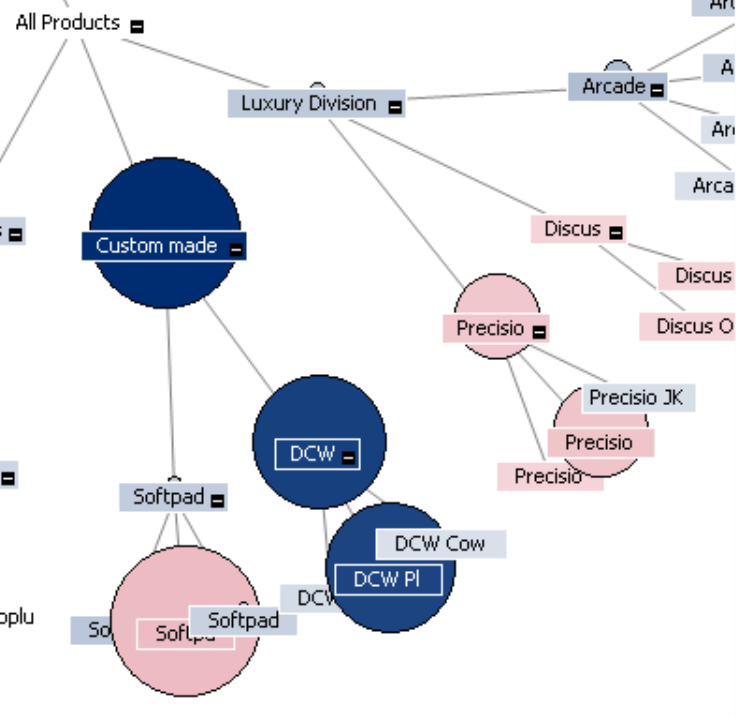
If a member has children, DeltaMaster will shorten the branch accordingly and hide the neighboring branches on the same level. By double-clicking on the subcategory “DCW“, for example, the Standards and Luxury divisions will be hidden completely and you will only see the Custom- made models starting with DCW. This is noted in the center, or root, of the hypertree.
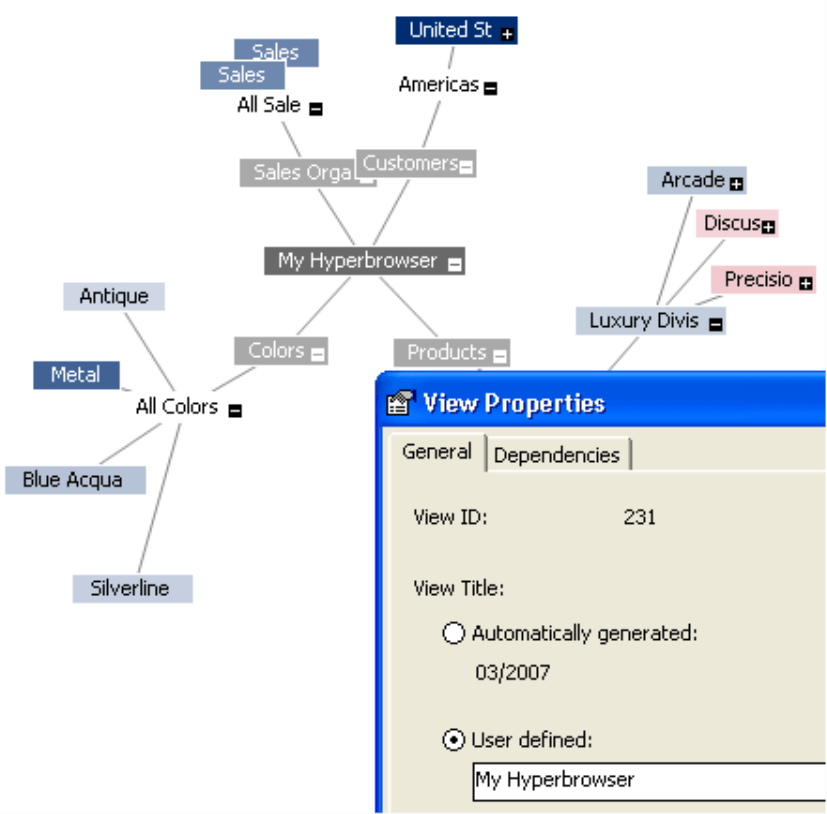
If you have selected the view this way for several dimensions, the center node will probably have a very long name. You can change this name under the View properties which are located in the History window (see DeltaMaster deltas! 5.3.4, Nr. 16 for more information). If you enter a user-defined name for these properties, this will appear in the root of the hypertree instead.
Each fine-tuning measure is the equivalent of a drill-down, which you can undo at any time by clicking
the Roll-up link in the upper right-hand corner of the window.
Regardless if the hypertree uses color-coding
(as displayed in the screenshots above) or not,
the usability will be the same.
Choosing dimensions using the analysis context of a measure
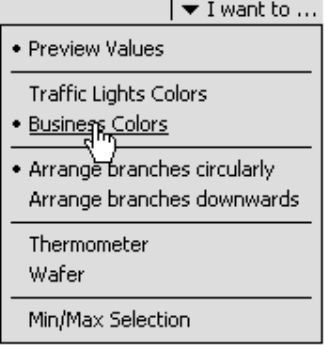
You can also use measures to determine which dimensions should appear in the hyperbrowser. To add one to your view, simply drag the desired measure from a cockpit or the tabular result view of almost all analysis methods and drop it into the hyperbrowser window. Alternatively, you can activate the Business colors in the context or I want to… menus. When these are on, you can Select a measure from the small menu in the window’s upper left-hand corner. In place of Business colors (scales of red and blue), you can also choose Traffic light colors. As far as colors are concerned, Business colors are the better choice for absolute values because the different nuances of red and blue help you to instinctively recognize rankings, which is not the case with a red-yellow-green traffic light. The latter is best used to visualize deviations (e.g. actual vs. budget or current vs. previous year).
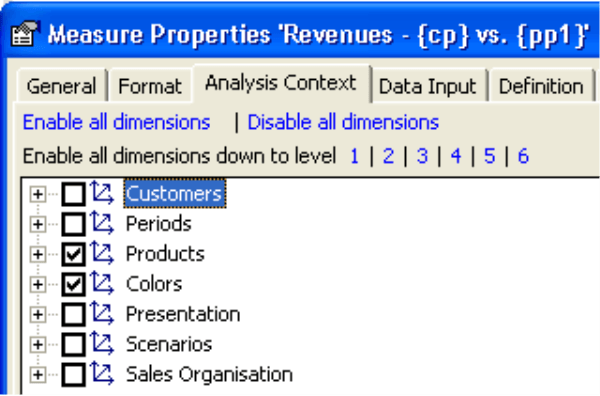
Each measure has a so-called Analysis context, which you can modify in the Measure properties. The dimensions that you deactivate here will not appear in the hyperbrowser.
Therefore, if you want to analyze the revenue variance for Products and Colors to the previous period, just deactivate the other dimensions. You can access the measure properties, for example, in the context menu of the measure name in the upper left-hand corner of the My view window.
Please note, however, that the limited analysis context also applies to the analysis methods. To avoid unwanted results, you may want to create a copy of the measure [e.g. Revenue variance (hyperbrowser)] where you modify the analysis context for the sole purpose of hyperbrowser analysis. You can copy a measure by opening the Measure browser (Model menu) followed by the I want to… menu, and then selecting the Create new measure option. Then, choose a user-defined measure (e.g. Algebra), select the desired measure as the sole Base measure, and enter #1 as the MDX expression.
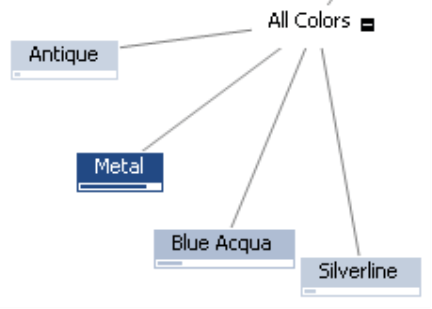
The hyperbrowser now only shows the dimensions that you have selected. The picture on your right illustrates the Branches downwards option located in the context or the I want to… menus; branches arranged circularly is the default setting.
Further options
Speaking of options, the hyperbrowser doesn’t really need that many. You don’t need set any thresholds to color code important things in your data, and the entire tree is based on the data structures in your analysis model. This is the true advantage of this function. It does its job without any parametrization! The context and I want to… menus, therefore, are very short.
We have already explored a few of these options. The others are:
- Preview Values: When you mouse over a node, DeltaMaster will automatically adapt the current cockpit to this view (analytical preview). This feature is very useful because you can quickly view measures for various views by mousing over sales regions, customer groups, etc. in your dashboard. In other words, you don’t even have to click your mouse to get the information you need.
If you want to use the hyperbrowser without the cockpit, however, this sensibility can be irritating. In this case, simply deactivate the preview values option which links the hyperbrowser to the cockpit. When you mouse over a node, you will still see the numerical value in the upper left-hand corner and as well as a small black line in the scale on the right-hand side; DeltaMaster, however, will not recalculate the cockpit every time you move your mouse.
- Thermometer: This feature allows you to visualize how the value of a node relates to the others. DeltaMaster uses a filled bar to signalize the largest individual value of the tree. The smallest, in turn, is empty; the others are filled proportionally.
- Circles: As with the Thermometer, DeltaMaster can display differences in size through smaller or larger circles drawn behind the node. Although the thermometer and the circles do not add additional information, they emphasize what the colors symbolize.
- Min/Max selection: DeltaMaster highlights the smallest and largest value in the tree with a thicker border.
Hyperbrowser for Viewer, Pivotizer, Analyzer modes
The hyperbrowser is a built-in component for Miner users – and can be integrated into Viewer, Pivotizer and Analyzer modes as a separate licensing option. As a result, even report consumers can benefit from this smooth, data-driven navigation in their dashboards and reports. Just contact your Bissantz team for more information!
