![]()
Greetings, fellow data analysis!
Most avid tea or coffee drinkers understand the value of a good water filter. In fact, consumers spend millions each year on special filter cartridges, pitchers or other distilling paraphernalia. And most have grown so accustomed to this purified state that they only really notice the difference when they have to resort to plain-old tap water.Filters, however, can also help purify the results in analytical reporting. In this edition of clicks! we will show you how to remove unwanted data deposits and deliver refreshing results using DeltaMaster’s wide range of filtering techniques!
Best regards,
Your Bissantz & Company Team
Filters are commonplace in a world filled with multidimensional data. Your reports should show meaningful (and hide irrelevant) information in any given context. DeltaMaster supports this task through a variety of filtering options. You are using a very basic filter, for example, when you select members in the My view window. This edition of DeltaMaster clicks! will explore three advanced filters: user-defined filter measures, as well as filters for numerical values and member properties in cockpits and analyses.
Filter measures
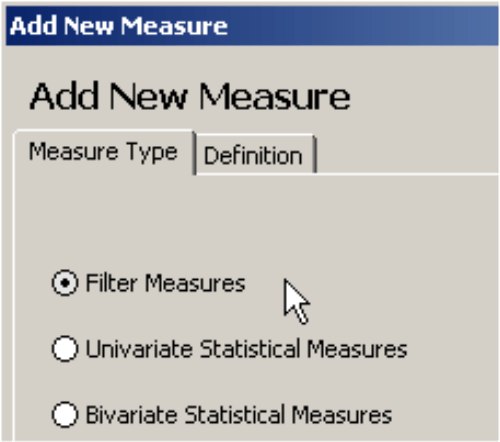
In DeltaMaster analysis sessions and models, you can use a wizard to create new measures for use in analysis, reporting and planning. This wizard is located in the I want to… menu or the context menu of the Measure browser (Model menu). We will also explain how to let DeltaMaster create new filter measures automatically.
A filter measure basically “freezes” a member in one or more dimensions and returns the value of the Base measure connected with these settings. (If you use Variable filters, you can also select several members.)
You can use these filters to observe proportional relationships such as revenue breakdowns by customer groups. The calculation is simple. You simply divide the revenues for a given group by the revenues for all groups. The total is computed automatically by the OLAP server: they’re in the same hierarchy, just one or more levels higher. If you use this sum as a new measure, you can then use it in another Quotient measure. (Although there are many different ways to do this, we will continue to use this example to explain the concept of filter measures in more detail.)
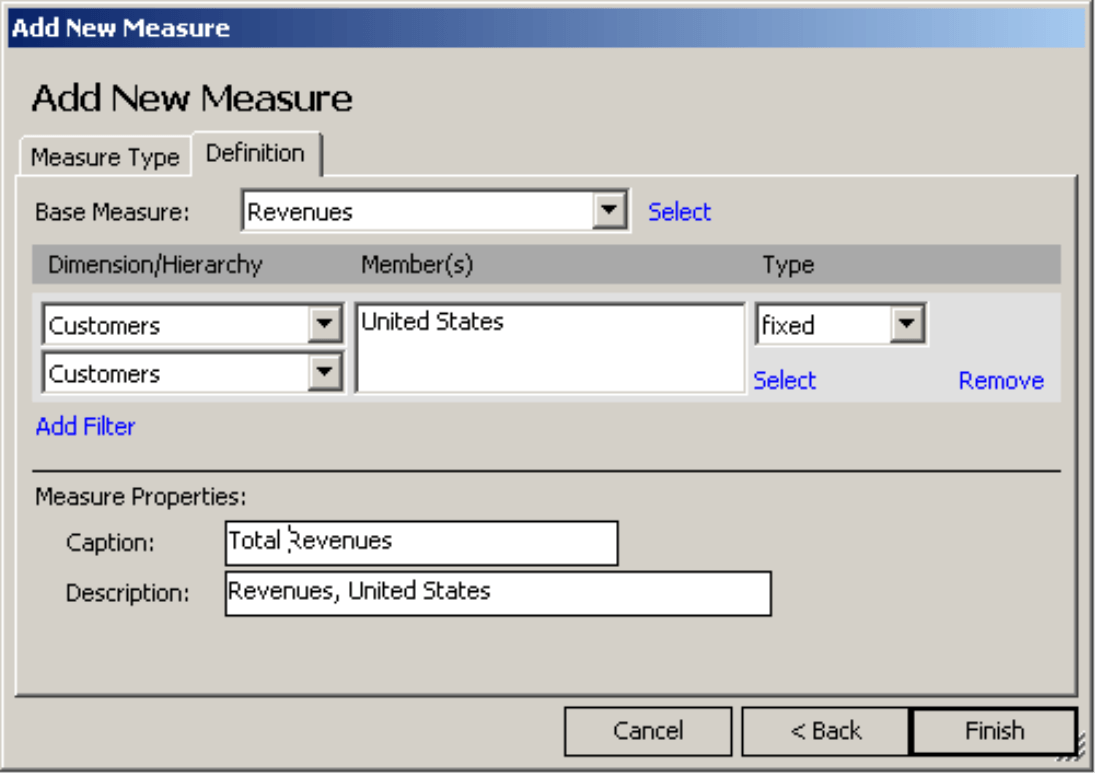
On the screenshot to your right, the “revenues” column shows the revenue breakdown by region. The “total revenues” column, however, has a constant value because it was created using a fixed filter on the top member of the customer dimension (see “Add new measure” screenshot above). Although you would never waste a whole column on a sum in a real application, this example illustrates that revenues divided by total revenues equals the “revenue share” in each row. This is a Quotient measure, which was also created in the Measure browser. Since you have limited “total revenues “ to the customer dimension, the table would change to another period along with the view, but will still only deliver the sum across all regions or customers. As described in DeltaMaster clicks! 2/2005, you can also Add filters across several dimensions or use filter measures as a basis for additional filters.
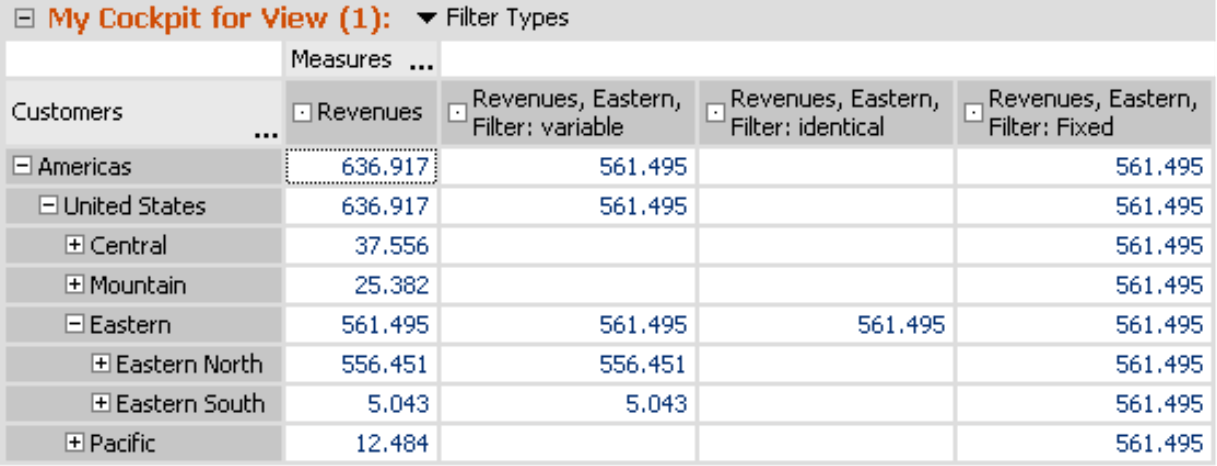
Let’s take a closer look at the variable, identical and fixed filter Types. In order to compare the impact of these options, we will create three new filter values. Each filter will have a different Type but the same Base measure (revenues) in the same Dimension and Hierarchy (customers) against the same Member (Eastern).
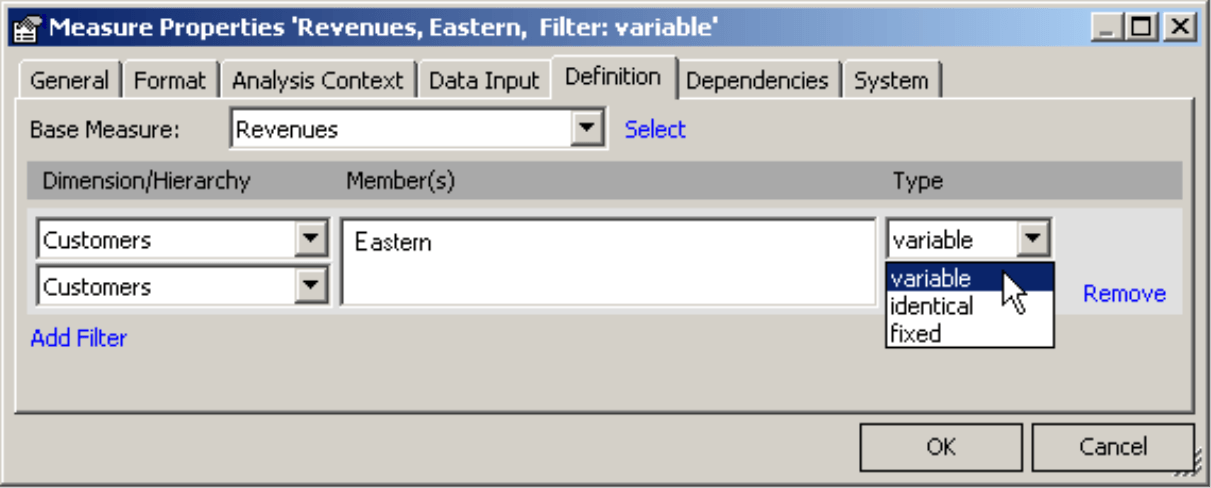
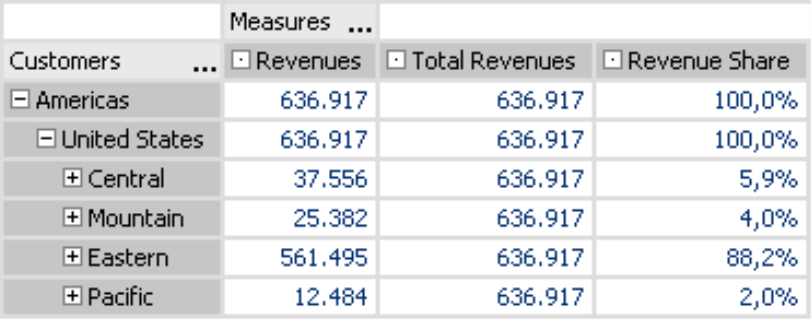
The pivot table above shows these three filter measures with the same base measure. To your right is the fixed filter measure as in our example showing revenues breakdowns. This shows the customer revenues in the Eastern time zone for all members. Since this type of filter is most commonly used, it also serves as the default setting when you select a base element as a filter criterion. An identical filter, which is used in the second column your right, only contains a value for the selected member. The variable filter shows the respective values for the selected member (Eastern) and for all members within the branch (Eastern North and Eastern South); on higher levels within the hierarchy (United States and Americas), you will see the value of the selected Members (Eastern); for all siblings of the member (Central, Mountain, Pacific), however, the result is empty. The left column contains unfiltered base measures, in this case, the revenues for each member. (On a side note, can you split the column headlines into two rows by simply inserting two empty spaces anywhere within the measure name.)
Automatically creating filter measures
The sections above explain how to create a new filter measure manually. You can, however, also have DeltaMaster create these measures automatically.
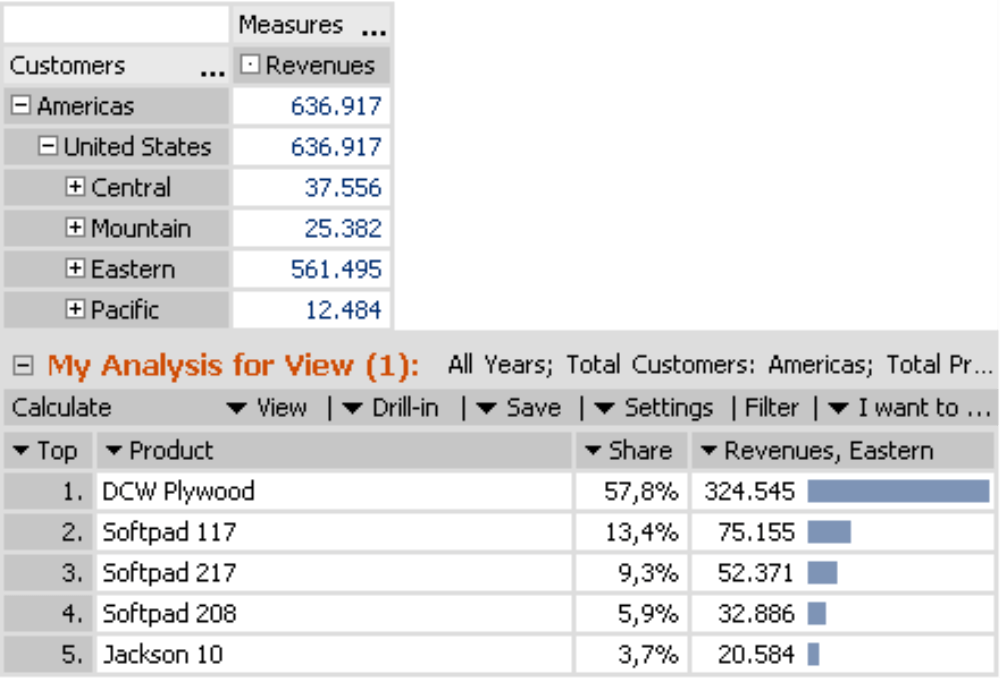
This occurs, for example, if you drag and drop a number from a pivot table into your analysis. If you drag the cell value 12,484 from the Pacific time zone into the ranking module, for example, DeltaMaster will automatically generate a new measure called “Revenues, Pacific“ (provided it doesn’t already exist). This measure is defined as the “Revenues” base measure filtered with the “Pacific“ member in the “Customers“ dimension. If multiple dimensions intersect the cell that is being searched, they will all be added to the filter. This also applies the other way around. You can create a new measure by simply dragging the “DCW Plywood“ row back into the cockpit (see the screenshot on the previous page) to create a filter “Revenues, Pacific, DCW Plywood“.
You also create new measures if you convert a pivot table into Flexreport. If the table is large, however, you will create many new measures. To avoid this situation, you can opt to Convert to Flexreport with cell references in the Change menu of the My cockpit window.
Numerical filters
The filters explained in the previous sections are designed to create new business views which you can expand – not to mention question, calculate, visualize and plan – in the analysis model or session. Numerical filters, on the other hand, determine which objects should be displayed in a report. These filters, for example, suppress trivial information or outliers to show what is really important. In other words, these filters determine what should be in your report – not what should be kept out.
Numerical filters are available in pivot tables and charts (![]() ) as well as the following analytical modules:
) as well as the following analytical modules:
Ranking
Cross Table Analysis
Portfolio Analysis
Geo Analysis
SQL Drill Through
Distribution Analysis |
Regression
CompClass
Concentration CompClass
PowerSearch
Comparator
Association Analysis |
![]()
In a pivot table, you can set the options for filter rules in the Axis definition. In analyses, you can either directly select the Filter menu from the My analysis window or the respective tab under Properties.
Each filter rule refers to a Measure and uses a selected Operator to compare it with a given Value. Under Type, you can select if the comparison should be done with an absolute value (e.g. revenues > 100,000) or with a percentage of the view total (e.g. revenues > 3% of the “Eastern” region). By clicking Active, you can temporarily activate or deactivate a filter rule without deleting it.
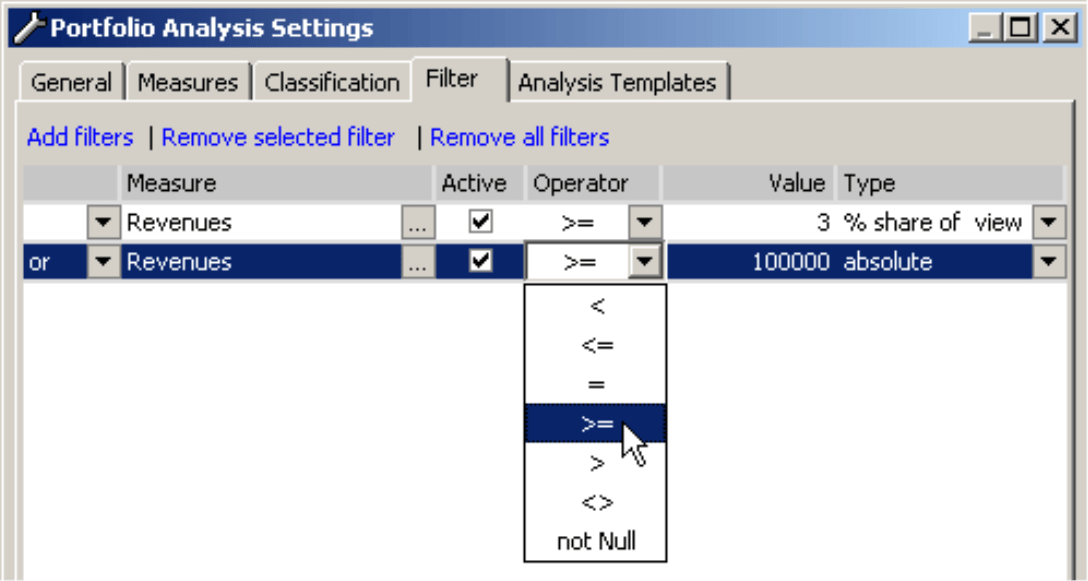
As soon as you Add a filter, DeltaMaster will display an additional column. In this field, you can determine if the rule should be connected to the previous one with a logical AND or OR.
If you are working with a Ranking or PowerSearch, you have one additional option. Here, you can choose if additional measures should be Visible as a separate column in the table. If the Active mark has not been checked, the Operator, Value and Type will not be relevant.
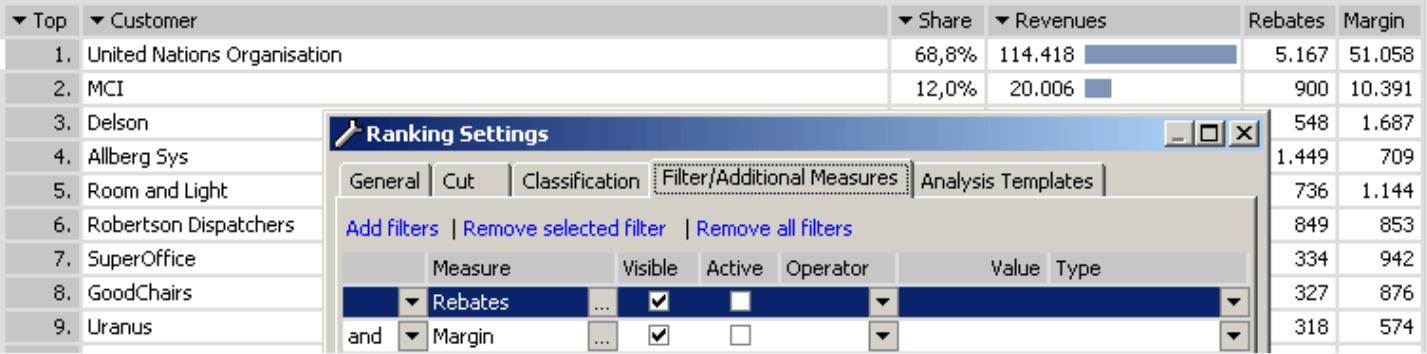
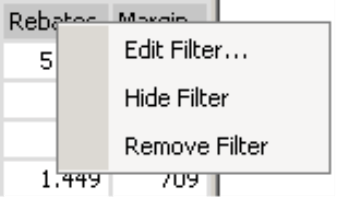
Instead of using the filter properties dialog, the faster alternative is to hold the Ctrl key and simply drag them from a cockpit into the analysis window. Using the context menu of the column headlines, you can quickly edit, hide (equivalent to deactivating the Visible option) or remove the filter permanently.
Filter for member properties
Since DeltaMaster 5.3.3, you can filter member properties in pivot tables as well (Member properties, Attributes). You can assign a filter for member properties under the Axis definition in the lower section of the Filter tab. In the Level/Member property column, DeltaMaster will list all attributes that are available for the selected dimension (if you use Microsoft Analysis Services, these attributes will be grouped by hierarchy levels). Since member property values usually contain text (compared to measures, which are always numbers), the list of operators also includes relevant commands for filtering words.
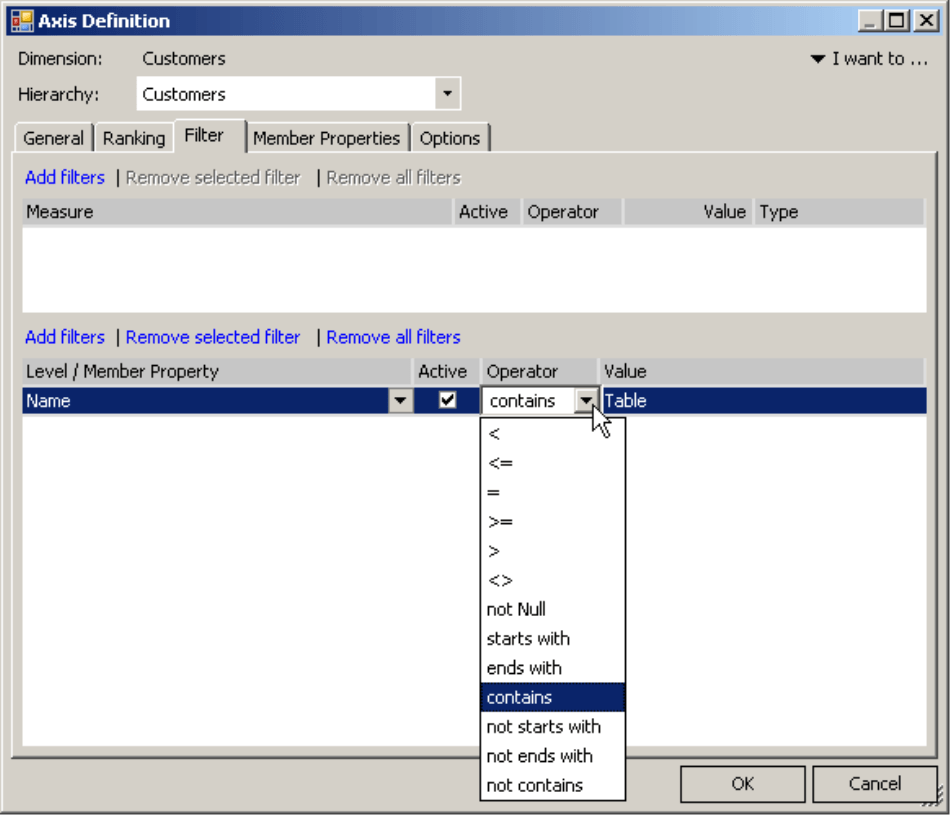
To create a value for comparing words, you can combine one or more strings using commas as delimiters. How DeltaMaster interprets these texts depends on the type of comparison (i.e. negative or non-negative):
- Negative operators (i.e. not starts with, not ends with, not contains) connect the words with AND statements. For example: If the filter rule is “not starts with Central, Eastern“, DeltaMaster will eliminate Central North and Eastern south but show North and South because it will only return members that NEITHER start with Central nor Eastern.
- A non-negative (starts with, ends with, contains) connects the words with OR statements. For example: If the filter rule is “starts with Central, Eastern“, DeltaMaster will show Central North and Eastern south but eliminate North and South because it will only return members that start with Central OR Eastern.
If you choose to define numerical filters for Measures as well as filters for Member properties, these will be connected as AND statements. In other words, the conditions listed in both the upper and lower parts of the Filter tab must be met at the same time.
A popular usage scenario for member property filters is filtering out “undefined” members left over from import processes. Although this information can be helpful in improving the ETL or modeling process, it is absolutely unsuitable for board briefings. You can also easily make multiple selections. If you need to calculate the revenues for a list of customers, you can connect the customer numbers or names with commas and use them as a comparative value in a rule.
Questions? Comments?
Just contact your Bissantz team for more information!
