![]()
Greetings, fellow data analysts!
If someone asked you for a quote on statistics, you probably wouldn’t have to think long and hard to come up with something. And even though these sayings aren’t always true, the fact is that statistics don’t fare well most of the time. People are sometimes skeptical about the integrity of the underlying data, the statistician or the even the statistical methods that were used – and this often leads to more criticism than consent.Yet despite all of the cynicism, we still need statistics. What we mean, however, aren’t necessarily reports containing pure numbers – which can be valuable even if they don’t contain a clear message. We’re talking about a collection of mathematical methods that allow us to describe – and later discuss – a large number of objects using just a few figures. Tried-and-true measures such as averages, standard variances and minimum/maximum values can provide essential insight into our numbers. In this edition of DeltaMaster clicks!, we’ll show how you can easily integrate statistical measures into your DeltaMaster reports as well as how you can create and work with your own custom-made measures
Best regards,
Your Bissantz & Company Team
With a dash of statistics you can quickly spice up your reports. And depending on the question at hand – such as the average contract volume, smallest /largest number of delivery list items, number of customers who placed orders in the current quarter, or simply standard deviations and variances – this information can be very important as well. For tasks such as market research or risk analysis, summarizing a large number of values into a few distinct measures is even essential for a real discussion.
As you already know, DeltaMaster has a vast, built-in library of methods and tools for working with statistical, business and technical data. In many cases, these statistical methods do their magic in the background so that you don’t even have to think about them. Sometimes, however, you have to bring statistics to the forefront and create statistical measures so that you can report them and use them to create further calculations.
In this edition of DeltaMaster clicks!, therefore, we’ll introduce and compare two different concepts for working with statistical measures in your reports and analyses.
In pivot tables: row, column and table aggregations of display values
With DeltaMaster, you can easily add rows or columns containing statistical values to a pivot table. These Row, Column and Table aggregation functions are available in the context menu – for all user levels from Offline reader to Miner expert. You can even add these during a DeltaMaster slide show (i.e. started by hitting F5 key).
The aggregations summarize the displayed values by columns or rows. You can also choose one or more of the following statistical functions: sum, count (i.e. number of values), average, variance and standard deviation; minimum and maximum values; share (i.e. percentage of the respective row’s or column’s sum in relation to the sum of all values in the table). If you activate the Table aggregation, DeltaMaster will show the respective measures in both rows and columns.
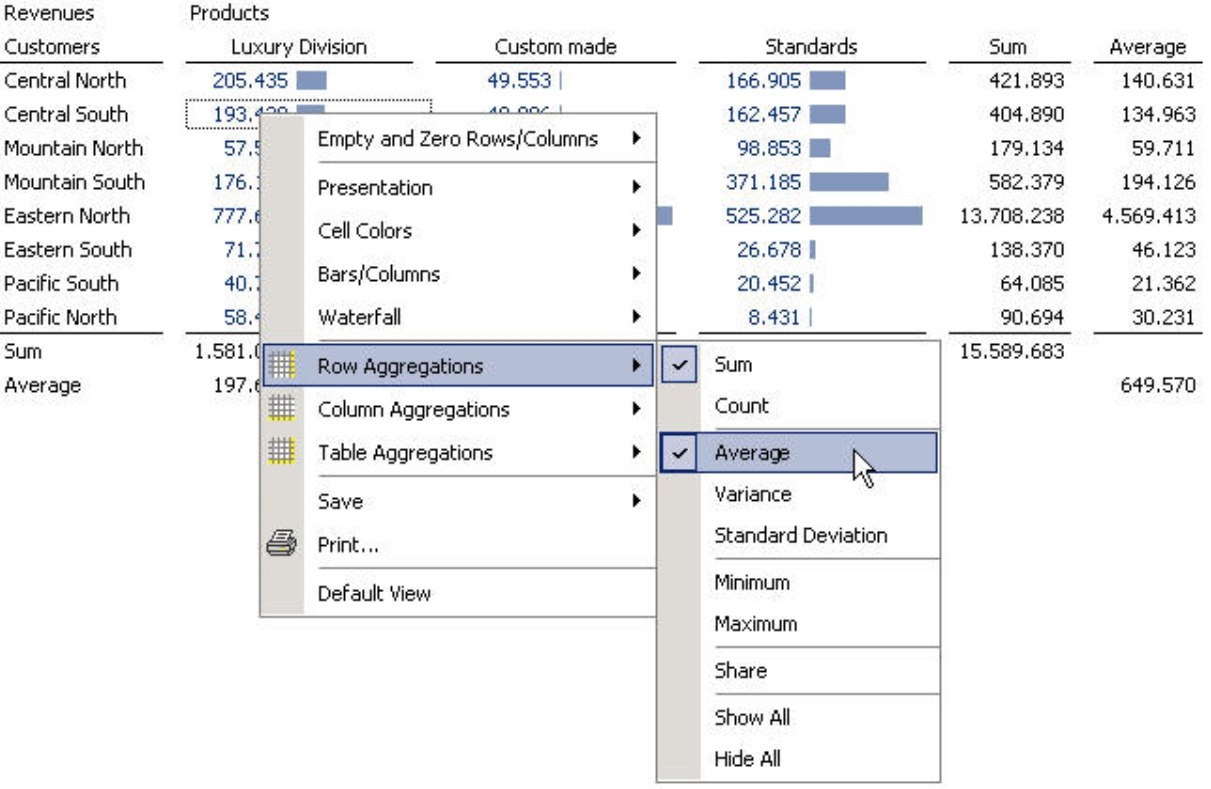
The calculation refers to the values that are displayed in the rows or columns. If the rows contain an ‘open’ hierarchy, therefore, it wouldn’t make sense to create a sum of the values across all rows of a column because the subtotals would be added twice. A separate Column aggregation wouldn’t be necessary either because DeltaMaster already displays the sum through the hierarchy.
Statistics with depth: Measures for statistical calculations in OLAP models
Using the aggregations above, you can enrich existing reports with useful statistical information. In other cases, however, the statistical measures are the focus themselves. Before you can create a report, therefore, you have to first ‘condense’ your data into a few key measures.
In DeltaMaster, you can generate new measures for your data model – not just your current report. As you’d expect, you can then analyze and report these measures using the full functionality that DeltaMaster offers.
To Create [a] new measure, simply select the respective function in the Model menu (main tool bar) or from the I want to… menu in the Measure browser. This will open a wizard which allows you to create different types of measures. In addition to Quotient measures (relative quantities), Filter measures, and user-defined MDX calculations, you can also generate measures to analyze gross margin flow or other statistical KPIs.
In this dialog box you can also create Univariate and Bivariate statistical measures. As the name implies, univariate measures examine a single variable, for example, revenues. The generated measures, therefore, describe a base measure in a certain dimension. Some examples include the count, minimum, maximum and average – each calculated for both a particular base measure (e.g. revenues) and dimension (e.g. products). In contrast, bivariate statistical measures describe two variables, or more specifically, the relationship between two variables such as revenues and discounts.

For simplicity, we are going to focus solely on univariate statistics; the way you work with bivariate measures, however, is identical. Simply select (Univariate) statistical measures for the measure type and then click on the Definition tab.
The Definition tab is divided into three sections. First, you select the desired Base measure and Dimension level. The statistical measure that we generate will deliver a summary of the members for this selected level. This concept will be explained in detail on the following pages.
In the example on your right, we selected ‘Revenues’ as the Base measure. Now, we want to examine the ‘Products’ Dimension and the ‘Products’ Hierarchy (for now) on the ‘Product’ Dimension level.
In the center of the dialog box, DeltaMaster offers a wide range of statistical functions. We will explain each of these in detail on page 6. Simply check all of the functions which you want to use as measures; the wizard can generate multiple measures in a single step. Some very common measures –count, average, minimum, maximum and standard deviation – are already checked in the default setting.
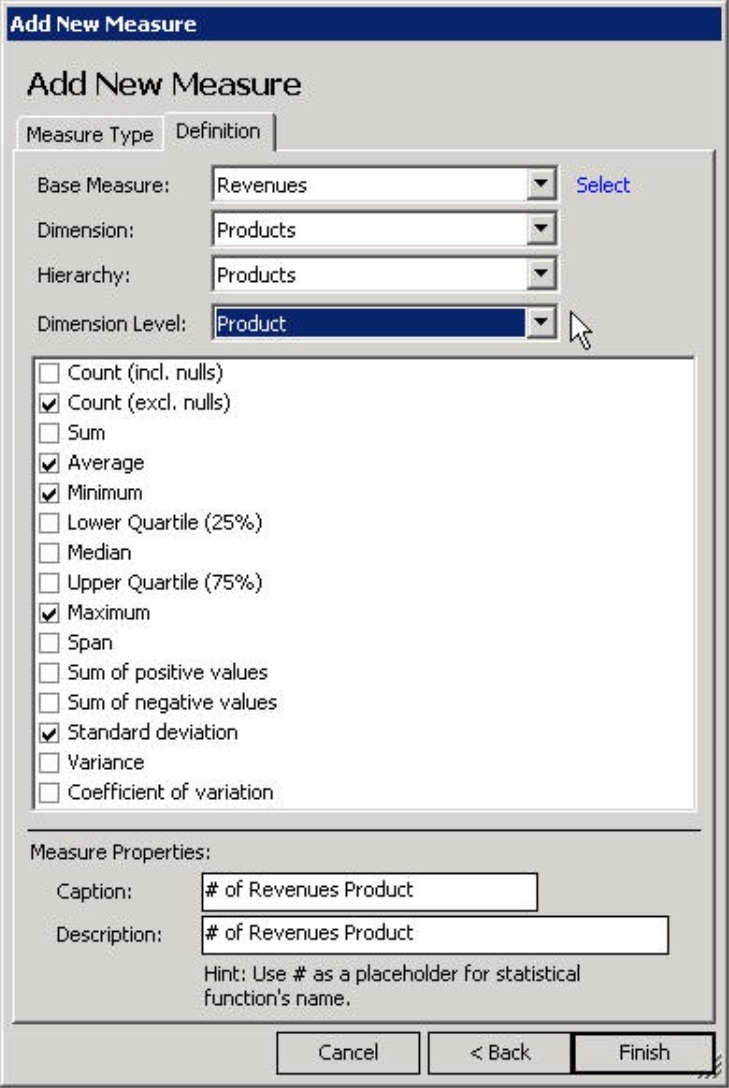
On the bottom half of the dialog box, you can either enter the Names and Descriptions for the new measures or keep the default ones which incorporate the base measure and the selected hierarchy. When it generates the measures, DeltaMaster will replace the ‘#’ variable with the abbreviation for the respective function (see the table on page 6). By using the variables, you can create multiple measures – each with a clear, unique name – in a single step.
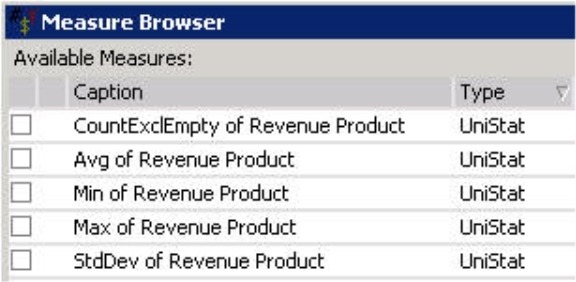
Once you finish the definition, DeltaMaster will generate all of the desired measures at once (type = ‘UniStat’) and store them in the Measure browser where you can rename, scale, and format them like any other measure. That means, of course, that you can visualize these new measures in a pivot table or the Hyperbrowser, and evaluate it using one of the analytical methods.
Level dependency
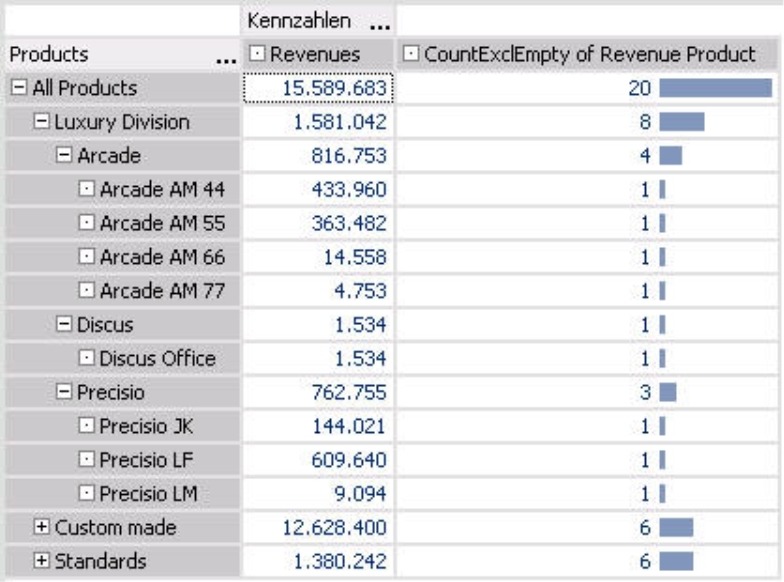
Now, let’s explain how these ‘UniStat’ measures work. We’ll start by taking a closer look at a very simple function: the count (‘CountExclEmpty’). In the screenshot below, we have renamed this measure ‘CountExclEmpty of Revenue Product’.
The measure presented in the right column is defined for the ‘Product’ level as shown in the screenshot at the bottom of page 3. As a result, DeltaMaster will count the product members. The individual members return ‘their’ number (i.e. 1). As we move up in the hierarchy, we can see the number of members in the underlying levels.
The screenshot below now shows how the result differs based on which level is selected in the measure properties. On the upper and left corners, you can also see the Cell coordinates of the pivot table; you can activate this setting in the context menu of Miner mode.
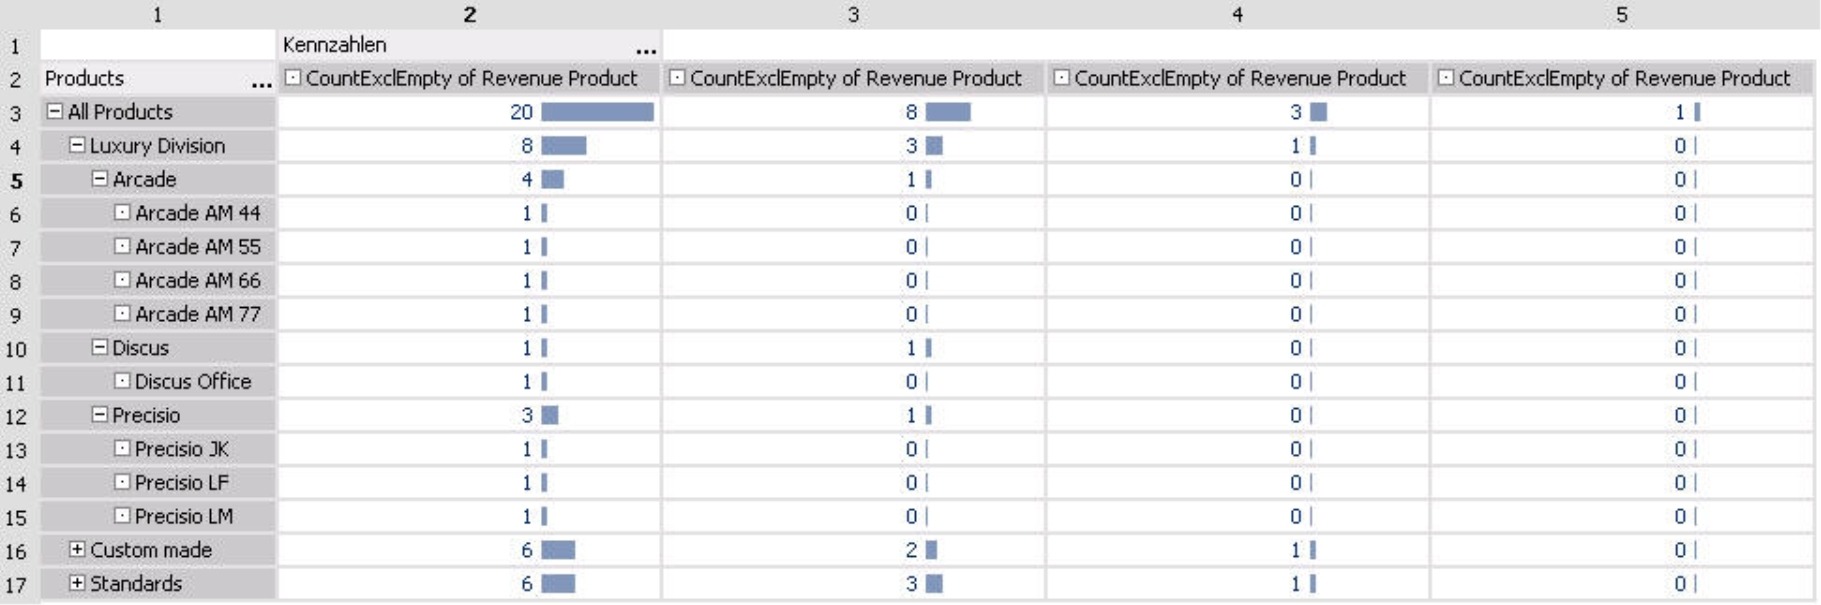
For this overview we created four measures. All of them use the same statistical function ‘CountExclEmpty’ and refer to the same revenues and product hierarchy. The only difference is the chosen level within the product hierarchy:
- For the measure in column 2 we selected the lowest level (i.e. individual products) as in the previous screenshot.
- In column 3 we selected the ‘Product group’ level to count how many groups belong to each level. In this case, DeltaMaster counts each product group as ‘1’ and its respective children as ‘0’. Since the main product group ‘Luxury division’ has three subgroups – ‘Arcade’, ‘Discus’ and ‘Precisio’, we get a total count of 3. Combined with the 2 subgroups for ‘Custom made’ models and 3 subgroups for ‘Standards’ (both of which are not shown), we get a total count of 8 product groups.
- The statistical measure in column 4 is defined for the main product groups – ‘Luxury division’, ‘Custom made’ and ‘Standards’ – which all have a count of 1. Since their children consist of product groups and products but not main product groups, their count is 0.
- In column 5, we selected the highest level (i.e. ‘All products’). The count is 1 because there is exactly 1 top member and the rest are counted as 0.
As you can see through this example, statistical measures differ depending on which level was defined.
Let’s look at another example; this time, however, we will use the average (i.e. arithmetic mean). Staying in the product dimension, we will generate four new measures – one for each of the four levels of this hierarchy. In the example below, we started with the absolute revenue figures (i.e. the base measure) in the left column followed by the four averages on different levels.
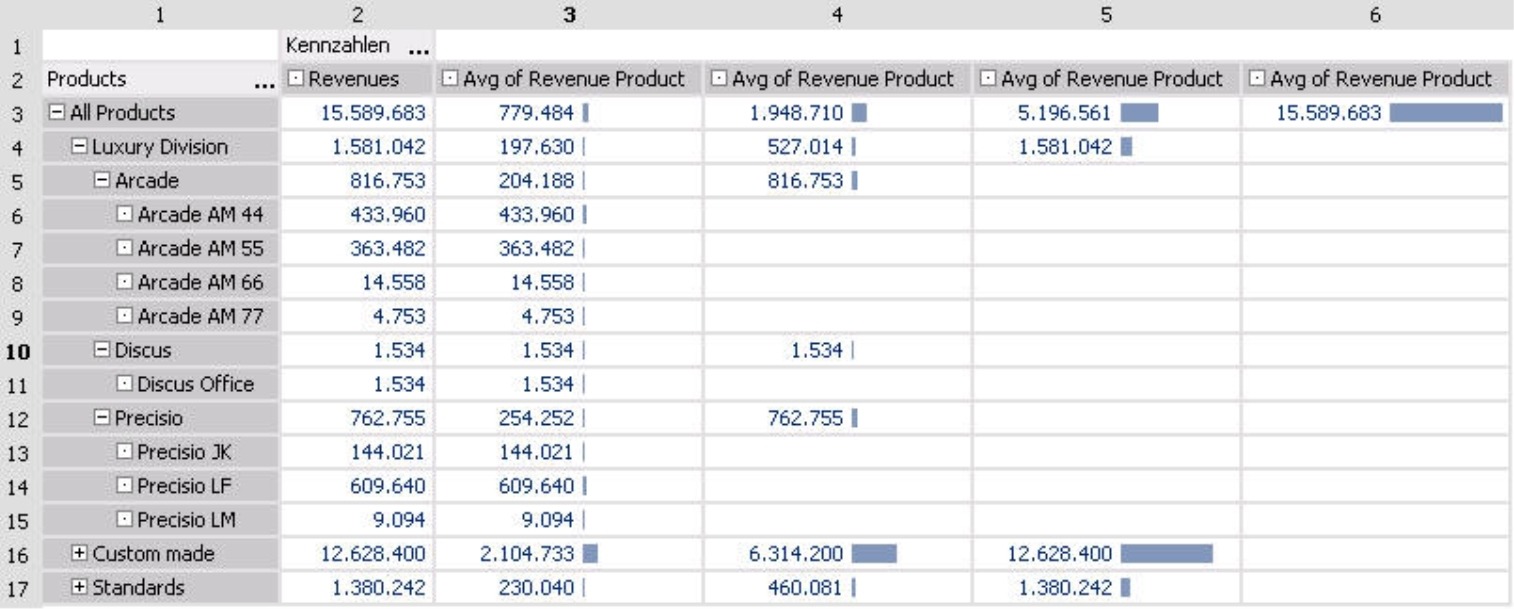
The relationship in this table is the same as before:
- The measure in column 3 refers to products. Here, we want to calculate the average of all members on the ‘Products’ level. Naturally, the average is equal to the direct revenues for each individual product, for example, ‘Precisio JK’. If we look at a product group, we will see the average of the underlying products. For ‘Precisio’, you can see the average of ‘Precisio JK’, ‘Precisio LF’ and ‘Precisio LM’. The average revenue for the main product group of the ‘Luxury division’ is calculated as the average of all products that fall under the main group.
- The measure in column 4 was defined for product groups. This time, the individual articles are empty because they are not product groups and do not contain any either. DeltaMaster will also show the total revenues for the ‘Arcade’, ‘Discus’, and ‘Precisio’ groups because the ‘average’ of a single member is naturally equal to the base measure. Under the main product group of the ‘Luxury division’, we can see the first real average for ‘Arcade’, ‘Discus’ and ‘Precisio’. This average as well as those for the other product groups are added together and divided by three to produce the average for all product groups as shown in row 3.
- In column 5, we only want to examine the main product groups. There are three of these – ‘Luxury division’, ‘Custom made’, and ‘Standards’ – and their averages are identical to their revenues.
- Column 6 shows a measure in which the top member was selected as the level. Again, this average is identical with its revenues.
Wide range of functions
The following list shows which statistical functions are available in DeltaMaster applications based on Microsoft Analysis Services. If you use another database, one or the other function may not work depending on how powerful the backend’s MDX interface is. You may also specify the name DeltaMaster should enter for the ‘#’ wildcard when naming new measures.
| Function | Suggested name | Explanation |
| Count (incl. nulls) | CountInclEmpty | Number of members |
| Count (excl. nulls) | CountExclEmpty | Number of members excluding those that have no value (i.e. ‘null’) for the base measure |
| Sum | Sum | |
| Average | Avg | Arithmetic mean. DeltaMaster will differentiate between database null (missing values) and the value null (‘0’). Although it ignores database nulls, it will include ‘0’ in all calculations. |
| Minimum | Min | |
|
Lower quartile (25%) |
Quartile25 |
The quartile and the median are thresholds which you can use to describe the breakdown of the spread. The median divides the (sorted) values into two halves. The lower quartile contains the 25% smallest values, while the upper quartile contains the 25% largest values. These functions are used for creating box-and-whisker plots (see DeltaMasterdeltas! 5.3.5, feature #11). |
| Median | Median | |
| Upper quartile (75%) | Quartile75 | |
| Maximum | Max | |
| Span | Span | Difference between minimum and maximum |
| Sum of positive values | SumPos | Used to identify compensation effects in variance measures, etc. |
| Sum of negative values | SumNeg | |
| Standard deviation | StdDev | Square root of the variance |
| Variance | Var | Variance from the average |
| Variation coefficient | CoV | Standard deviation divided by the average |
Questions? Comments?
Just contact your Bissantz team for more information.
