![]()
Greetings, fellow data analysts!
In an attempt to spice up their writing, some authors have a heavy hand with synonyms. Instead of saying ‘Frankfurt’, they’ll say ‘Mainhattan’ or for Cologne they’ll say ‘The Cathedral City’. But synonyms can be confusing as well. Although there are no other financial centers on the Main River, Cologne isn’t the only city that has a cathedral. In most cases, too, the meanings of synonyms are similar but not equal. In fact, the famous German linguist Wolf Schneider once warned “Synonyms become an idealism that gravely abuses comprehension.” In short, don’t overdo it.
When it comes to reporting, several factors – including language, numbers and visualizations – all come into play. Reports, however, shouldn’t serve as a guinea pig for testing the latest effects from a souped-up chart library. When dealing with information, you want clarity – in other words, consistency and not individualism.
With DeltaMaster you can even create these standards without extra work. The graphical tables automatically direct report authors to an elegant report and the integrated notation. And by using notations, which are the focus of this edition of clicks!, you won’t have to constantly refer to your style guidelines. Both don’t make a report easier to understand per se. But they do help the reader focus on what’s important: the situation, the message, the essence – in short, the content.
Best regards,
Your Bissantz & Company Team
Serious, straightforward, and most importantly, simple – that’s how good Business Intelligence should be. Here, charts play a decisive role. When creating management reports, you should avoid random decorations that add little or no information. What managers need are information-dense visualizations that clearly explain what they are seeing as well as what is important – and why – based on the background context.
One important rule is that things that look the same should also mean the same. Conversely, things that mean the same should look the same so that the reader can quickly recognize them and interpret them correctly. Effective communication requires clear conventions. Otherwise, misunderstandings quickly arise and you can put your company’s success at risk. In other words, consistency and standardization in reporting are absolutely necessary.
Fortunately with DeltaMaster, business professionals don’t have to invest a lot of time to uphold design guidelines. DeltaMaster offers a built-in, adjustable ‘style guide’, otherwise known as the DeltaMaster notation. Information design experts such as Dr. Rolf Hichert are also striving to achieve common reporting standards. In fact, the ‘U’ in his concept for ‘SUCCESS’ in business communication stands for ‘Unify it’. You can download further examples and presentations from his (German language) Website: www.hichert.com/de/success/unify.
Labeling business relationships
You can now lend business relevance to the visualizations in graphical tables. That way, your readers can mentally digest the information in your reports more quickly and easily. Most apply Notations in two fundamental areas in management reporting:
- Comparisons of different value types (e.g. budget, actuals, variance)
- Time (e.g. months, quarters, years)
The challenge: When you look at a table, you should intuitively know where the budget data, actuals and variances are located respectively. You should also be able to tell if the content is referring to months or quarters without having to read a legend first.
With DeltaMaster’s Notation feature, you can manage all of these rules in one central location so that they automatically apply to all graphic tables in your application. For example:
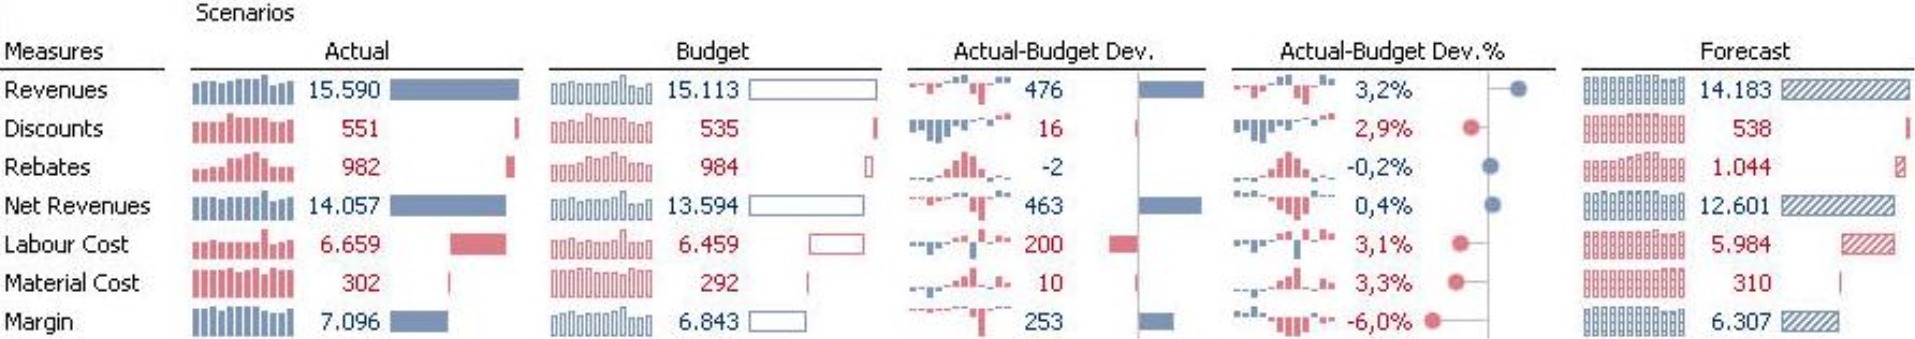
The screenshot above shows a budget-actual variance for a profit margin calculation. The members of the value type dimension are arranged in columns. Each column represents a different business context: actuals, budget data, absolute variance, relative variance as well as forecast. The graphical elements, which are unique for each column, show these differences intuitively. Whoever recognizes this notation doesn’t even have to read the column headlines. The style of the chart already shows which relationship the numbers have.
Before DeltaMaster can apply any rules, you must first define which design should be used for which members, levels and measures. DeltaMaster has a separate editor for defining these guidelines.
Setting notation rules
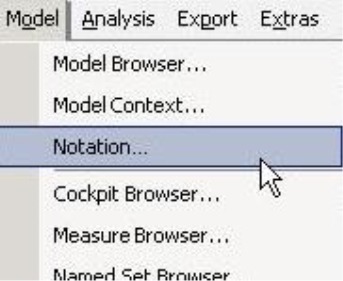
You can open the Notation editor from the Model menu in all user modes in which you can create reports (i.e. Miner, Analyzer or Pivotizer). DeltaMaster will apply and display the notation rules in all modes; Reader and Viewer users, however, cannot change them.
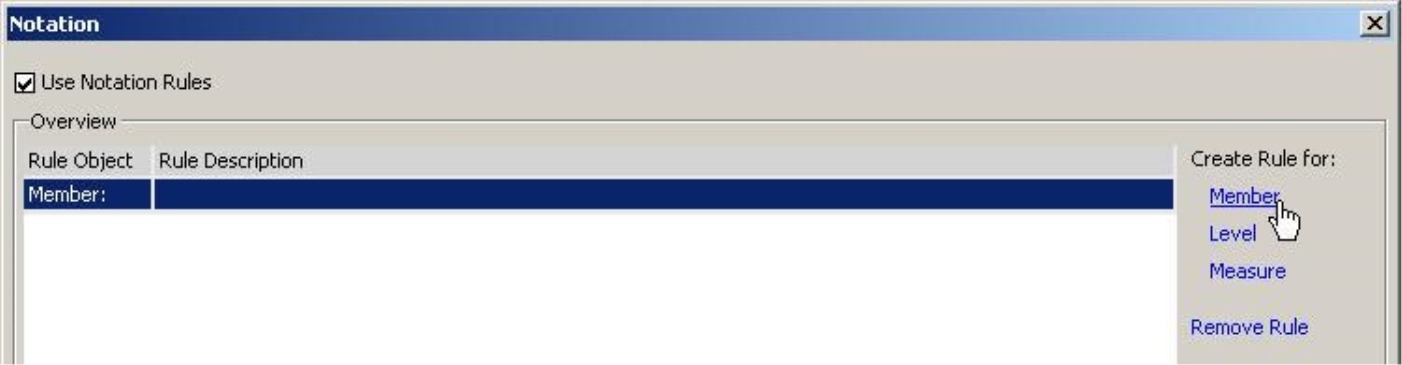
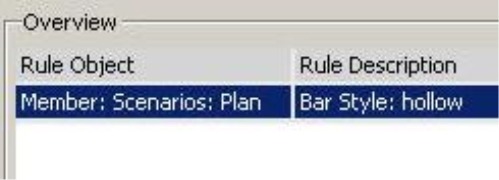
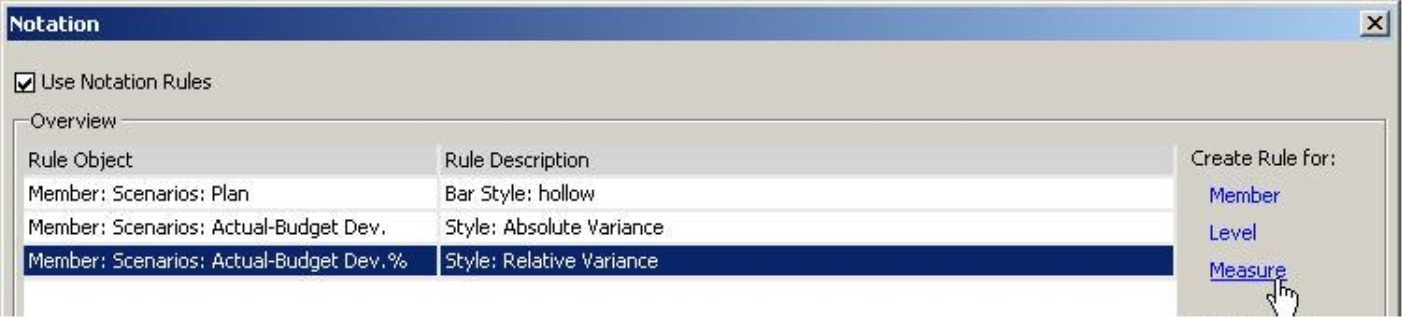
The first time you use Notations, the editor will not contain any rules. On the right side of the dialog box, you can create a rule for a dimension member, hierarchy level or a measure by selecting the respective object. After generating a new entry that rule in the Overview, DeltaMaster will then offer further options for the object type that you selected.
Rules for members (e.g. budget, actual, variance, and other value types)
Member rules are designed for use in value type and scenario dimensions such as budget, actual, forecast, absolute variance, or relative variance (in percent). These rules determine how all measures containing these value types will be displayed in the bars, columns, etc. of pivot tables and graphical tables throughout the analysis module.
To Select the Member that you wish to format, simply click on the respective link. This will open the dimension browser in the previously set Dimension and Hierarchy. Now, you simply tick the check box to activate the desired settings:
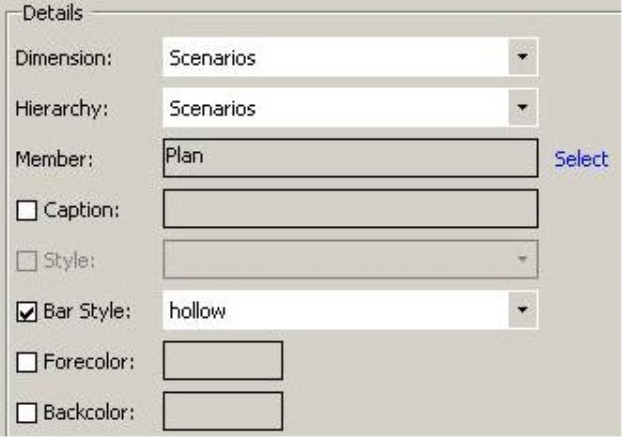
- You can change the member’s Name. This option makes sense if the member in the database has a technical name and you want to use an alias in your management reports.
- You can define a Style or Bar style. As shown in the table on the following page, you can switch between relative and absolute variances. This option displays bars/lines and points to the left and right of the baseline. You can only select the Style if the Bar style option is deactived.
If you activate the Bar style, you can define if your bars, columns, waterfall members and column sparklines should be filled, hollow or hatched. Since the default setting for this option is “filled”, this option is not listed. As a result, you do not need to create a separate rule for an actual member.
DeltaMaster currently supports 5 types of styles and bar styles:
| Value type | Example | Graphical elements (bars, columns, waterfalls) |
Column sparklines |
| Actual | 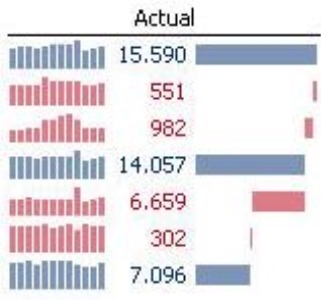
|
filled (Since this is the standard format, a separate notation rule is not necessary.) |
filled |
| Budget | 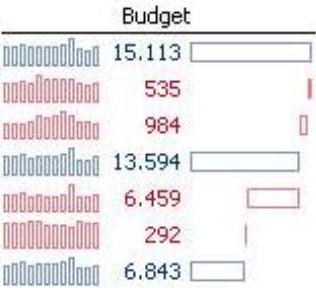
|
hollow; Name in editor: bar style hollow |
hollow |
| Forecast | 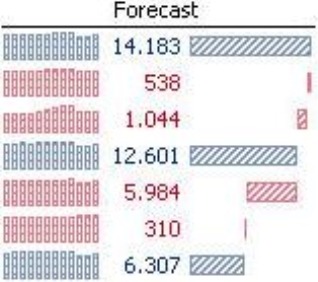
|
hatched; Name in editor: bar style hatched |
hatched |
| Absolute variance | 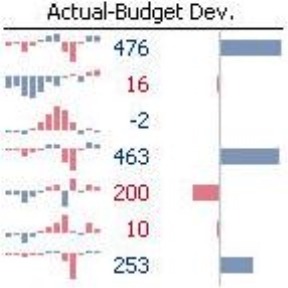
|
Bars to the left and right of a line
Name in editor: Style absolute variance
|
filled |
| Relative (percent) variance | 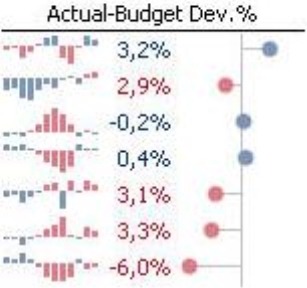
|
Points to the left and right of a line Name in editor: Style relative variance |
filled |
These default styles have a certain charm because they are so easy to remember. Filled elements stand for something solid, tangible and real – namely, actual data. Budget data, however, is still up in the air. Time will tell if you can attain these goals or not. This is symbolized by the hollow graphical elements. A forecast, however, contains both value types: some actual revenues as well as those that you hope to generate during the period in question. This mixture is indicated through hatching. DeltaMaster designates variances with a target line which stands for ‘no variance’. The bars or points to the left and right of that line show us how far you are from our targets. Points are used for relative variances because they resemble percentage signs.
- You can apply a Text color and a Background color to the elements used in the pivot table if they are consistent with known conventions. The font color overrides the automatic business intelligence coloring. Generally, however, we recommend that you use colors sparingly – which is why we didn’t provide an example here as well. If using colors is explicitly desired, however, notation rules will ensure that you use them consistently throughout the application.
The settings that you have created apply immediately. These will be displayed in the overview as a Rule description. To add another rule, you don’t need to close the dialog first. Simply select a new object under Create rule for. You can also delete rules from this same overview. To close the rules editor, simply click on OK.
Rules for measures
You can also apply notations to measures using the exact same options that are offered for members. This option was designed for budget-actual variances that are defined in the database instead of directly in DeltaMaster. If you have generated filter values in DeltaMaster, you don’t need to use this notation because the rules for members already apply in these cases.
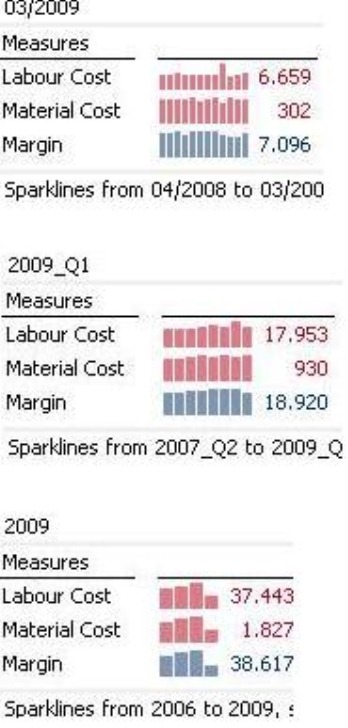
Rules for levels – time dimension
Level rules are designed for use in column sparklines, in other words, time dimensions. Since a quarter is longer than a month, a column that represents a quarter in the graphic table should be wider than one that stands for a month. Although the size does not have to be three times larger, a difference should be visible. (After all, when reading a map, you simply want to differentiate between interstate highways, state highways and country roads. The number of lanes, however, is irrelevant for day-to-day travel.)
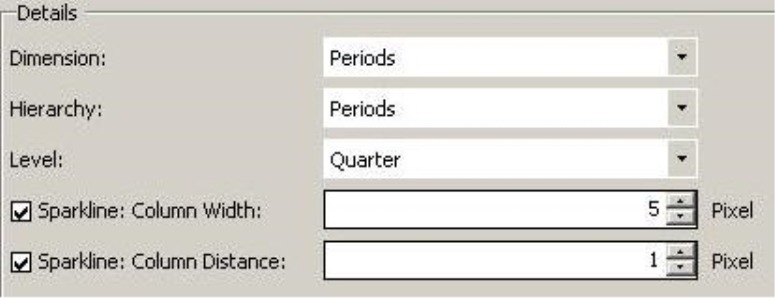
Level rules, therefore, only have two parameters: Column width and Column spacing, which are both measured in pixels. You can customize these options under the Table properties of pivot tables and Flexreports but only, of course, for a given cockpit or report. Using the notation rules, DeltaMaster will now automatically adjust the width depending on which time level is currently displayed in the report.
The default setting in DeltaMaster without notation rules is a width of two pixels with one-pixel spacing. If you want to combine level and member rules to visualize the development of budget figures over time, for example, you should place the setting at three or more pixels so that the hollow columns of the sparkline can be displayed properly.
In the screenshot to your right, the setting for months is three pixels while quarters have five and years have seven; all have one-pixel spacing. Although these pixel sizes are very close, you can still easily see a difference.
In order to define custom widths and/or spacing, simply tick the check box that appears before the respective option. DeltaMaster will then apply this setting to all pivot tables. Please note that you cannot deactivate or change this option in individual reports as the respective option in the Table properties will be locked.
If you deactivate an option by removing the tick from the check box, DeltaMaster will not control this parameter centrally. In this case, you would have to customize these options in every individual pivot table.
Saving, importing and exporting notation rules
Notation rules are stored in analysis sessions (.das files) and analysis models (.dam files). In order to promote consistent notations, you can also exchange these rules among the analysis files of a data model. Simply export and import these rules as XML files by using the links at the bottom of the dialog.
![]()
Take note – it works fast and thoroughly.
The clear advantage of notation rules is that these presentation options apply to all pivot tables. In other words, once you have defined them, DeltaMaster will automatically apply the formatting – without any further intervention on your part.
Flexreports, which reference pivot tables containing these rules, also support notations. In fact, when you export them to PowerPoint, all of the style guidelines remain intact. This also applies to Word when you Export table presentations as an image (Extras menu, Options, Export). Otherwise, Word will only support Bar styles (i.e. filled, hollow, shaded). Text, background colors and hollow bars will be supported in Excel exports.
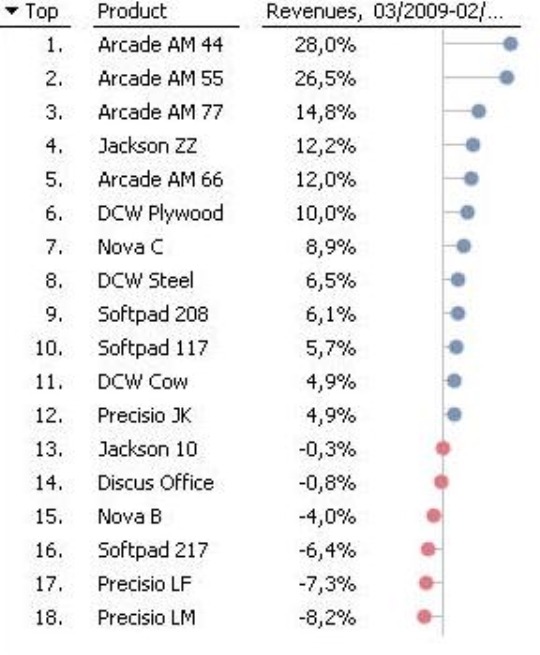
With the exception of cockpits, these rules also apply to table views in multiple analysis modules including Rankings, Cross table analysis, Portfolio analysis, PowerSearch, Navigation, Staircase analysis, Comparator and Profiler. As a result, you can clearly see which value type is displayed in a ranking – without having to read further.
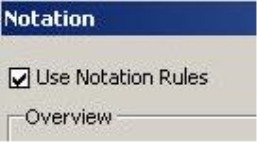
You can activate or deactivate all notation rules using the option located in the upper-left corner of the editor. Alternatively, use the shortcut Ctrl + N, which also works in DeltaMaster user levels without access to the notation editor (i.e. Reader and Viewer).
Questions? Comments?
Just contact your Bissantz team for more information!
