![]()
Greetings, fellow data analysts!
In 1960, Voigtländer, a company with a long history of innovations in the field of optical instruments, launched the first camera with a changeable focal distance, today commonly known as the zoom lens. With this technology, photographers can alter the detail of the picture without having to change position or the lens – the perspective remains the same. Whether they want to be closer up or further away is a matter of photographic composition, as is the angle of view. In financial controlling, we face a similar situation. Sometimes we want to view our customers, products, or business units in detail and other times as part of the big picture. Our view of the business world may stay the same or need to be changed – depending on what it is that we want to analyze. In DeltaMaster, we can view a selection and perspective side by side in a Portfolio Analysis, for example. In this issue of DeltaMaster clicks!, we will take a closer look at this module and show how you can use it to reveal the details that your data has to offer.
Best regards,
Your Bissantz & Company team
In many of DeltaMaster’s analytical methods, you can use measures to filter the members you wish to analyze. This option is frequently used to focus the analysis on a few, select members that are particularly interesting for the question at hand. For example, you could eliminate revenue figures that fall below a certain threshold, since they don’t have any major influence on the overall income and just make the report unnecessarily long. Besides business reasons, you also need filters to eliminate “disruptive” values such as outliers or negative numbers resulting from incorrect data.
Some of the analytical methods also offer a kind of zoom function. This issue of clicks! will focus on one of these methods, the Portfolio Analysis. This information, therefore, also applies to the Regression method, which is closely related to the Portfolio Analysis and identical in terms of how it is to be used. With both methods, you can use the context menu to display or hide certain objects, a function that is similar to zooming.
What are the differences between filters and zooming? How do we get a closer look at the details in a portfolio analysis?
Filters in the view
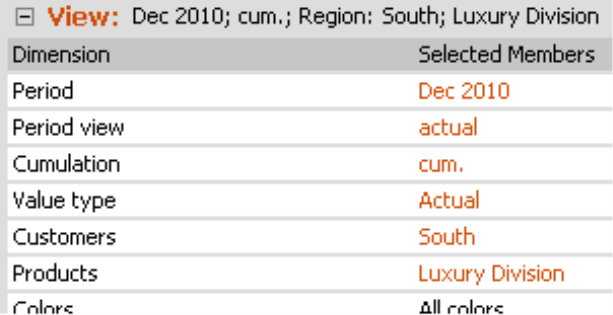
When you are dealing with databases, especially multidimensional ones, you often hear about filters. But, first things first. Initially, what interests you the most in DeltaMaster is the View – the members (e.g. attributes, criteria, restrictions) that are selected in the View window. (For now, we want to ignore the so-called model context as well as the view and analysis contexts.)
The combination of the selected members is the reference point for reports, cockpits, and analyses (e.g. the respective period and a product group in a customer region). This makes the view the first “layer” of filters. In reports, DeltaMaster only displays the objects that are either selected in the View or are the children of those objects. If you select “South” in the customer dimension of our “Chair” reference model, therefore, you will not see members that belong to other regions.
Filters in analyses
Besides filtering based on objects, you can also apply numerical filters, as we mentioned in the introduction. Instead of selecting all customers, for example, you can opt to view just those that have generated at least a certain amount of revenue.
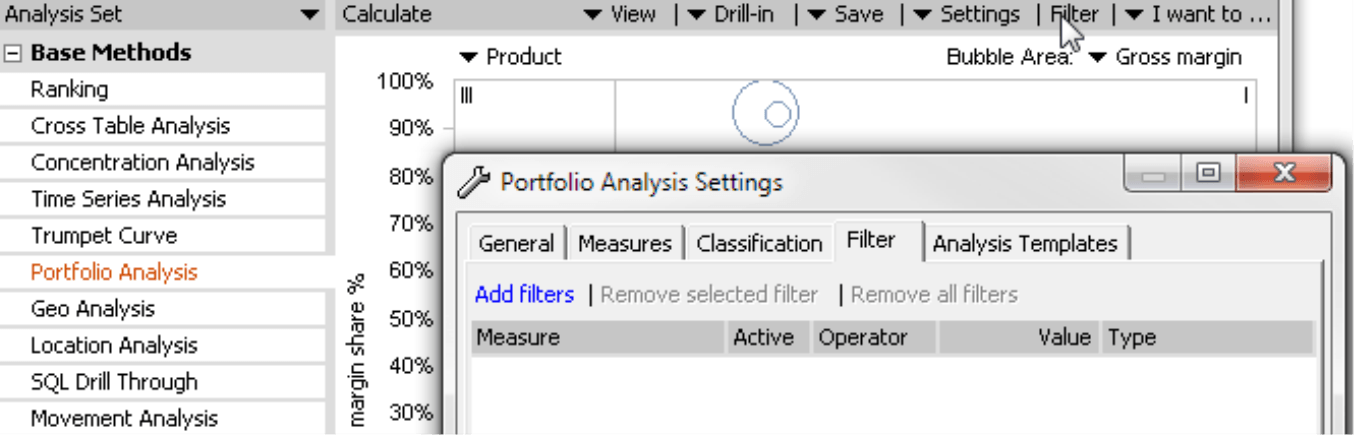
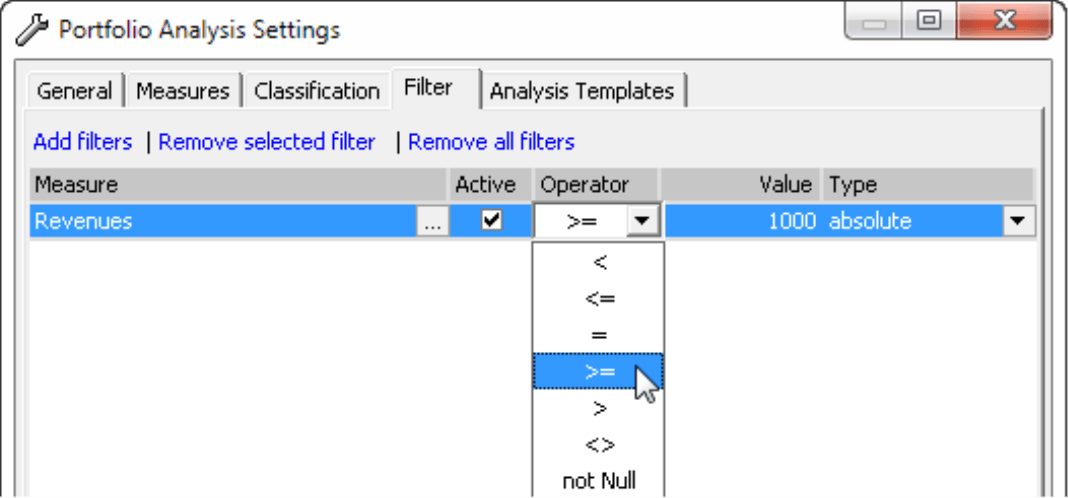
You can define these types of filters on Miner level by clicking on Settings and then selecting the Filter tab. You can also access this tab by directly selecting the Filter option in the menu bar. All analytical methods that support filters offer this fast access as well.
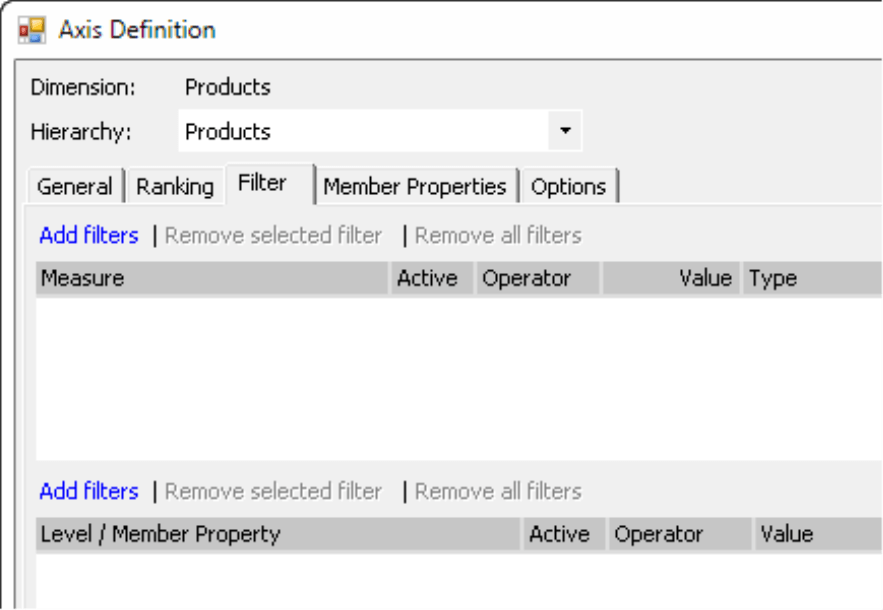
The dialog box is identical to the upper part of the Filter tab in the Axis definition, which many users already know from pivot tables. In pivot tables, however, you also have the option to filter by member properties (i.e. attributes), which you currently don’t have in the analytical methods.
You can now Add and Remove filters in this dialog box. Each of these filters refers to a single Measure, for example, revenues. You can use various Operators to compare that measure to a previously defined reference value, for example, “> 0”. As with a view, the filters determine what information the report should contain, and not what should be removed. Therefore, if you define “Revenues >= 1000” as a filter rule, DeltaMaster only includes in the analysis the customers, products, or other objects that have generated revenues totaling a four-figure sum or higher. You can also link multiple filters using “and” and “or”.
The filters in the Settings of the analytical methods (and also those in the Axis definition of the pivot table) thus serve as a second layer of filters and use values to further refine the members selected in the View window. DeltaMaster saves these filters with the report or analysis template so that they also work in all other user levels. In accordance with DeltaMaster’s user-level concept, however, you can only edit these filters on Miner level. Users on Viewer, Pivotizer, and Analyzer levels can change the View but not the filters defined in the Settings of the analytical methods. (This handling is very similar in pivot tables as described in DeltaMaster clicks! 04/2009.)
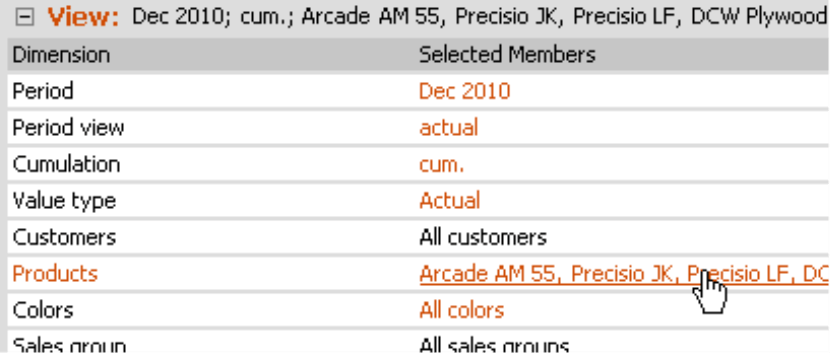
DeltaMaster displays the filter settings in the status line below the analysis. In presentation mode, however, they are shown in the header.
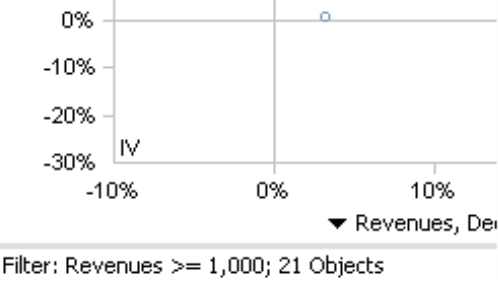
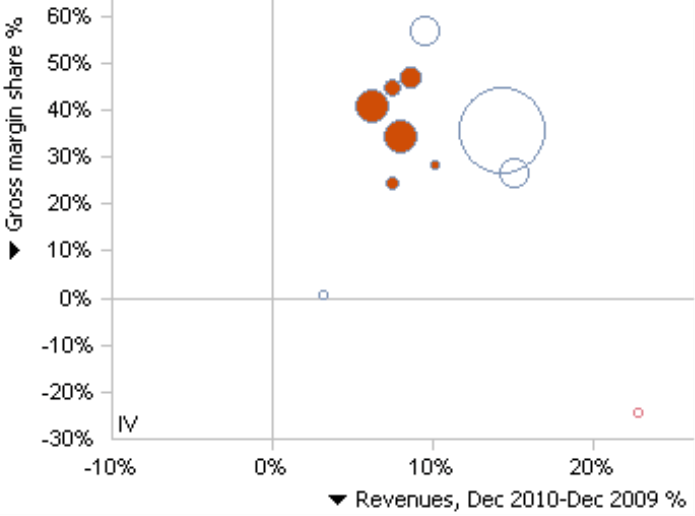
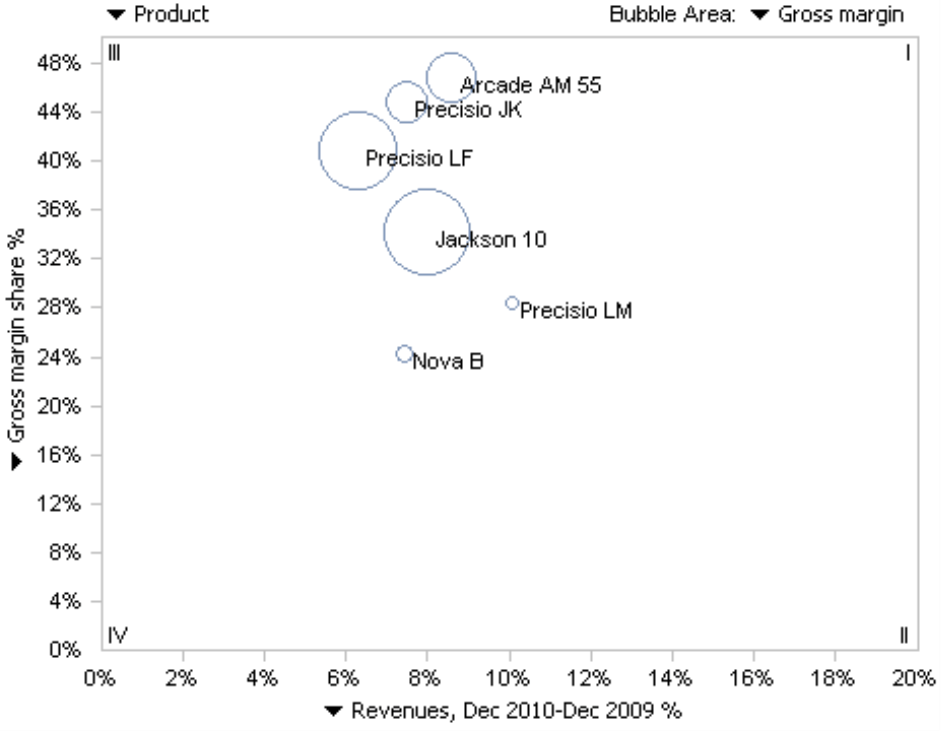
In the example shown above, you can see that filters can also be defined for measures that are not part of the analysis. The sample analysis below shows the relationship between the gross margin ratio (“Gross margin percentage %”, defined as the quotient of the gross margin and revenues) and the percentage change compared to the previous year’s revenues. The bubble size represents the gross margin in each case. This type of visualization shows how profitable the products are and whether revenues have grown or declined. The filter takes the revenues into account even though they are not displayed in this chart.
Zoom functionality for everyone
Until now, we have only talked about filters. Now, let’s focus on the zoom function. This option is available in all levels from Offline Reader to Miner Expert.
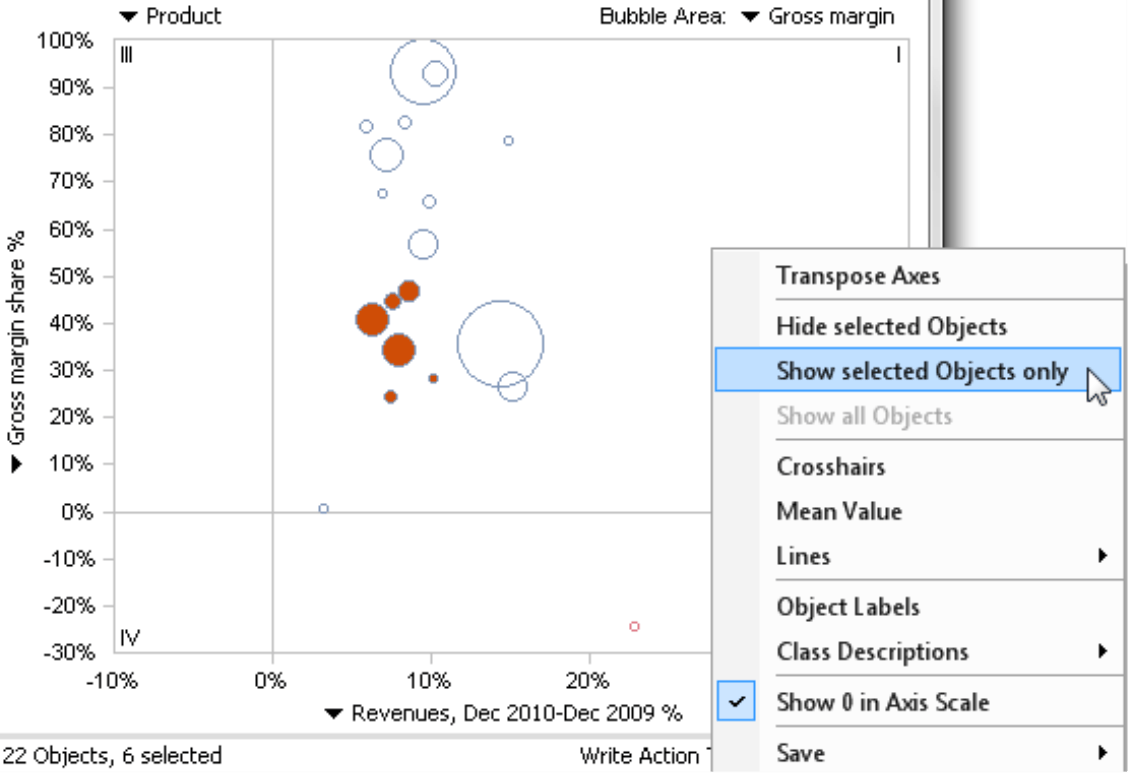
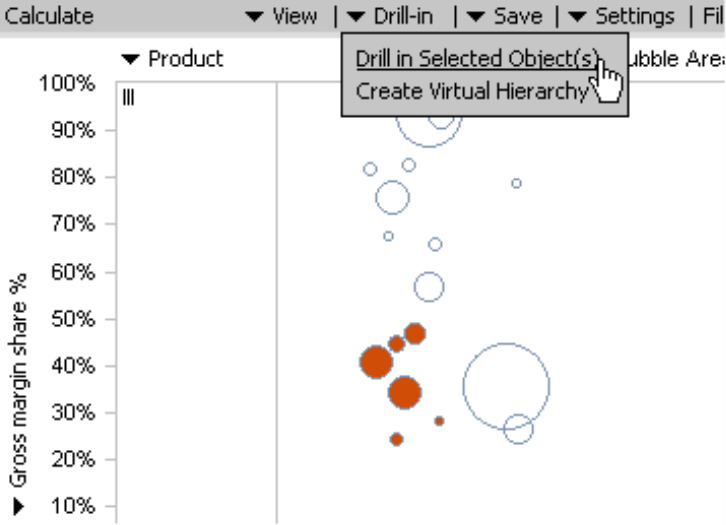
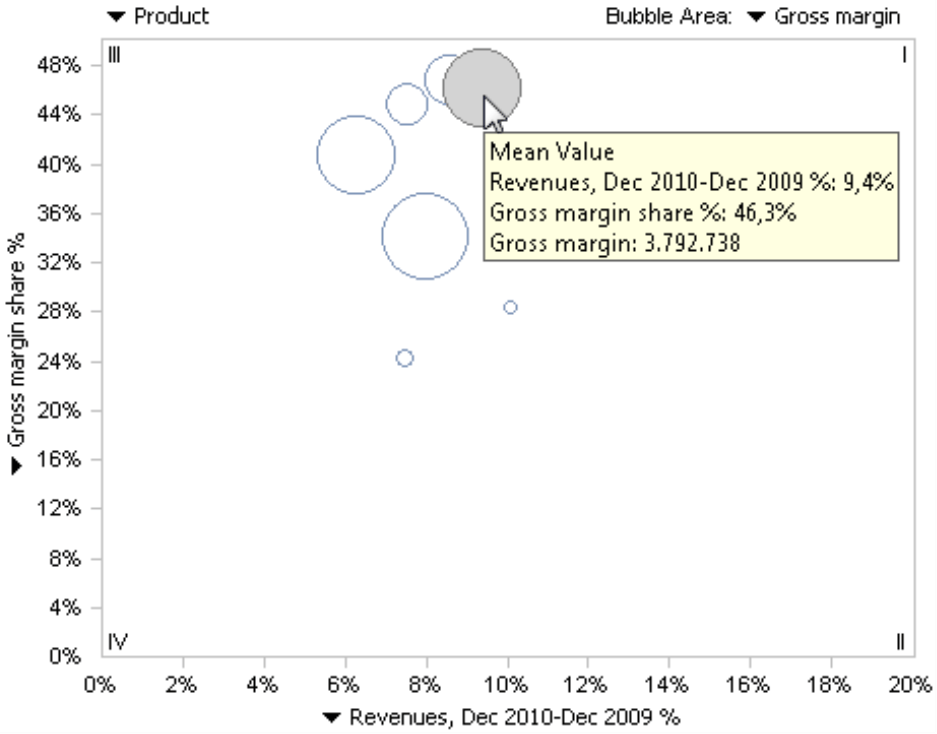
In the portfolio analysis, let’s first select a few products that have a mid-range profitability (“Gross margin percentage %”) and middle-rate growth (“Revenues, Dec 2010-Dec 2009 %”). To select the objects, simply use drag and drop to create a box around them. You can select individual objects by clicking on them while holding the Ctrl key. You can follow this same procedure to remove the selection as you would in Windows when you want to select or deselect multiple objects. You can undo the entire selection simply by clicking on a selected object.
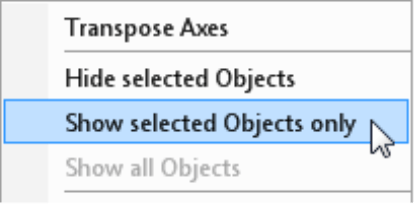
In the context menu, you can now choose the option to Show selected objects only. Alternatively, you can also Hide selected objects, an option that is often used, for example, to eliminate extreme values at the chart edges. You can use both options multiple times. The third option in the context menu allows you to Show all objects, e.g. to undo any previous selections.
As a result of your selection, DeltaMaster shows just the desired objects and automatically adapts that section in the chart. This creates the desired zoom effect. When fewer, adjacent objects share the screen space, they are enlarged so that you can differentiate them in more detail. Frequently, you still have enough room to display the Object labels and then even the Area values (context menu or I want to… menu).
You can also access all these options in the DeltaMaster presentation mode (F5 key or Shift +F5 for the current report). In this way, you can flexibly respond to ad hoc information requests even during meetings by showing the relevant sections of the analysis.
No database queries for zoom function
The fact that the zoom function also works in Offline Reader mode gives experienced DeltaMaster users a hint to the biggest difference between filters and the zoom function. Filters impact the database query while the zoom function does not. The zoom function only has an effect on what is displayed on the screen. You cannot “restore” objects that were excluded from the View or by Filters using zoom options. DeltaMaster applies the zoom after you have set the filter. Going back to the comparison with photography from the introduction, the View and Filters are the perspective you can use while zooming. You cannot change it, however, by zooming.
When you zoom in on objects in a Portfolio Analysis, DeltaMaster does not send a new query to the database. Instead, it works with the existing values – namely, those that were saved in the analysis session (i.e. in Offline Reader) or were retrieved from the database the first time that the report was displayed prior to any zooming taking place. This allows you to switch among the different displays of data very quickly and interactively.
When you create a new Portfolio Analysis or refresh the analysis or report (e.g. after changing the view), DeltaMaster sends a new query to the database, taking the defined filters but not the objects currently selected for display into account. In other words, it resets the objects that you have interactively selected and the analysis shows all the objects again. DeltaMaster also displays all the objects in saved reports as well, so when you open one, you see it without any restrictions.
Threaded Analysis Technology in Miner
When you are working on Miner level, you can directly transfer the selected objects into the View and continue your analysis with just these objects. This provides an additional option to close in on and examine the objects that interest you in greater detail. To analyze a single object, simply double click on it. If you want to analyze several objects in detail, click on Drill in selected objects from the Drill-in menu in the Analysis window.
DeltaMaster will then ask if you want to Create a view for each object or Create a single view for all objects.
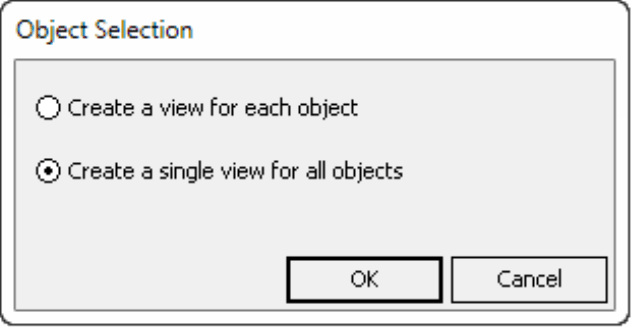
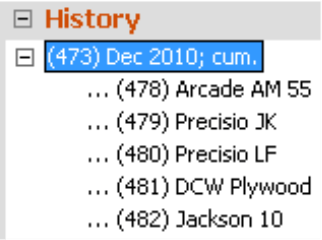
If you create a view for each object, DeltaMaster makes a new entry for each selected object in the History window. This way, you can calculate cockpits and analyses for different members very quickly by selecting them successively from the history list.
If you create a single view, DeltaMaster selects all of the members in the View window as if you had selected them from the Dimension browser. In this case, DeltaMaster calculates the cockpits and analyses for these members in aggregated form (usually as a sum).
Mean value and lines
Another important difference between filters and zooming is that statistical measures, guide lines, and so on always refer to all members of the view (even if it is filtered) and not merely to the displayed objects.
In a Portfolio Analysis, for example, you can display the mean value of all members as an additional bubble in the chart.
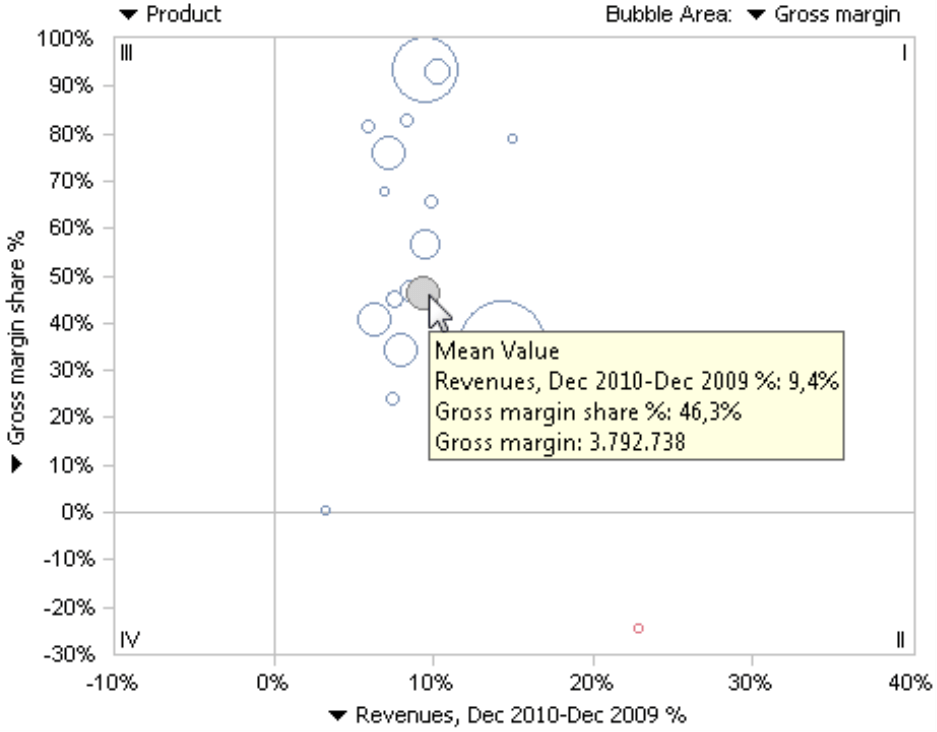
If you now select and display the same five objects as in the example above, the bubble for the mean value will remain in the same position in terms of the x- and y-axes (as will the bubbles for the five selected objects) and DeltaMaster will zoom in. However, note that the mean value does not move to the center of the remaining members. The reason is that DeltaMaster still uses all members as the basis for calculating the mean value – that hasn’t changed simply because you want to display just a few members. In this way, you can still analyze your selection within the same context. Similarly, DeltaMaster does not change the Identity, Mean, Regression, or Frontier lines when it only displays certain objects.
Zooming in other modules
DeltaMaster also offers zoom functions in other modules such as the Regression Analysis, as previously mentioned. The Regression Analysis behaves just like the Portfolio Analysis. Geo Analysis and Location Analysis with Google Maps (see DeltaMaster clicks! 06/2011) also offer zoom functions. Both modules save the selected section with the report. Even pivot tables offer powerful methods for zooming – but we will talk more about them in a later issue.
Questions? Comments?
Just contact your Bissantz team for more information.
