![]()
Greetings, fellow data analysts!
Pictures first learned how to move at the end of the 19th century. These early “motion pictures” were little more than individual images shown in quick succession. This innovation soon spread into other areas and in 1928, the first news ticker was launched in New York’s Time Square, where it remains its trademark over eighty years later. In London, a Reuters ticker that runs across the entire facade of a building also serves as a landmark of the city’s new Canary Wharf business district.
You might be asking yourself where we are going with all this talk of movement. The answer is… anywhere you want! With DeltaMaster you can create informative tickers and publish them to all kinds of other applications. The TickerPortal makes it all possible. We’ll show you how to bring it all into motion in this edition of clicks!
Best regards,
Your Bissantz & Company Team
Back in DeltaMaster clicks! 10/2005 we introduced the SparkTicker, a tool which allows you to publish large volumes of data as sparklines. These subtle, yet omnipresent charts display valuable background and historical information as an infinite loop and are as accurate as your data sources allow.
![]()
Beyond your DeltaMaster environment, this feature can be very useful in other applications such as:
- Corporate homepages (e.g. www.bissantz.com)
- Intranets, portals and other sources of internal corporate information
- Active Desktop (as a dynamic enhancement to your current Windows desktop)
- Self-running presentation screens for corporate reception desks, meeting rooms, cafeterias or even tradeshow exhibition areas
- Anywhere you can use an automatic presentation that requires little to no interaction
In scenarios like these, you will need to export the ticker charts from DeltaMaster to another application. You can do this in two different ways:
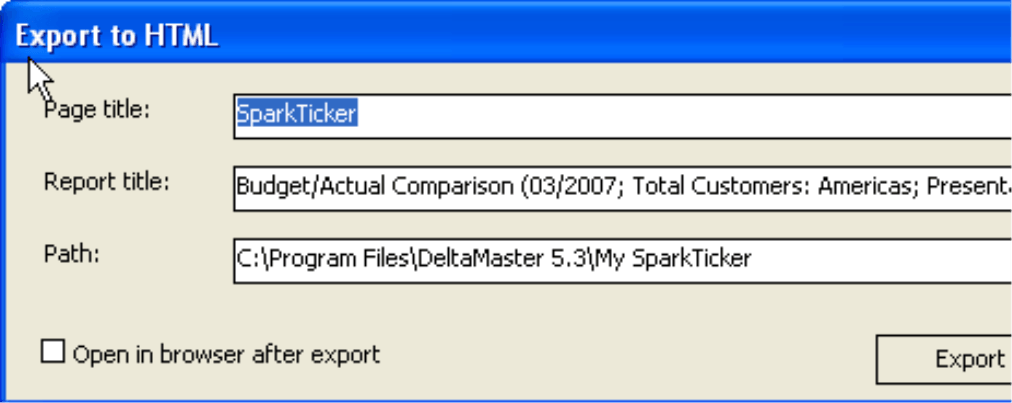
- You can Save the images manually by clicking the respective link in the SparkTicker window of the analysis session. DeltaMaster will then save the currently displayed chart to a simple HTML page which displays the chart as a ticker.
- You can automatically export SparkTicker charts using the new TickerPortal option in combination with ReportServer. Once this option has been activated, you can generate a large number of tickers that are updated regularly with no further work on your part. In other words, you can use jobs to create ticker images and transfer them to a Web server via FTP, for example, just as you would do to create and distribute .das or Office files.
This edition of clicks! will focus on the automatic export function.
Licensing
In order to use the automatic export function, you will need both ReportServer and a separate TickerPortal license. No further software installations are necessary. Although the TickerPortal functionality is available in ReportServer, you can only use it with a valid license.
You can request an evaluation license so that you can test its functionality in detail and build your own applications.
Modifying the definition database
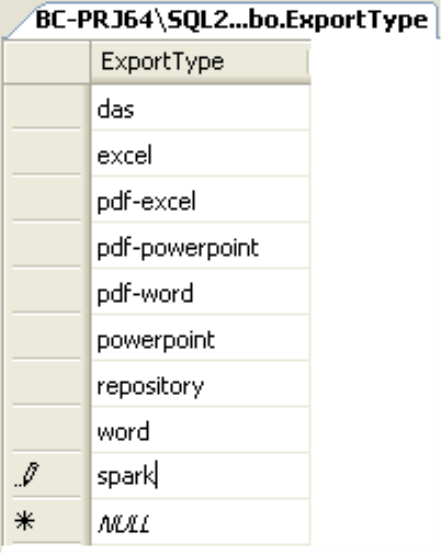
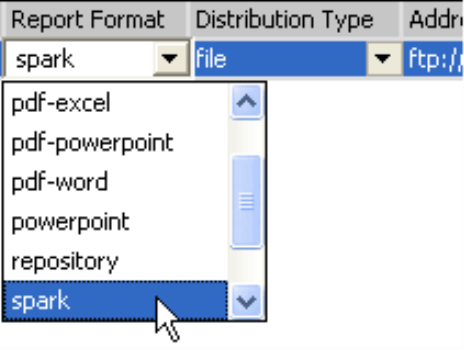
First, you will have to make a small change in the definition database, where ReportServer saves the definitions and properties of its jobs. ReportServer accesses this database, which is typically implemented either in Microsoft Access (“ReportServer.mdb“) or as a relational database in Microsoft SQL Server, via ODBC. In the “ExportType” table, you will need to add a new row called “spark”. After you have made this change, ReportServer will be able to export tickers.
Export goods: SparkTicker Reports
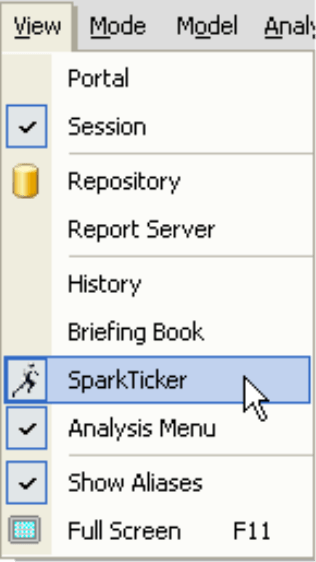
If you do not currently see the SparkTicker in your analysis session, you can activate this option in the View menu of the main toolbar.
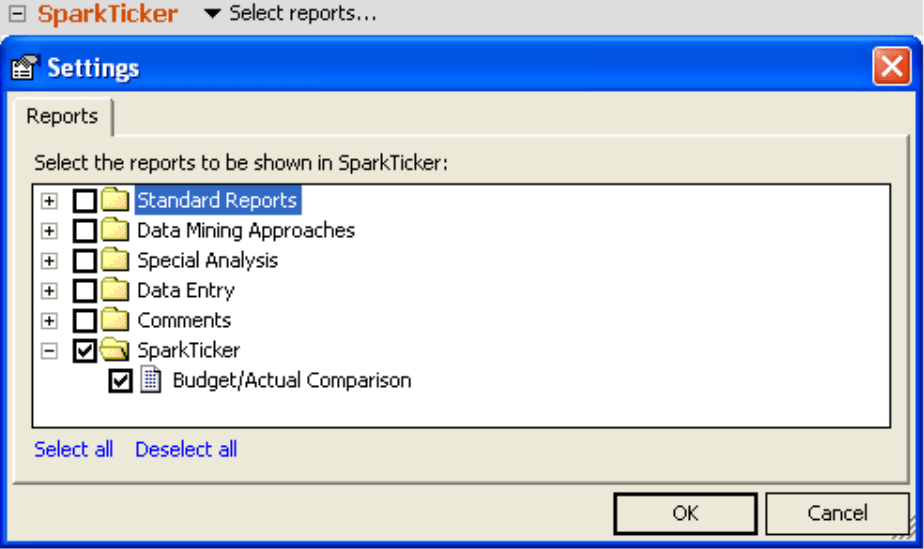
Now open the analysis session which you would like to use as your Report source. In the SparkTicker window, you can Select the reports to be shown in the ticker with your mouse.
It makes sense to store all SparkTicker reports into a separate folder of the briefing book as shown in the screenshot to your right. Currently, you can create a ticker using pivot tables, measure charts/lists rankings, time-series analyses, SQL drill throughs and Flexreports. (For more information about Flexreports, please read DeltaMaster deltas! 5.3.0, feature #13).
Export unit: folder
DeltaMaster processes jobs in the export process on a folder-by-folder basis. All reports in a folder will be merged into a single chart in the same order that they appear in that particular folder. If you want to create individual sparklines like those on our DeltaLife site (www.bissantz.com/sparklines/deltalife.asp), you simply have to create a separate folder for each sparkline and then save a report that shows the desired value. The Briefing book generator supports you in this task (see DeltaMaster clicks! 06/2006 for more information). To help you maintain an overview of these folders, you may wish to organize them in a system of parent folders.
Adding a job in ReportServer
In the ReportServer job, simply select the “spark” Report format, which you have just added to the definition database. In next column select the Distribution type, such as “ftp” for uploading images to a Web server, “mail” for sending them by e-mail, or “file” for saving them to a directory.
The right address
Since ReportServer automatically names the export files, you simply have to enter the path under Address. Please note, however, that this folder must already exist, because ReportServer cannot create a new folder and will otherwise interprets your entry as a file name. You can use variables such as “@IMN” for the name of the current generator element; the resulting term, however, should again be the name of an existing folder.
The created files will be named “sparkX.png“ and, where applicable, “sparkX.xml”. In this case, X is the ID of the corresponding report folder in the Briefing book. You can view the ID in the analysis session if you hold the Alt key while mousing over the folder name. This ensures that ReportServer can locate the charts under the same name for regular updates.
If you want to upload the charts to an FTP server, you must write the address in this form:
ftp://user:password@server/path
Although user name, password and path are not required entries for ReportServer, they are generally required for accessing an FTP server.
Output files
ReportServer will generate a bitmap file for each folder and, if applicable, a second file containing the numerical values for the integration into other applications.
- The bitmap is a PNG (Portable Network Graphic) file. This format supports compressions without losing quality and is supported by all standard Web browsers and other display programs. The size of the charts can be very large if the source reports are as well. Although a width of several thousand pixels is normal, the file size will usually only be a few kilobytes. If the report contains line/column sparklines or trend barometers, these will also be exported 1:1 to the ticker. ReportServer also accounts for tolerance corridors in line sparklines as well as the ticker size (i.e. small, medium or large) during the export process.
- If a report contains column sparklines, DeltaMaster will generate a second file in XML format containing the coordinates of the individual columns, the time frame which they are referencing and the actual value of the numbers. This ensures that external applications, such as a script on a Web server, have all the information they need to generate tooltips providing detailed information on each column. The XML file has the same name as the corresponding bitmap file but with an .xml ending (instead of .png).
Usage
After you have exported the charts, you can use them on your Intranet site, a portal or other external applications. Exactly how you integrate the DeltaMaster or TickerPortal data into your system depends on the individual target system. Please contact your Bissantz team if you require any assistance. If you use a Microsoft IIS Web server, for example, we have ASP scripts that combine several tickers into a window and display the last update as a tooltip. You can then customize these scripts to your individual requirements. The scripts move using the <marquee> HTML tag, which is not officially part of the HTML specification but is supported by all standard browsers.
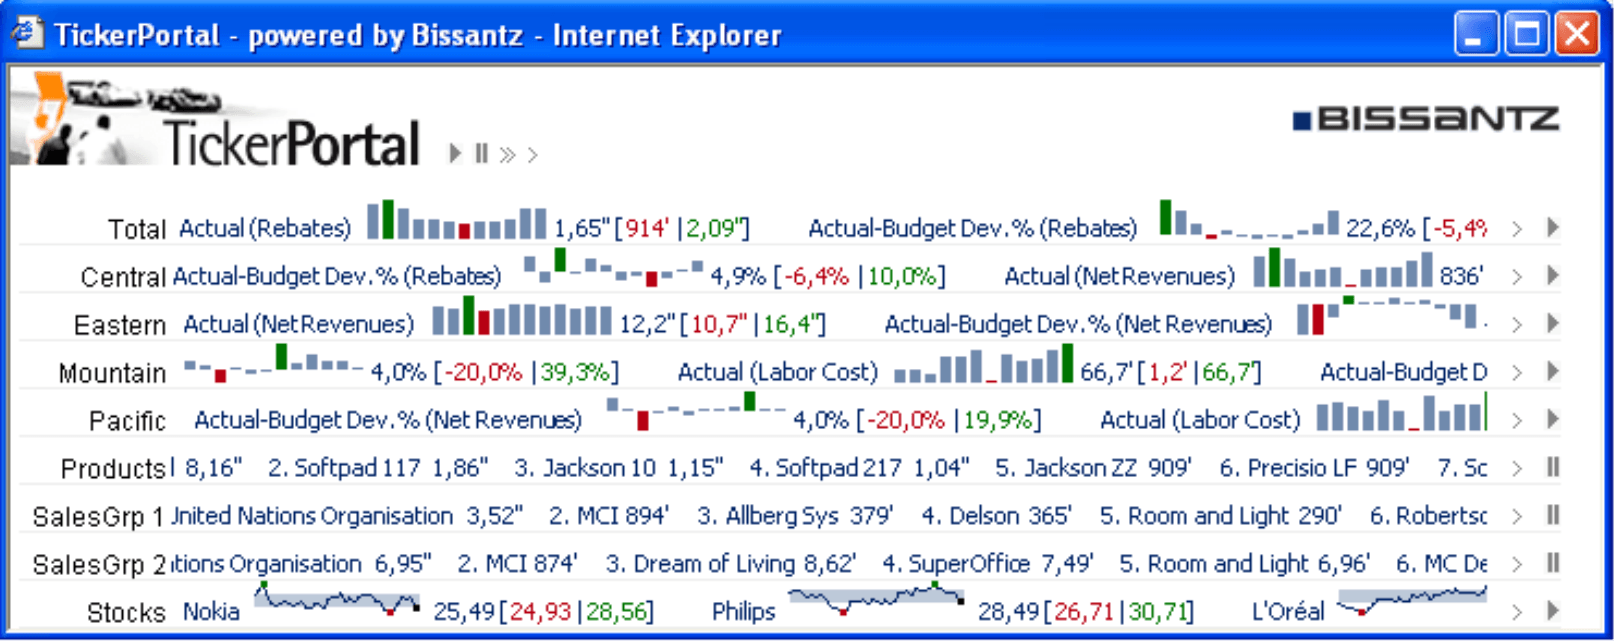
The screenshot above shows a multi-row ticker showing sales analysis KPIs based on our “Chair” reference model. The first five rows show the net revenues, rebates, labour costs and their budget deviations for the entire business and the four main sales regions. The data derive from a pivot table with column sparklines. Rows 6-8 show Ranking reports, which contain the top revenue-generating products and customers broken down by the two main sales groups. The last row shows a listing of current stock prices.
Questions? Comments?
Just contact your Bissantz team for more information!
