![]()
Greetings, fellow data analysts!
When you think about sophisticated analysis in DeltaMaster, the first thing that probably comes to mind is Miner mode with its complete analytic library and elegant, interactive visualizations such as the Hyper Browser. You can, of course, save these advanced methods to reports for all users to access. With the new Navigation Option, you can now even activate Hyper Browser, Semantic Zoom, and Pivot Navigation in Viewer, Pivotizer, and Analyzer levels so these users can flexibly browse, zoom, and navigate their data as well. You’ll see how these functions put a spring in their analytic steps – and how contagious that feeling can be. And that is important to reach people in the sense of “emotional” management information, which we are promoting along with Professor Gerhard Roth.
Best regards,
Your Bissantz & Company team
A good report doesn’t just answer a question. It raises many new ones as well. A few revenue and variance figures will not satiate people who carefully scrutinize their numbers for long. They will soon want to know more. How was the revenue development? What are the causes of the variance? What is the situation in other markets? Since these and other types of questions arise spontaneously when people are studying or presenting a report, DeltaMaster delivers the answers, quickly and easily, directly in the report. Professional analysts and report editors in Miner mode, for example, use the built-in Threaded Analysis Technology to drag and drop a given value into a specialized analysis method. But users in other modes can question values and analyze them in detail as well. Starting in version 5.5.9, you can activate the Navigation Option to add three powerful yet highly intuitive methods to Viewer, Pivotizer, and Analyzer modes:
-
- The Hyper Browser provides a graphical visualization and analytic preview of the analysis model.
- The Semantic Zoom is a patented method that lets you enlarge sparklines to display additional information as soon as enough screen space, which grows with each zoom level, is available.
- The Pivot Navigation is another patented method to drill down on a pivot table, step by step, and add additional columns or rows based on the respective context.
These components are part of the standard functionality of Miner mode. With the new Navigation Option, however, you can now use them in both the normal session view and presentation mode of Viewer, Pivotizer, and Analyzer. In this edition of clicks!, we will briefly describe the different components, show how you can prepare them in Miner mode for other user levels, and provide an overview of the licensing.
The context remains – and that’s good for the brain
What is so ingenious about these three methods is that they all maintain the context. They extend the original report or show a different perspective without changing the original underlying structure. Even the original values remain in sight (or, in the case of the Hyperbrowser, can be brought back instantly by moving the mouse). In other words, instead of jumping to another report, you continue to observe the information in the exact same place and with the exact same report that you used before.
This helps readers stay concentrated on the task without losing their focus. Findings in the field of brain research show that procedures like these help reduce strain on the human brain and counteract the phenomenon of change blindness, which is when people do not notice even major visual changes. The larger the jump in thought is, the more likely our brains will lose the connotation. If the change between the steps is too large, people will not recognize it as a change to the previous state and overlook it. One solution is to design the change in a flowing manner so that you maintain the known part of the visualization and integrate the next analysis step which the user triggers through a simple interaction. For more ideas on how to counter change blindness in financial controlling, please read our blog posting, “A subtle, yet bold statement” (www.bissantz.de/bissantz-ponders/neurocontrolling-2).
Hyper Browser
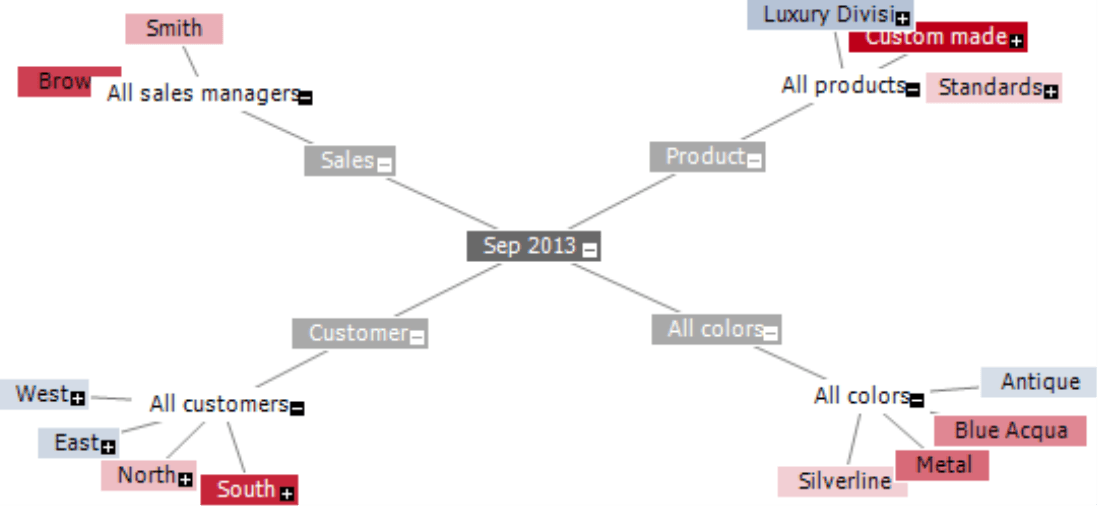
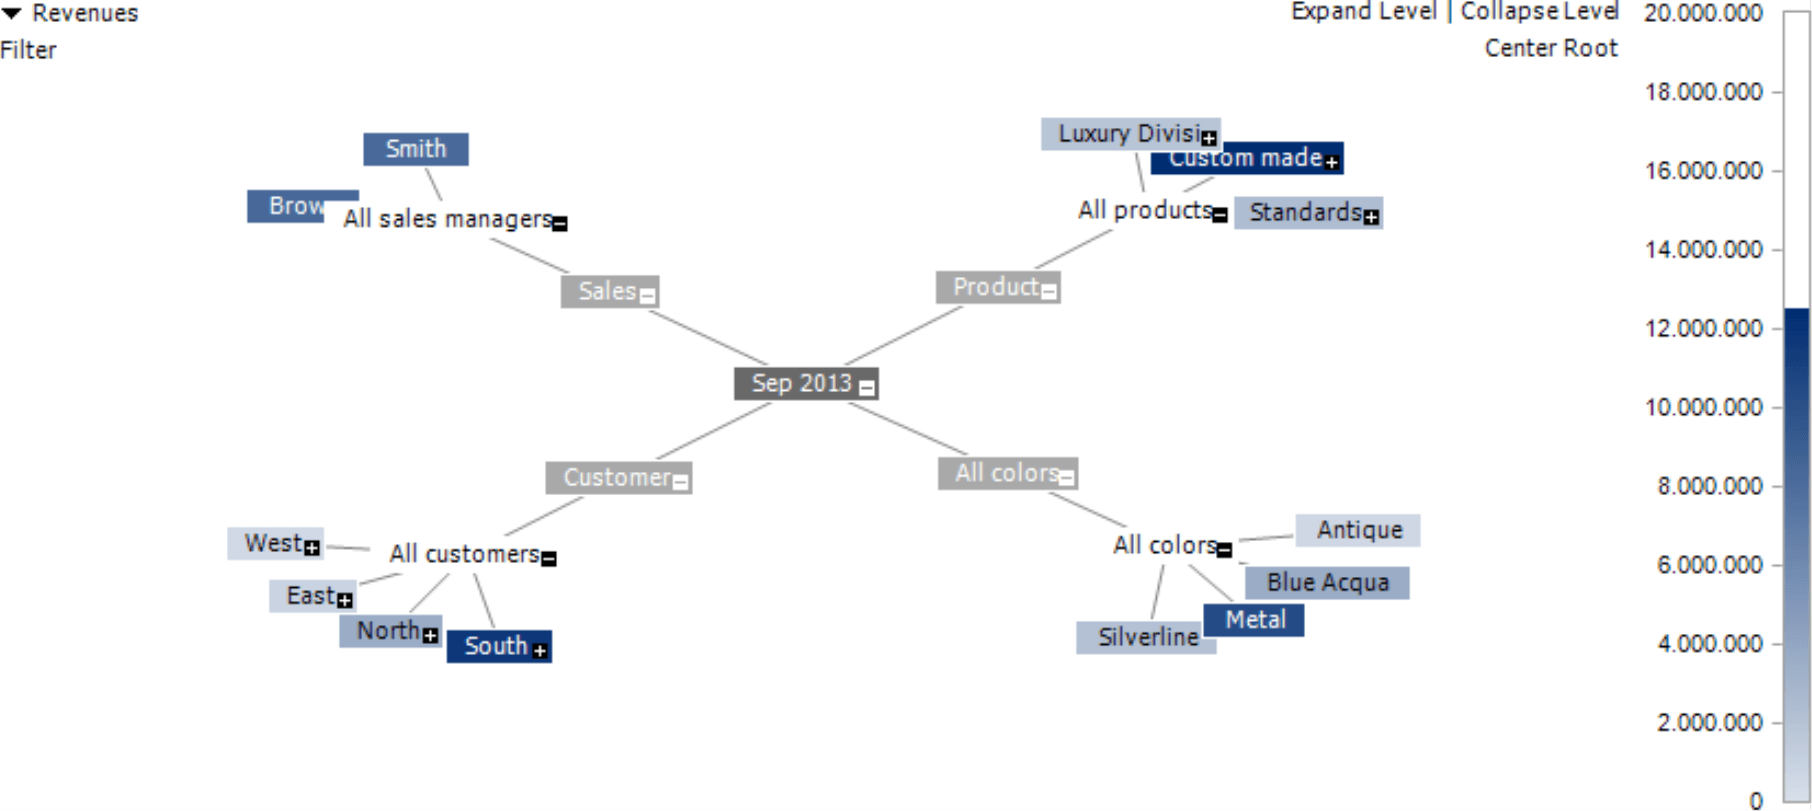
One of the most fascinating components of DeltaMaster is the Hyper Browser, also known as a hyperbolic tree or hypertree. The Hyper Browser displays the analytic model as a graphic that projects the dimensions, hierarchies, levels, and members radially on an imaginary ball that you can move with your mouse. You can activate this presentation in the View menu in the View window. This option also appears in Presentation Mode if you place your mouse on the right side of the screen or hit the shortcut Ctrl+H.
If you mouse over one of the nodes, the respective member will affect as an additional filter the report on the bottom half of the screen – we call this “analytic preview”. This allows you to quickly switch back and forth between members and compare the results – all without even a single mouse click.
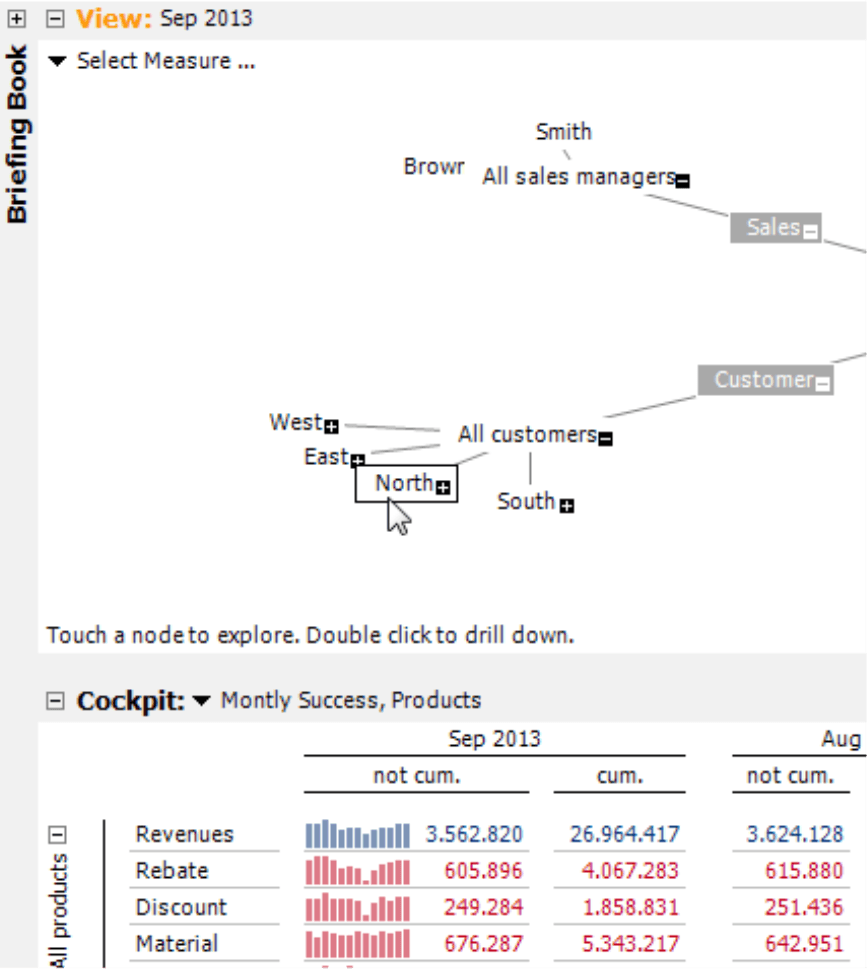
By clicking the link in the upper-left corner, you can select [a] measure, which DeltaMaster will use to color the tree. Alternatively, you can drag a value from the current report and drop it into the Hyper Browser. DeltaMaster carefully differentiates which object you have moved. If you drag the value 3,562,820 as shown in our example above, it will create a filter value (“Revenues, not cumulated, Sep 2013”). If you drag the measure name “Revenues” instead, DeltaMaster will transfer the revenues without a filter into the Hyper Browser. The results are intuitive to understand: The darker the blue, the better the results are; the darker the red, the worse they are. In the example below, the blue tone gets darker as revenues grow larger. As a result, you can identify all revenues drivers at a single glance. The color “Metal”, “Custom-made” products, and the customer region “South” all made strong contributions to revenues. Both sales managers also did their jobs comparably well.
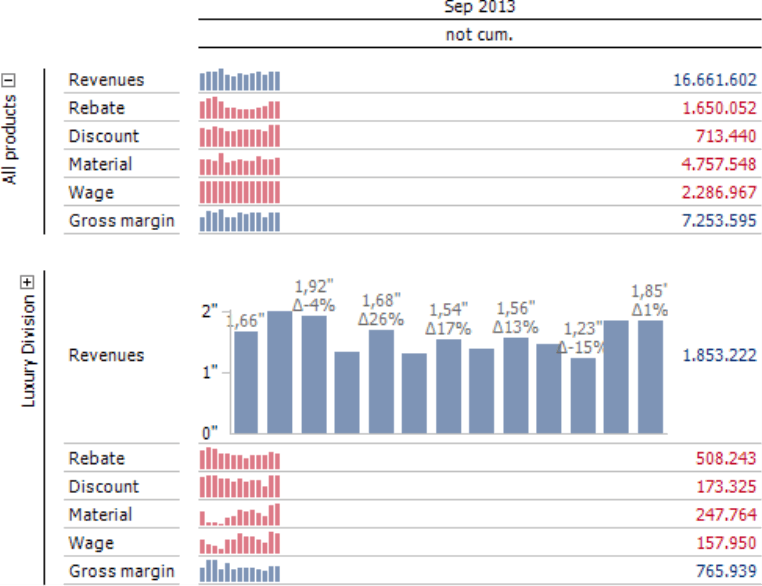
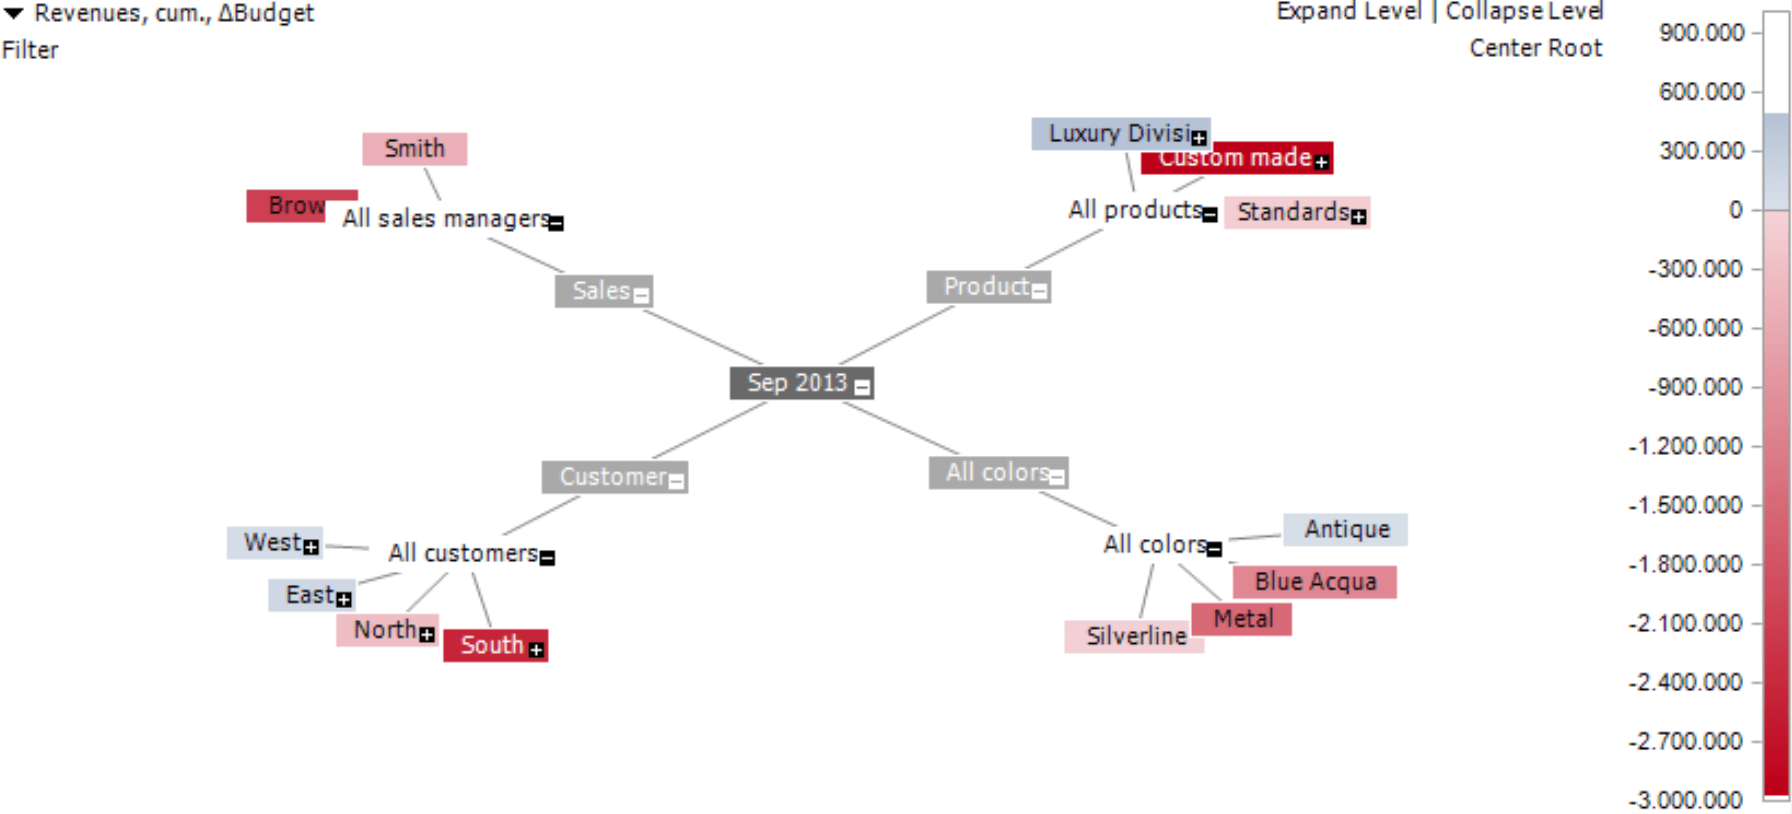
The Hyper Browser is very useful in displaying variances. Since this visualization automatically colors positive and negative differences, you can quickly recognize compensating effects. In the screenshot below, for example, you can see that revenues for custom-made models are considerably lower than planned while those for luxury models are slightly better than expected.
The Hyper Browser is most effective when it only has to display a manageable number of members. That, however, is not the case in all analysis models. On the lowest level of article or material lists, for example, you will often find thousands of members next to each other. Since it makes no sense to show all of them next to each other, you can now specify an Analysis Context, which determines the hierarchies and levels you want to display in the Hyper Browser, starting in version 5.5.9. This Analysis Context, which you can define in Miner mode, also applies to Viewer, Pivotizer, and Analyzer mode. You can also use this option to granularly manage which display and analytic capabilities users should have in these levels. In the default setting, DeltaMaster will automatically deactivate levels with more than 500 members to ensure that users do not accidentally open a level containing too many members. For more information, please read DeltaMaster deltas! 5.5.9, feature #6.
Semantic Zoom
The Semantic Zoom is used to enlarge sparklines in pivot tables. Instead of just drawing the sparkline columns or lines on a larger scale, DeltaMaster utilizes the available screen space, which also grows with each zoom increment, to display additional information. When you zoom in on a sparkline, you also gain more information, which is why we call it a Semantic Zoom. To make a sparkline larger or smaller again, hold and press the Ctrl key while you scroll the wheel of your mouse forwards or backwards. This creates a smooth transition from an in-cell graphic to a complete chart that is labeled in detail. If you hold the Ctrl and Shift keys while scrolling your mouse wheel, DeltaMaster will perform a Semantic Zoom for all sparklines in the table.
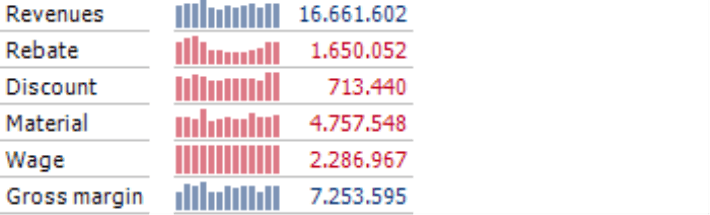
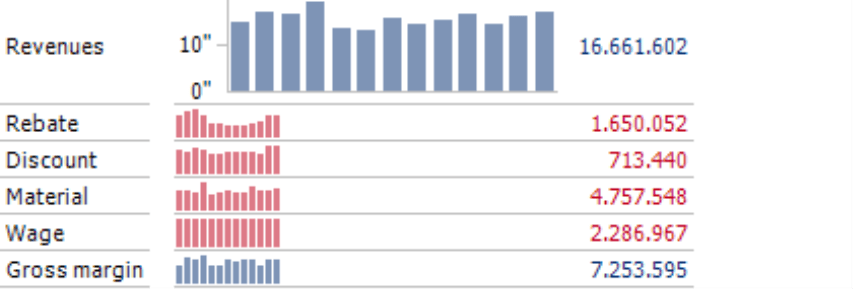
Let’s use a few screenshots to illustrate this zoom feature. Our starting point is a pivot table with sparklines. The Semantic Zoom works in the same manner for column, line, and dot line sparklines.
DeltaMaster will first draw the columns larger step by step.
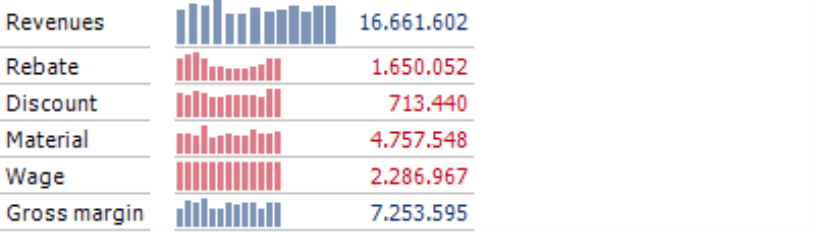
As soon as it has enough space, it will then draw the Y axis.
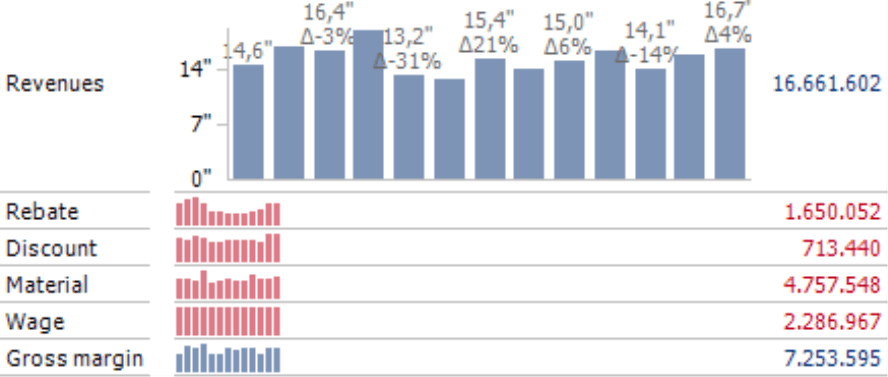
A few steps later, DeltaMaster will have enough space to label every second column with its absolute value and the percentage change to the respective value in the previous period. As soon as more space is available, it will label each column.
Behind the Semantic Zoom lies a kind of “profit ratio” consideration: The more screen space that you “invest”, the more “returns” you will receive in the form of additional information. DeltaMaster selects the zoom levels so that you can always make visual comparisons between the patterns of the enlarged sparklines and the normal ones. This way, you can study the development of a measure in detail without losing sight of the other patterns of development.
For more information about the Semantic Zoom, please read DeltaMaster deltas! 5.4.9, feature #18. In addition, you can learn more about exporting time series charts in DeltaMaster deltas! 5.5.7, feature #13. This function has the same behavior in all user levels and no individual settings.
Pivot Navigation
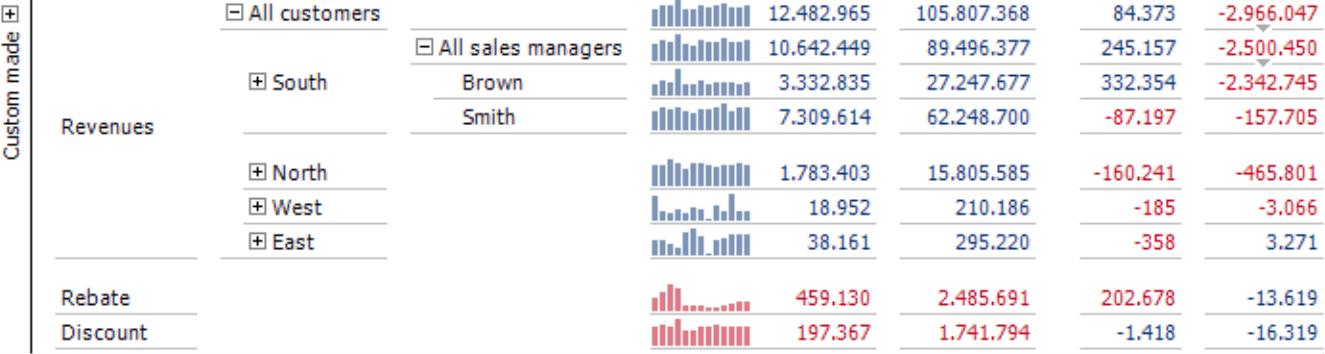
Pivot Navigation explains a value by showing how it is split among the members of a further dimension. The following screenshot illustrates this principle well. We analyze the cumulated budget-variance of the revenues (-2,573,107).
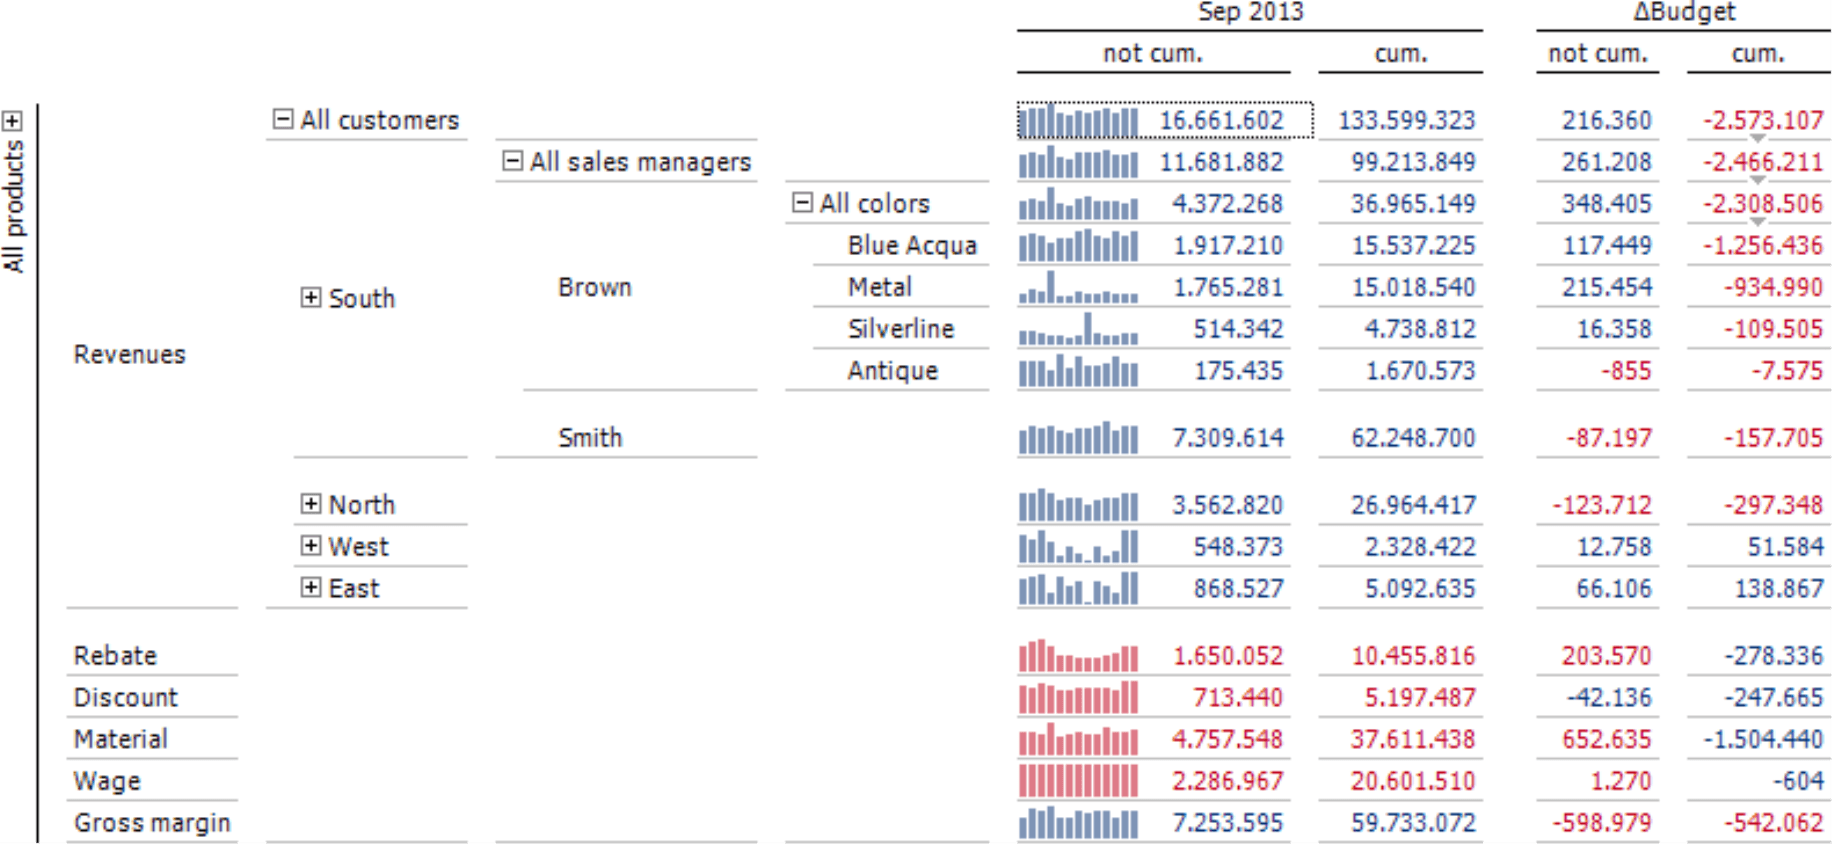
In the first step, Pivot Navigation analyzes the variance in the customer dimension through a drill-down. It then sorts the regions in descending order based on their variance. In this example, “South” is the region with the strongest variance. As a result, this region is broken down again, this time by sales managers. Here, the team Brown was responsible for the largest part of the variance. Now, this value is broken down again, this time by colors. You can use Pivot Navigation to break down any available dimension step by step. This makes it an ideal tool for analyzing drivers and variances. The step-by-step refinement of this method generates a wedge-shaped pattern in the table.
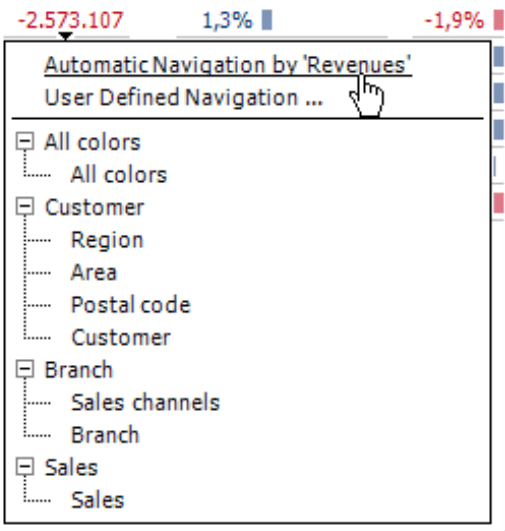
The question now is which dimension you should analyze in the next step. Here you can choose from three options:
- In the Automatic Navigation, DeltaMaster chooses the dimension that delivers the most promising insights and displays it as the next column. This option is powered by data mining methods that include the spread of the value that is being examined. You can perform an Automatic Navigation quickly by holding the Ctrl key while double clicking on the value.
- The second option is the User Defined Navigation. In this case, the user determines how the next column should be defined – either by using a dialog field similar to the Axis Definition or selecting the desired level directly in the hierarchy menu.
- The third option is the Predefined Navigation. Here, you can define a series of navigation steps in Miner mode and save them with the report (Table Properties, Pivot Navigation tab; see DeltaMaster deltas! 5.4.9, feature #15). A user can open this sequence by double clicking on a value in this report. Using this option is very easy because a user only needs to double click on an interesting number to investigate it further.
Similar to the Hyper Browser, you may wish to omit certain dimensions, hierarchies, or levels of the analysis in Pivot Navigation. To do this, you will need to define a Navigation Context in Miner mode (Cockpit window, Change menu, Configure Pivot Navigation, Navigation Context tab; see DeltaMaster deltas! 5.5.7, feature #5). The limitations that you define here will apply to all user levels and navigation options excluding the normal session mode in Miner mode, which always offers all available attributes. The Navigation Context is supported in the normal session modes of Viewer, Pivotizer, and Analyzer in version 5.6.0 and up.
In Miner mode, you also have two options to Configure [the] Pivot Navigation. With the first one, you can define the number (or remove the existing limit) of members that DeltaMaster should include in each new step. With the second one, you can specify that DeltaMaster should Show top and bottom members, including remaining members (i.e. not only the top or not only the bottom) for each step. This option is especially interesting for variances. For more information, please read DeltaMaster deltas! 5.5.7, feature #4, or DeltaMaster deltas! 5.5.8, feature #13. For more information about Pivot Navigation, please read DeltaMaster clicks! 10/2007.
Licensing
All of the functions described above are available in Miner mode. In order to use them in Viewer, Pivotizer, and Analyzer modes, you will need a separate license for the Navigation Option. In addition, you must activate the Navigation Option in Miner mode under Options (Extras menu) on the General tab for the current analysis session or application. This option ensures that you use the license efficiently. In planning applications that primarily focus on data entry, for example, you will rarely need the functionality of the Hyper Browser, the Semantic Zoom, and the Pivot Navigation. As a result, you do not need to occupy a license for this type of application.
If you already have an additional license for the previous Hyper Browser Option, you can use the Semantic Zoom and the Pivot Navigation in addition to the Hyper Browser with this same license starting in DeltaMaster 5.5.9. If you wish to test the functionality of the Navigation Option, we would be happy to provide you a license for testing purposes. Please contact your account manager for more information.
