![]()
Greetings, fellow data analysts!
Many regular sources of information follow specific conventions or guidelines regarding the content and order for reporting things. Standards for form and content make it easier to create and use reports as well. With DeltaMaster, you can even standardize things that are not part of the initial report – namely, the interactive steps to trace values and variances back to their origins. Using the Pivot Navigation, you can define and save analysis paths directly in a report. With a simple double click or tap, users can access them intuitively and start a detailed analysis using the exact steps that you intended. Best of all, setting it up is simple. We will explain how in this edition of DeltaMaster clicks!.
Best regards,
Your Bissantz & Company team
The Pivot Navigation in DeltaMaster is a tried-and-tested method to interactively start a detailed analysis in a pivot table. Using a drill-down function, it expands the pivot table – column for column or row by row. Each step adds a dimension and explains how the respective starting value is broken down among the members of the new dimension that is displayed. You can determine which dimension DeltaMaster shows next in various ways. One popular choice, which is simple for end users as well, is the predefined navigation: If you double click on a value in the table or tap on the “Plus” button (DeltaMaster Navigator), DeltaMaster will run the next step in a certain order that was defined in advance and saved with the report. In this edition of DeltaMaster clicks!, we will show you how.
Variance analysis, step by step
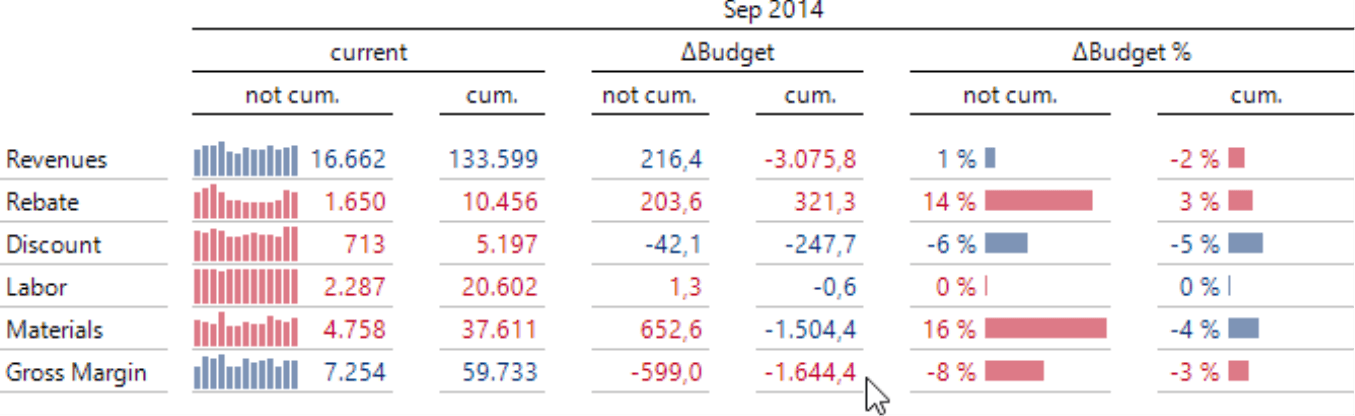
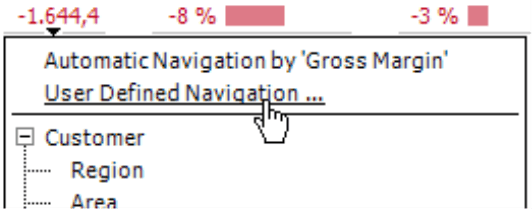
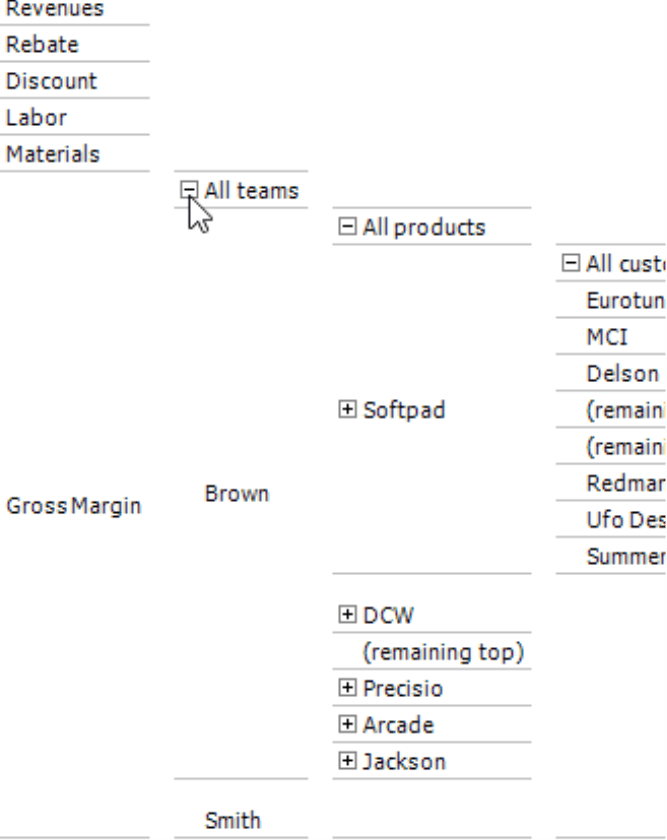
Let’s use the following screenshot from DeltaMaster 6.0.1 Navigator as an example. The mouse pointer shows that the cumulated budget-actual variance for Gross Margin is ?1,644.4. Using the Pivot Navigation, you can examine the reasons behind this variance.
If you double click on the value you want to analyze, DeltaMaster will insert an additional dimension – in this case, the sales teams – into the table and show how the variance breaks down among the individual members of this dimension.
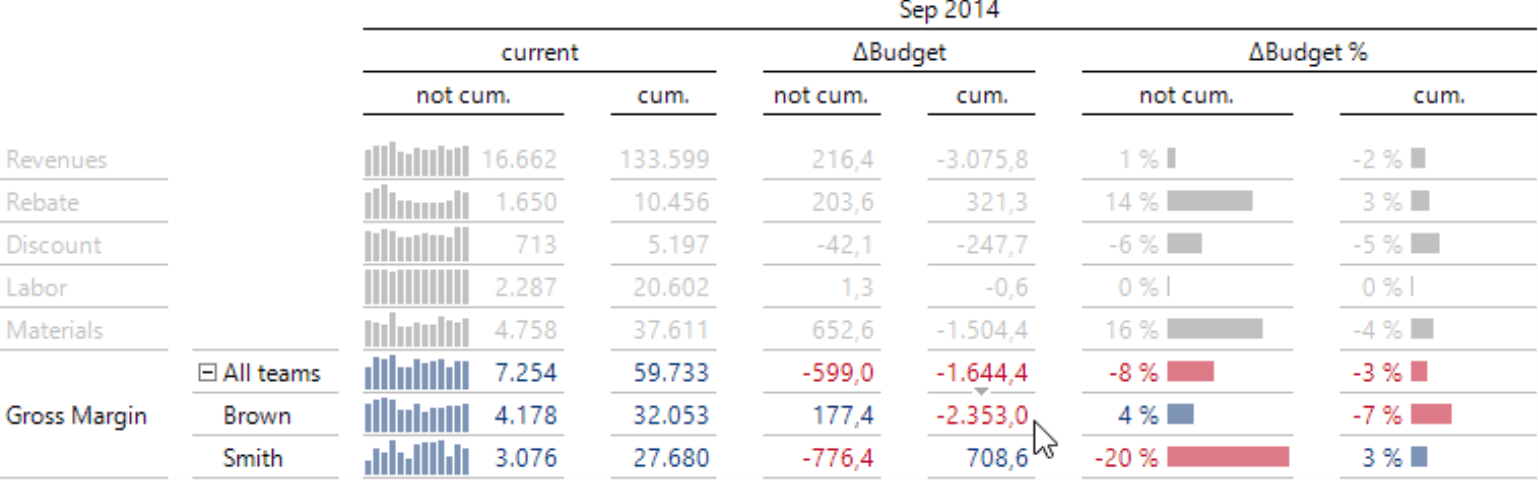
In our example, as shown in the screenshot above, you will see this exact dimension (and no other one) because it was defined as the first step of a predefined sequence. It doesn’t matter if you start the analysis from current revenues, cumulated discounts, absolute variance of the material costs, the relative variance of gross margin, or some other value. The breakdown by sales teams will always be the first step in this table. Here you can see that the team Brown was responsible for the largest part of the variance (-2,353.0). With another double click, DeltaMaster will break down this number further.
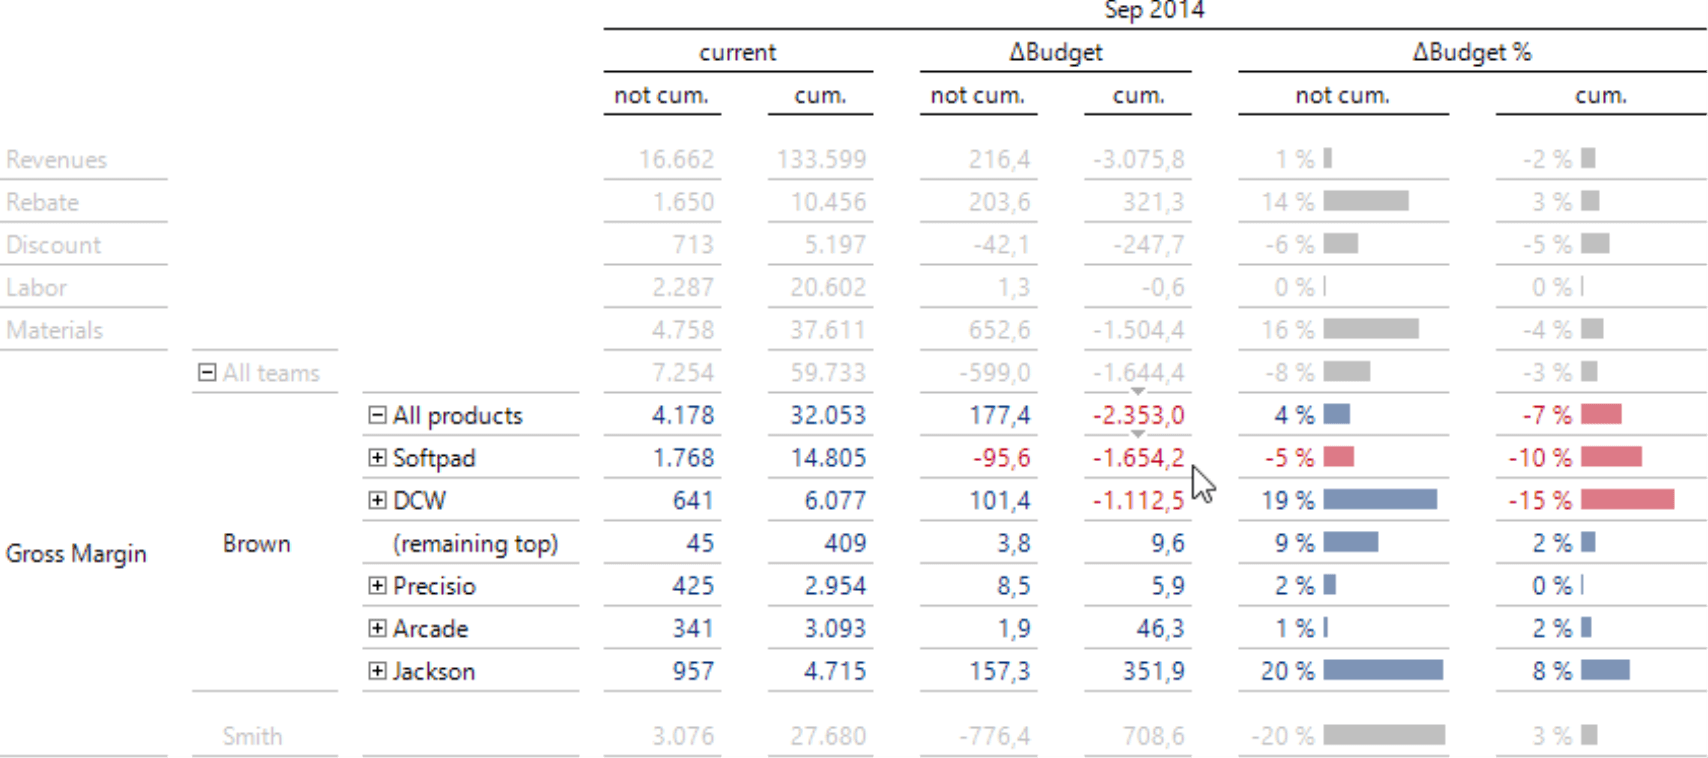
Products, the dimension defined in our sample table as the second step, were added next. Softpad (?1,654.2) was the main driver behind the variance of sales team Brown. DeltaMaster will provide even more information if you double click again.
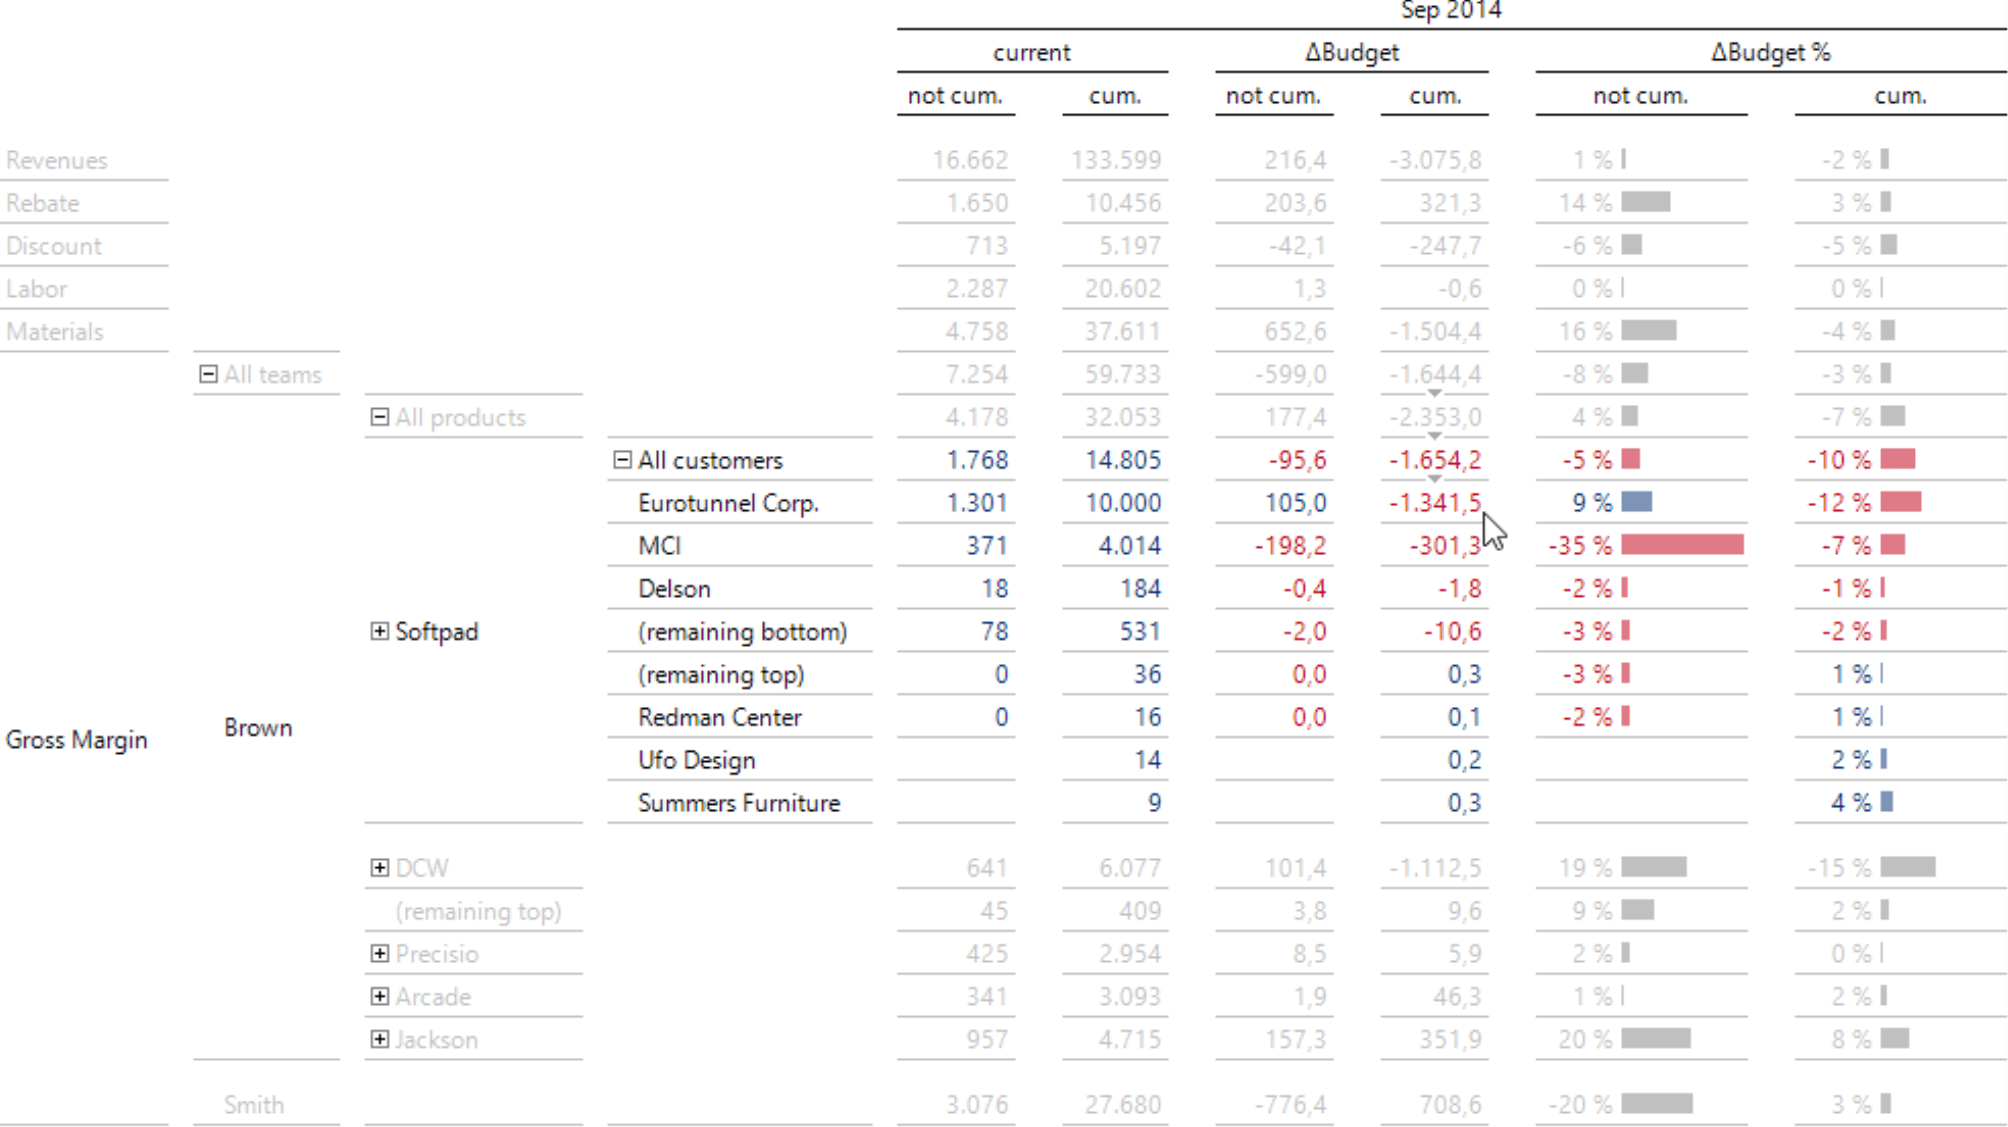
Now DeltaMaster shows the customers as well. Here you can clearly see that it doesn’t simply return all of the members of this dimension. Instead, it only returns the most important ones – namely, those with the strongest positive and negative variances. DeltaMaster grouped customers with smaller negative variances into the member “remaining bottom”, customers with smaller positive variances into the member “remaining top”. This reduction, which is characteristic for the Pivot Navigation, is intended to direct your attention to the most important objects. In fact, you can sort the dimension members and limit the count in each step (or change the default setting in DeltaMaster).
For the sake of this example, we decided to leave it to three navigation steps. Generally speaking, you can make your analysis paths as long as the number of dimensions that you have. In each step, the users can opt to diverge from the defined path to continue the analysis on their own (i.e. using hierarchy menus which are shown for the respective values) or use the integrated data mining method. This edition of clicks! will only delve into the predefined navigation.
Predefining means analyzing in advance
In order to specify navigation steps in advance, you need to edit the respective pivot table in Analyzer or Miner mode. This involves four mandatory steps:
- Run the Pivot Navigation using the same steps you want to define for other users.
- Save non-automatic steps (on row axis) as default (Table Properties, Pivot Navigation tab).
- Collapse the navigation steps until you return to the original table.
- Save the report.
In other words, DeltaMaster will derive the analysis path based on a Pivot Navigation that you have already run (e.g. and not in a separate configuration dialog box). This method may remind you of macros that you record and run using your keyboard or mouse.
Think straight
Report consumers, therefore, access the Pivot Navigation using the exact same steps how the report editor had run and saved it previously. As a result, you should invest the time to think out the analysis path carefully from a business standpoint. Two things are very important: the order in which the additional dimensions appear in the table and the selected dimension members in the respective navigation step.
Order
To define the order of the dimension, use the user driven navigation, which is primarily the hierarchy menus of the pivot table. These hierarchy menus will appear if you mouse over one of the little, black arrows displayed under the data cells as soon as you position your mouse in the lower section of the data cells. If the hierarchy menu is very long in your application or allegedly contains double entries (i.e. typically dimensions with the same names as the level), you should check the setting for displaying hierarchy menus in the Options (Extras menu) as described in DeltaMaster clicks! 02/2011.
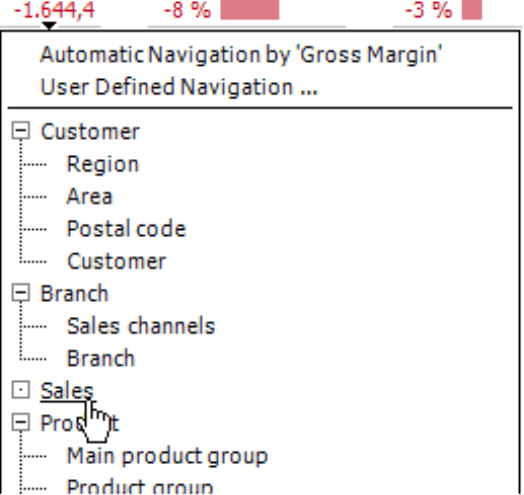
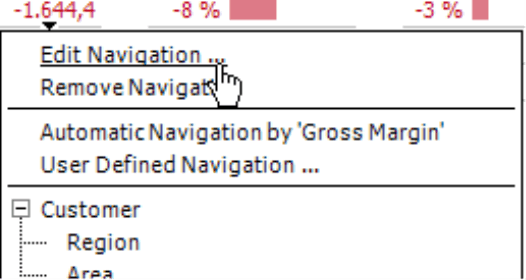
The Automatic Navigation, which is offered at the top of the menu, is not relevant for predefining analysis paths. It applies a data mining method to select the next dimension depending on the current data constellation. Although this function is very useful when you are uncertain where to begin, it is an entirely different task. If you define an analysis path in advance, you want the analysis to always follow the same steps – and not different ones.
When defining the order of the dimensions, you should also keep in mind how users or departments in your company typically discuss and question their numbers. Some companies follow specific guidelines; some departments have even defined standard agendas. (In some cases, the Pivot Navigation could even trigger these types of standardized procedures because it creates the ideal requirements to introduce and enforce standards.) In case of doubt, observe how strongly the dimensions distinguish and use that as a guide. It usually makes sense to start with dimensions that only have a few members, thus, distinguish strongly. The dimensions with many members follow later on. Sales controllers, for example, first ask for regions or countries and then products. Responsibilities within the organization also provide valuable information: Attributes, where you know who is responsible for the respective results or who can influence them, often appear at the beginning of the analysis path.
Member selection
For each navigation step, you need to select which members from the respective dimension you wish to use. You can do this either explicitly (i.e. you select them individually) or implicitly (i.e. DeltaMaster automatically selects them based on the default settings).
- If you select a dimension or level with the hierarchy menu shown above, the current default settings for the Pivot Navigation will automatically apply to this step.
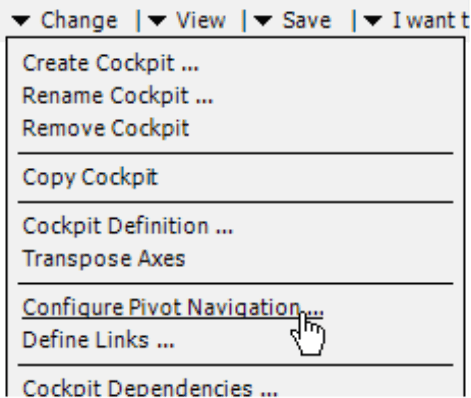
You can edit these default settings in Miner mode by configuring the Pivot Navigation (Change menu in the Cockpit window).
Here you can opt to limit results to “X” number of members. This helps the report consumers stay focused since only the most important members are included. Alternatively, you can also choose the option to show top and bottom members (by algebraic sign) including remaining members as shown with the customers in the example above. This is especially interesting for variances: This option displays positive and negative variances together in one table. For more tips, please read DeltaMaster clicks! 02/2015.
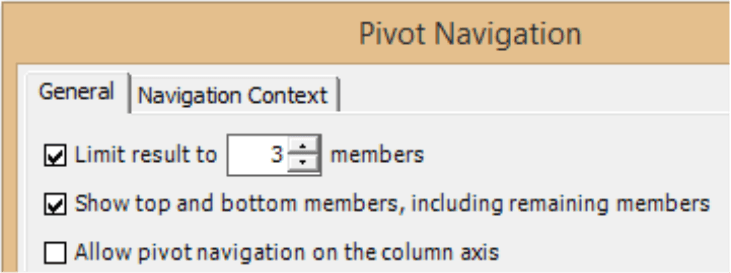
If you work in Analyzer mode or do not customize the configuration of Pivot Navigation in Miner mode, DeltaMaster will apply the default setting which sorts the members (top or bottom depending on the factor in the Measure Properties and the algebraic sign of the actual value) and limits the count to 10.
- Alternatively, you can define each step explicitly (i.e. individually) by using the hierarchy menu when you create the step or anytime afterwards.
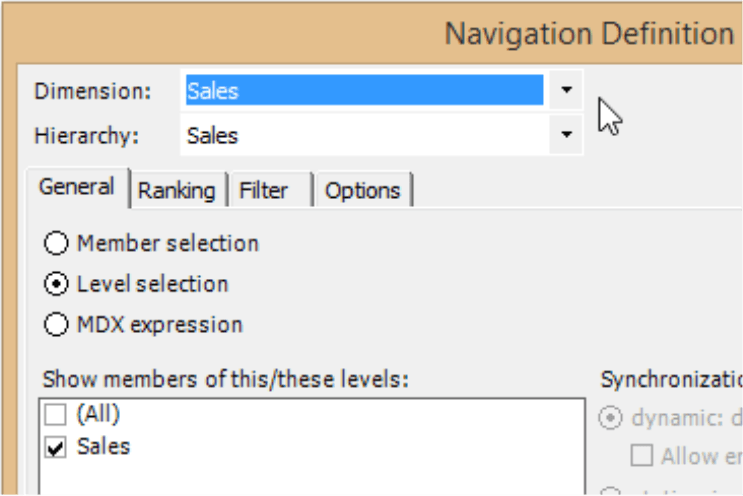
If you choose the user defined Navigation in the hierarchy menu, DeltaMaster will open the Navigation Definition dialog box where you can define the next navigation step in detail.
This dialog box is, more or less, the same as the Axis Definition when creating pivot tables. You can use it, for example, to define how users can select members: individually as a Member selection (e.g. pick list), by levels as a Level selection, or using an MDX expression. The regular options to sort (Ranking) and Filter members are also available. What is different from the Axis Definition is that you select the desired dimension at the very top of the Navigation Definition. (In the Axis Definition this is fixed because it is predefined through the Report or Cockpit Definition).
The same dialog box will also open when you edit a Navigation for a predefined step at a later time. You can use this menu on steps that were configured implicitly or explicitly.
Due to the close similarities between the Navigation and Axis Definitions, you can also view the Pivot Navigation as a series of nested pivot tables. In each nested pivot table, a member of the next, outside table works like a filter on the row axis.
Save & go
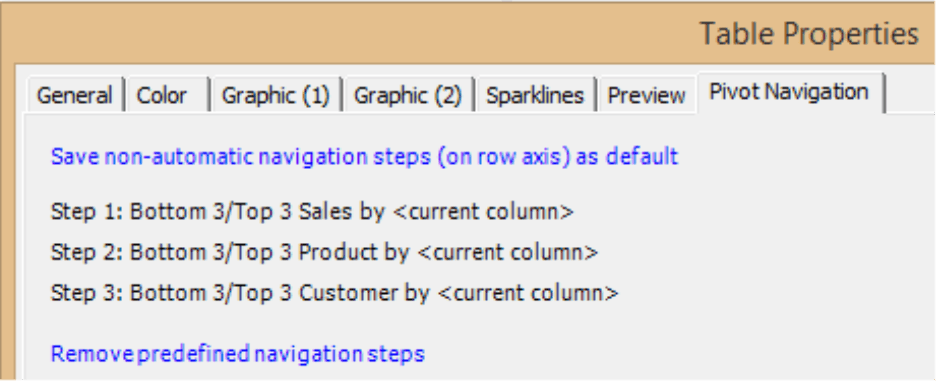
Once you have run the Pivot Navigation as the task at hand requires, open the Table Properties (context menu or I want to menu, or F4 key). The Pivot Navigation tab contains a summary of the analysis path. Here you can save non-automatic navigation steps (on row axis) as default by clicking on the respective link. The word “non-automatic” is used here to remind you that DeltaMaster will only save these steps as explained above. If you use the automatic navigation somewhere in the table, DeltaMaster will only include the path to that point. “On row axis” was added to remind you that you can only save a standard analysis path on this axis. This is no major limitation because you would only use the Pivot Navigation on this axis anyway. “As default” was also added to emphasize that the saved analysis path will serve as a default setting so that report consumers can use the Pivot Navigation in a very comfortable, intuitive way. Generally speaking, they can still use the other options as well (e.g. hierarchy menu and data mining automation).
Back to the beginning
Once you save the navigation steps as default, close the Table Properties. The analysis path is saved in the pivot table but is still open as well. If you saved the report like this, you would have to trace back the steps of the navigation each time you open the report before you can start the interactive navigation.
As a report editor, therefore, you should close each step run in the navigation to restore the table to its original form. The easiest way to do this is to collapse the first step by clicking the minus sign. This will close all of the following steps as well.
At the very end save the report and the application or analysis session. You can now use the predefined navigation in Viewer and Pivotizer modes (see DeltaMaster clicks! 04/2014). If you double click on any values in the table, you can analyze them using the same steps defined previously. You can also use the predefined navigation in Web Option or DeltaMaster Navigator; no additional licensing is required.
Questions? Comments?
Just contact your Bissantz team for more information.
