![]()
Greetings, fellow data analysts!
Consumers who are conscious about their health or figure religiously check the nutrition labels to see how much fat is in certain food. In England, on the other hand, they simply use traffic-light colors to warn of excessive salt, fat and sugar. But who knows how they define “good” or “bad” when the numbers are missing?
Germany’s regulations for cheese are even better. Manufacturers are required by law to display the fat content in dry weight on the packaging. This way, everyone can see that camembert and pecorino both contain 48% fat… in dry weight, of course. The only problem is that dry weight is measured by extracting all water out of the cheese. While soft cheese contains a lot of water, hard cheese barely has any. As a result, hard cheese generally contains more fat than soft cheese. In other words, the argument for comparing percentages has more holes than Swiss cheese itself.
The point of this story is to use percentages with caution. Don’t forget to look at the absolute numbers – or observe them both and weigh them alongside each other. This way, you can make comparisons more easily and make your reports even stronger. We’ll show you how in this edition of clicks!
Best regards,
Your Bissantz & Company Team
One of the main tasks for a controller is to identify and report variances and then analyze them in further detail. That’s why many DeltaMaster applications use a separate dimension for “value types”, also called scenarios, presentation, etc. These dimensions usually contain at least four members: actual, budget, absolute variance and relative variance. With DeltaMaster you can define these variances in the application itself – and not only in the database.
Since these types of comparisons are so common, DeltaMaster even has a separate editor which you can access from the Dimension browser (context menu or I want to… menu). Here, you select which members should be subtracted from each other. The most common forms are:
Absolute variance =Actual – Budget
Relative variance =(Actual – Budget) / Budget
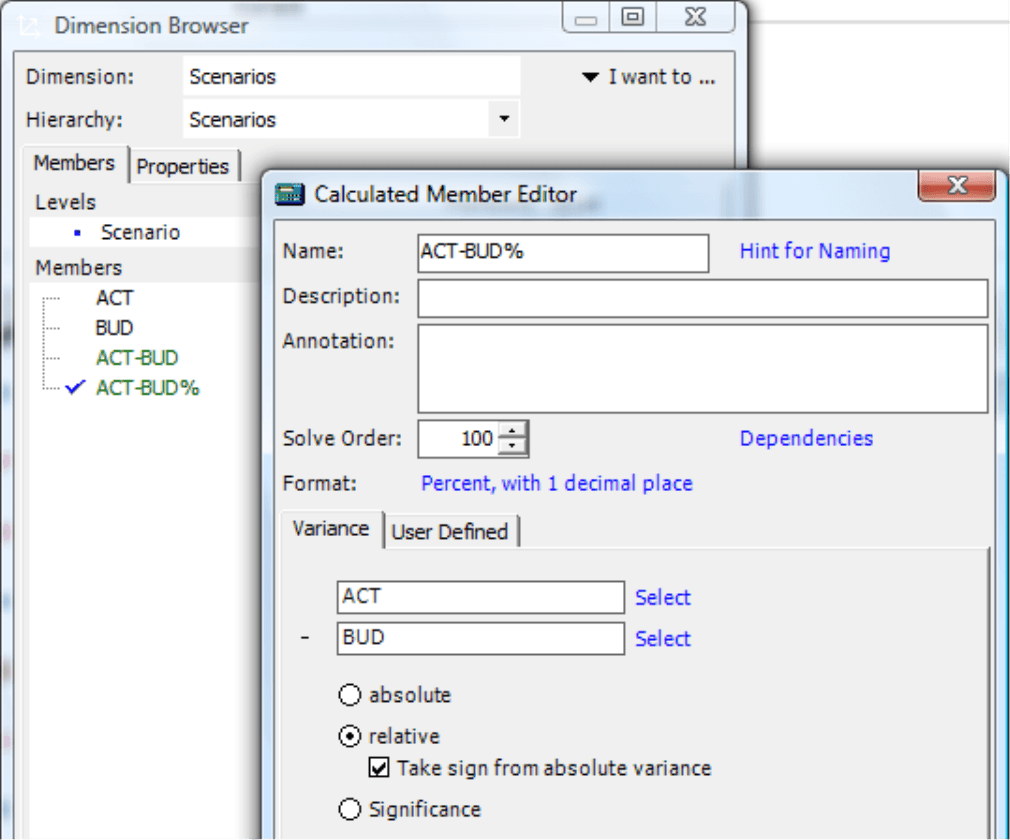
In the case of a relative variance, DeltaMaster divides the difference by the bottom value in the dialog field. If the budget value is negative, the relative variance can have a different algebraic sign than the absolute variance on account of basic division rules, for example:
| Budget | –100 |
| Actual | –90 |
| Actual – Budget | –90 – (–100) = –90 + 100 = +10 |
| (Actual – Budget) / Budget | = –0.1 = –10 % |
Although the math is correct, this type of result can be confusing from a business standpoint. That’s why DeltaMaster offers a separate option to automatically change the algebraic sign so that it is identical for both the relative and absolute variance. To activate this option, simply tick the checkbox.
When the value types are stored in a single dimension, you can easily switch from a report containing actuals to one with variances – or to place these different perspectives next to each other in the table for comparison.
Notation for designating value types
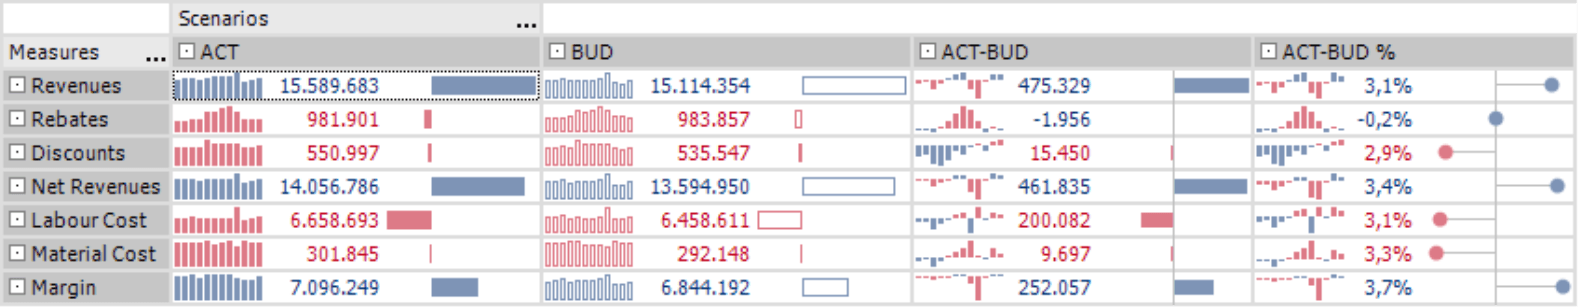
The chart above contains Notations, a new function in DeltaMaster 5.3.5. The underlying idea is that in addition to explaining relationships among numbers, graphical tables should also show which content is being reported in a clear, simple manner. Rolf Hichert, one of the leading experts for information design in Central Europe, backs this same concept.
As you can see in the chart above, the graphical elements differ accordingly. This example uses filled bars to show actuals and empty bars to display budget values. While absolute variances are drawn with a bar to the left and right of a line representing zero, relative variances are illustrated using points to the left and the right of the line. For more information, please read DeltaMaster deltas! 5.3.5, feature #1.
Analytical is neither absolute nor relative
Observing absolute and relative variances is very common. It may surprise you, therefore, that this information can’t really help you answer detailed, analytic questions:
- A small percentage error can result in a terrible financial loss when you are dealing with billion- dollar figures.
- A large percentage change is irrelevant when you are only talking about a few Euros.
- When you are dealing with absolute numbers, it is often hard to tell if they are large or small. A monthly salary of $100,000 is huge, but if that same number represents a .2% variance of a $50 million revenue target, no one would probably take notice.
When working with profits or financial KPIs, you might even be willing to deal with the notion that interpreting these numbers isn’t easy anyway. The problem starts, however, when you really want to analyze them. If you want to see where you need to take action and where you don’t, you will need to analyze several similar divisions, contract types, product groups, sales regions or other report objects. In this case, however, knowing absolute or relative values alone won’t help you much.
Why? Let’s prove this point with an example:
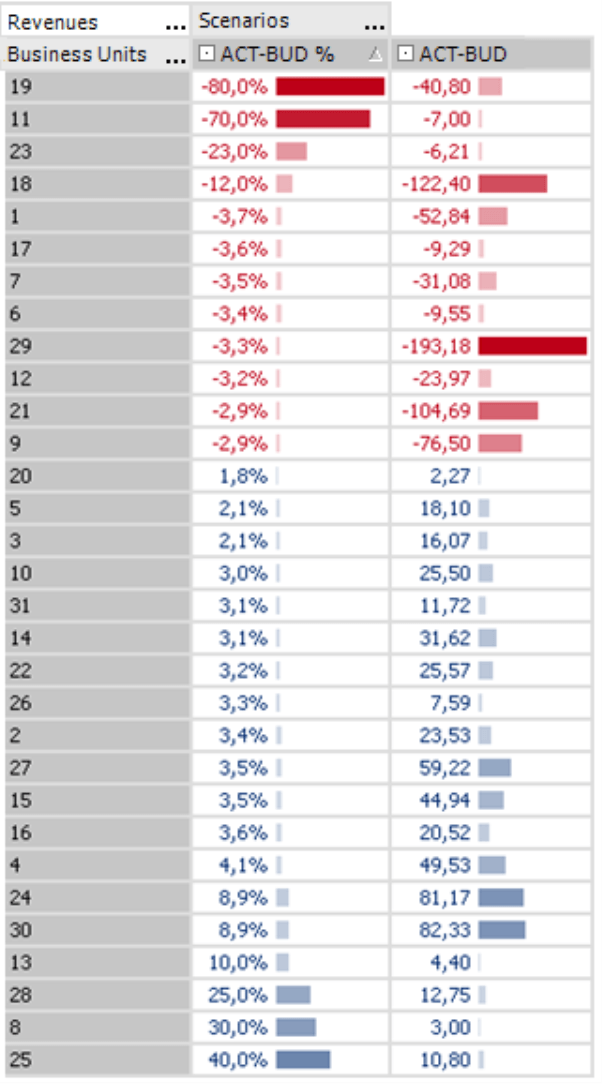
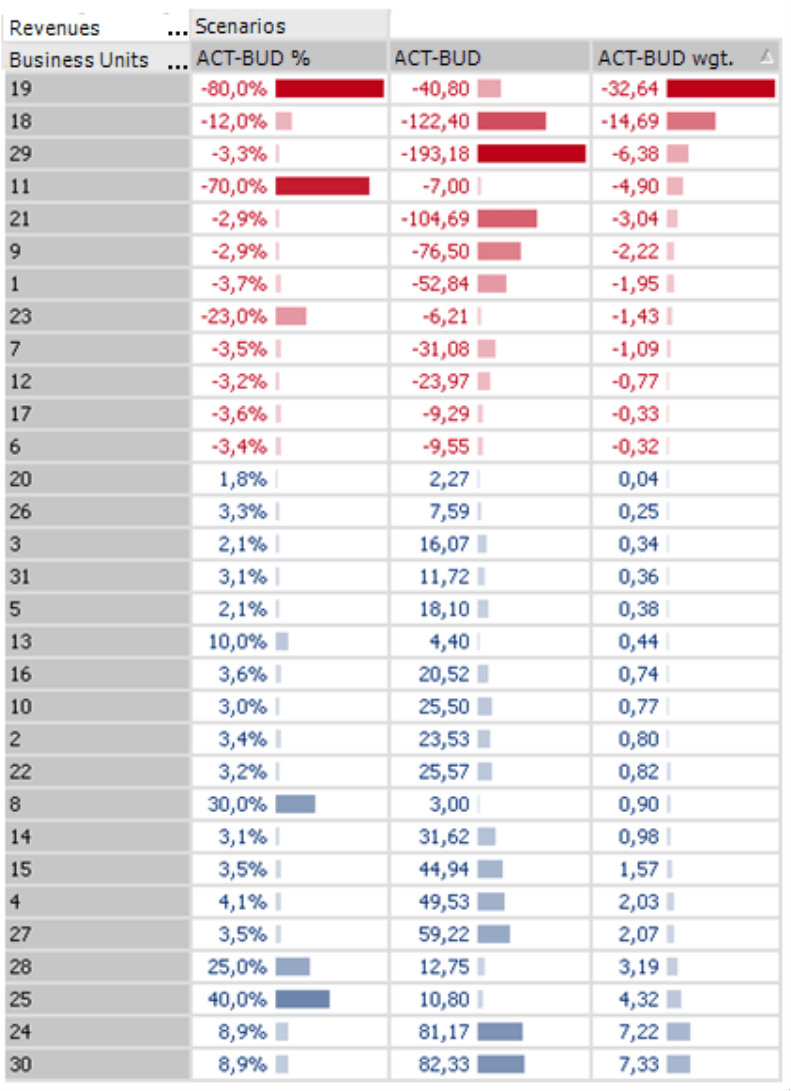
The pivot table on your right shows the budget-actual variance for sales in 30 business units of a company. The column on the left shows relative variances, while the one on your right displays absolute variances.
The table is sorted by relative variances. In addition, we have displayed the Bars context menu and activated the Cell coloring with Business Colors to create an attractive, informative graphical table.
You can quickly see that that the first few rows contain dramatic relative variances. Fortunately, however, they all have relatively low absolute differences, so there is no need to launch emergency measures to correct these variances.
If we sort the table based on the absolute variance in the second column, the picture is just as lopsided. The highest numbers come from business units that deal with larger numbers in the first place, because their relative variances are all relatively low.
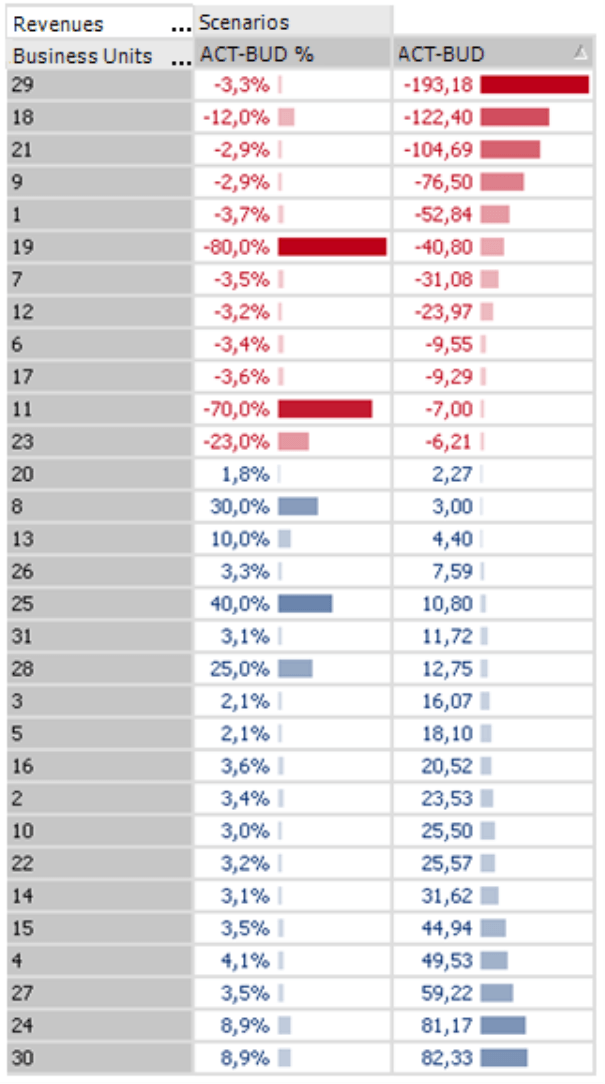
As illustrated in the charts above, neither the absolute nor relative variances could help us identify which report objects really deserve our attention.
Weighted variance
The way out of this situation is surprisingly simple. You can create a weighted variance by multiplying the absolute values by the relative ones.
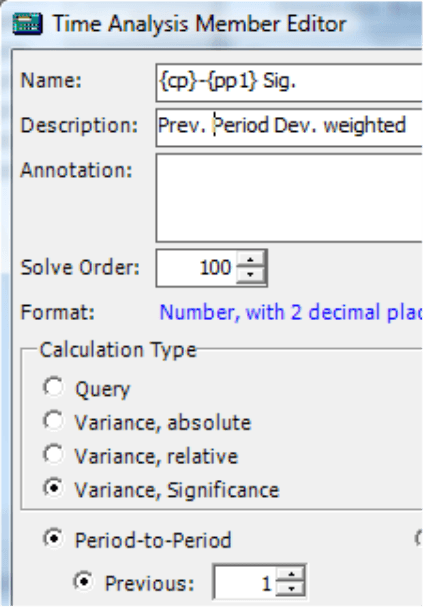
DeltaMaster even does most of the work for you! The dialog for creating calculated members offers a third variance type called Significance (see the screenshot on page 2 for more information. Please note, however, that this feature will be renamed Weighted variance in future releases). The algebraic sign of the weighted variance is identical to the absolute variance.
In the screenshot on your right, therefore, we have added a third column containing the weighted variance and have sorted the table based on this column. And look: the truly critical business units are now located at the top of the list. This chart now takes absolute and relative variances into account and combines them to create a powerful message.
The weighted variance is a statistical measure. Its sum cannot be interpreted in any meaningful way and probably would not be displayed in a standard report. Or to say it more bluntly, the director of business unit #30 would probably not brag that his achieved a 7.3 significance score. All joking aside, the advantage of this feature is to bring report objects in order and quickly identify where things are happening.
Weight in time analysis members
In addition to measuring variances among value types, you can also measure variances over time. We examined these so-called time analysis members in detail back in DeltaMaster clicks! 8/2007. Here, too, you can open the weighted variance as described above. In this case, however, DeltaMaster will always deliver the relative variance using the same algebraic sign as the absolute variance (i.e. as if the check box were activated).
Questions? Comments?
Just contact your Bissantz team for more information!
