![]()
Greetings, fellow data analysts!
A few of our readers disapproved of our criticism of percentages in the June issue of clicks!: If you remember, we said that comparing them is, well, “cheesy” in certain cases. We thought, therefore, that we should put things into perspective – which is the purpose of percentages in the first place – and do something to restore their image. Although it should be viewed critically when the absolute reference values are different, unknown or not given, relative size can help explain the significance of individual objects as a whole.
For example, which percentage of total revenues can we trace to an individual customer or product? Using DeltaMaster, we can quickly get the answers to this and other questions using a variety of different features. We will introduce and explain these in detail in this edition of clicks!
Best regards,
Your Bissantz & Company Team
![]() If you want to know which percentage a certain customer contributes to total revenues, the math is relatively simple. To get the desired percentage, you simply divide the customer’s revenues by the total revenues. You only need to ensure that the divisor is not zero, because dividing a number by zero is undefined and, therefore, forbidden. In many reports, you probably even display percentages next to the absolute values so that you can quickly assess the amounts in question and their relevance to the sum as a whole.
If you want to know which percentage a certain customer contributes to total revenues, the math is relatively simple. To get the desired percentage, you simply divide the customer’s revenues by the total revenues. You only need to ensure that the divisor is not zero, because dividing a number by zero is undefined and, therefore, forbidden. In many reports, you probably even display percentages next to the absolute values so that you can quickly assess the amounts in question and their relevance to the sum as a whole.
In DeltaMaster, you can observe percentages in many different ways:
- Through measures
- Using calculated members
- In Rankings (i.e. as a byproduct)
- As a formula in a Flexreport
- In a Flexreport using pivot table presentation options
The following sections will explain these different options to help you understand which approach is best suited for which task. For example, we often pose the question which percentage a certain customer or customer group contributes to total revenues. Of course, however, you can also use this same approach to examine other additive measures and dimensions.
Measures for sums and percentages: filters and quotients
One possibility is to define the division (i.e. individual revenues by total revenues) in a measure. As a first step, you will need to determine the total revenues for all customers.
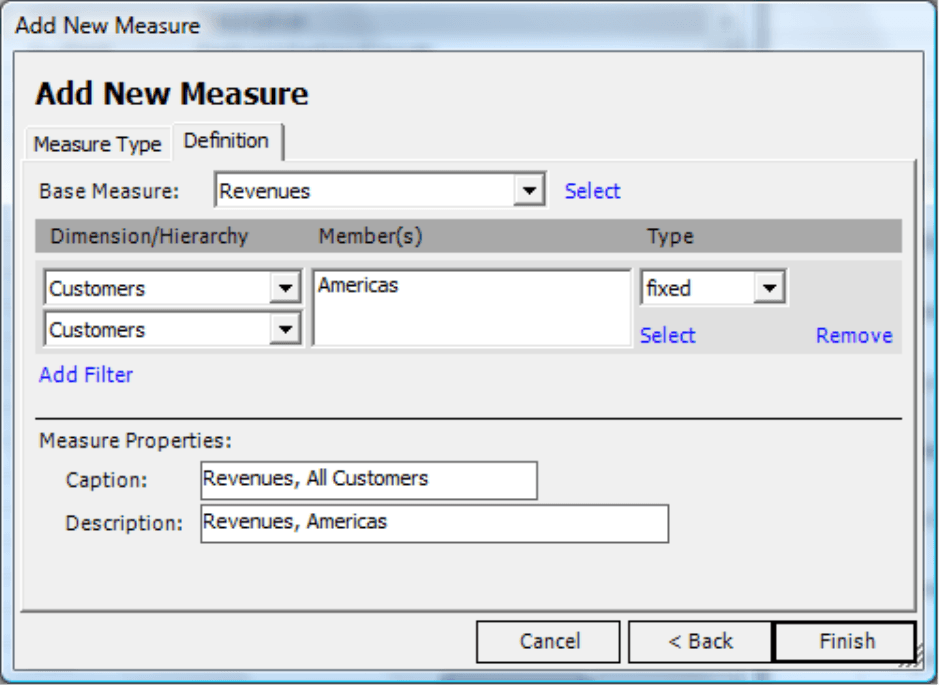
To do this, you simply Add a new measure (Model menu or the Measure browser in the I want to… menu) of type Filter. In the Customer dimension, you then fix “Revenues” on the top member, which is “Americas” in our “Chair” reference model as shown in the screenshot on your right. (In this case we need a fixed filter. To review the differences among variable, identical and fixed filters, please see DeltaMaster clicks! 3/2008.) The defined measure delivers the sum of the revenues for all customers regardless of which customers are listed in the My view window or are displayed in a pivot table. All remaining selections, e.g. restrictions in other dimensions such as a certain product group or time frame, will remain relevant.
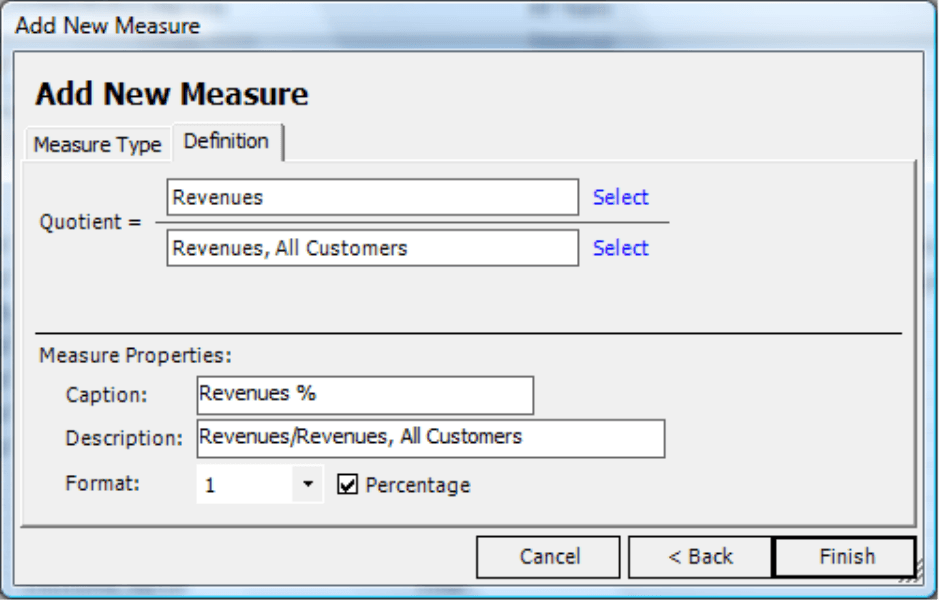
In the next step you will need to add another new measure. This time, however, it will be a Quotient measure to calculate the share you have in mind. To ensure that you can’t divide a number by zero, DeltaMaster will automatically add an “IIf()” statement to the MDX definition generated in the background.
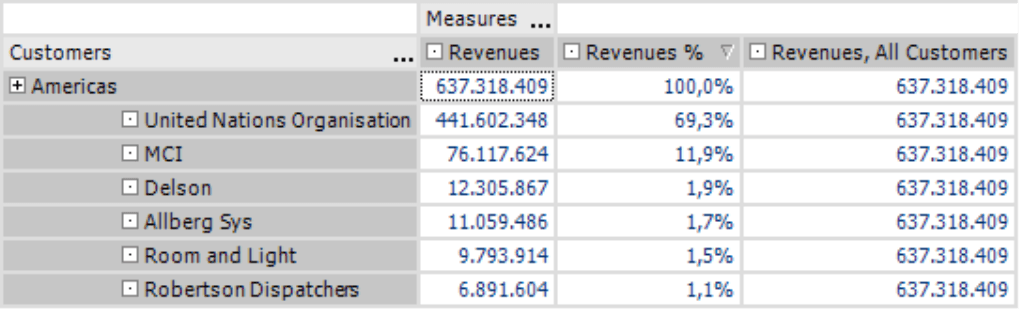
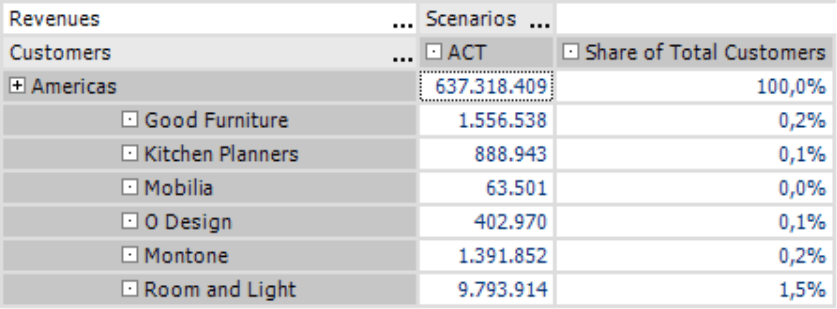
Using this method, you can clearly present revenues and the revenue percentage in a pivot table as seen in the screenshot on your right. In a real report, of course, you would not display the third column showing total sales. This was just included to illustrate the effect of the fixed filter.
Instead of using two measures, you could also create the same calculation using MDX in a user-defined measure. In this case, you wouldn’t need to use the total revenue sum as an interim measure.
This approach quickly leads you to the desired effect. Plus, you can reuse the new measure for other analyses, for example, a time-series analysis of the revenue percentage.
Calculated members
The previous example explained how you can create a percentage in reference to a certain measure. If you want to simultaneously compare the percentage of several members such as revenues, sales, material costs and production costs, you could add additional specialized measures. A faster, more effective alternative, however, would be to calculate the percentage as a calculated member. DeltaMaster will then be able to perform this calculation with any desired measure and, therefore, determine the percentage of the sum without having to define each one from scratch. This approach is similar to creating a budget-actual comparison – which must certainly also be valid for all measures.
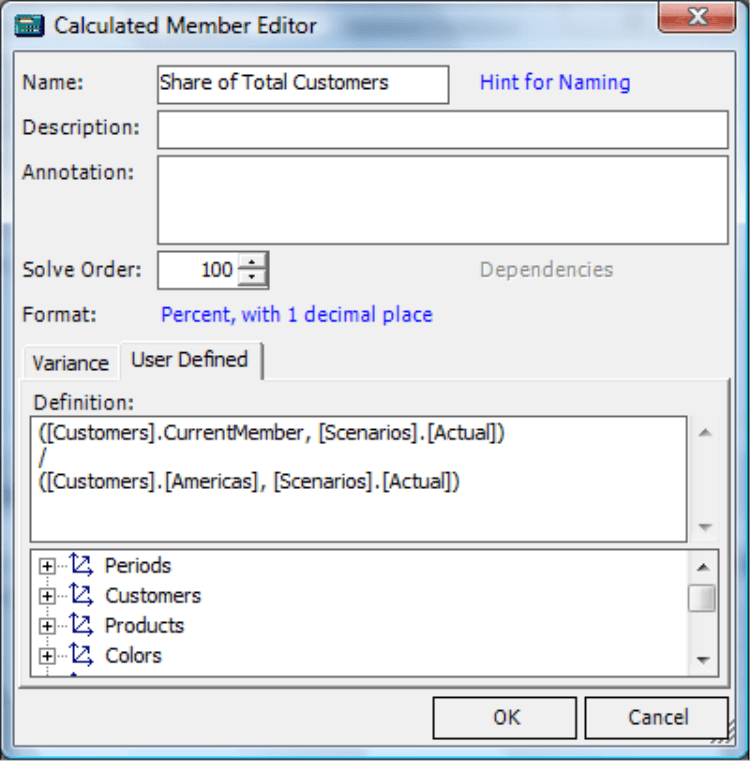
Ideally, you should start by creating a help dimension called “Percentage presentation” or something similar in your OLAP database. DeltaMaster then stores the calculated members in this axis. Alternatively, you can also use an existing dimension such as “Presentation” or “Value types”. Using the dimension browser, you can then add a user-defined calculated member using the following MDX expression:
([Customers].CurrentMember, [Scenarios].[Actual]) /
([Customers].[Americas], [Scenarios].[Actual])
This takes the values for the current selection in the customer dimension (“[Customers].CurrentMember“) for all of the relevant measures and divides them by the values for the top element (“[Customers].[Americas]“). The operands are listed as a tuple in combination with a reference member. In the MDX example on your right, however, we have “misused” the member (“[Scenarios].[Actual]“ ) that we also use for budget-actual variances. As a result, we cannot combine percentage views with budget-actual variances. For this reason, if you frequently work with percentage calculations, you should create a separate dimension for these members in the data model.
Since pivot tables use this method to calculate percentages, you can analyze the measures without taking any further actions; the calculation is based on the measures. Only the relation to the dimension must be defined so that DeltaMaster can recognize where it should calculate the percentage.
To be 100% correct, you should also protect the MDX expression from an unintentional division by zero. The expression would then be:
IIf( ([Customers].[Americas], [Scenarios].[Actual]) = 0, Null,
([Customers].CurrentMember, [Scenarios].[Actual]) / ([Customers].[Americas], [Scenarios].[Actual]) )
An interesting alternative would be to calculate the percentage of the next highest member, for example, to show the relevance that a single customer has in its region or the percentage that the region has in the entire market. To do this, you only need to make a slight change in the expression:
([Customers].CurrentMember, [Scenarios].[Actual]) / ([Customers].CurrentMember.Parent, [Scenarios].[Actual])
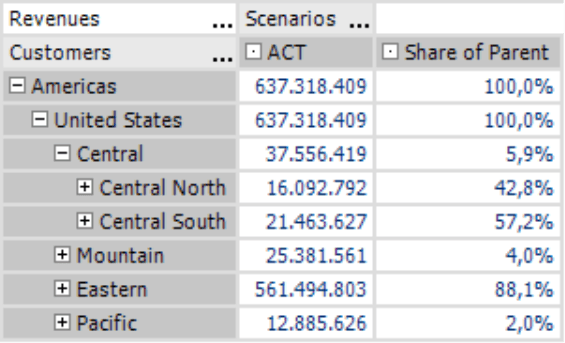
Now, take a look at the report on your right. Central North comprises 42.8 % of the Central region which, in turn, makes up 5.9 % of the total revenues on the US market.
Since the top member has no parent by nature, you have to treat it differently in the named expression. In that case, it would be better to write:
([Customers].CurrentMember, [Scenarios].[Actual]) / IIf([Customers].CurrentMember.Level.Ordinal > 0, ([Customers].CurrentMember.Parent, [Scenarios].[Actual]), ([Customers].CurrentMember, [Scenarios].[Actual]))
As you can see, you can (and should!) also include a zero check to this expression.
In general, if you want to use percentages in reports and analyses, calculated members give you the broadest range of flexibility.
Percentage columns in rankings
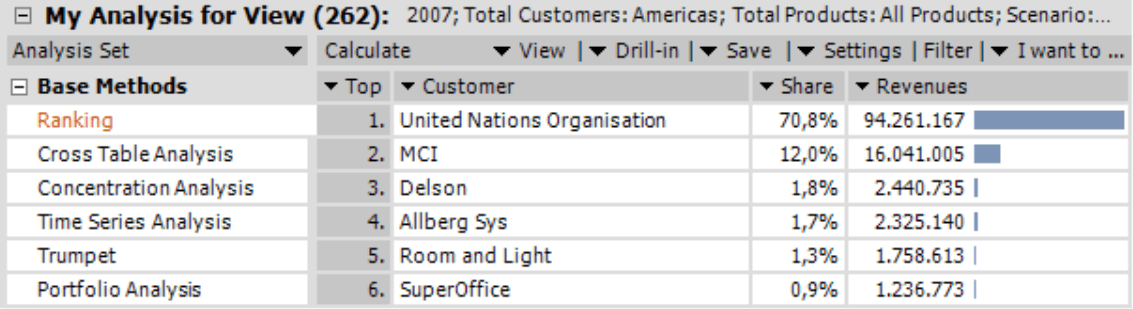
In some cases, however, it makes more sense to use a Ranking. Here, the results generally include a percentage column. Since DeltaMaster automatically calculates the percentage, you don’t have to do anything else. This alternative is especially useful when the sum does not have to be displayed or is shown somewhere else, for example, in a combination cockpit.
Calculation as a formula in a Flexreport
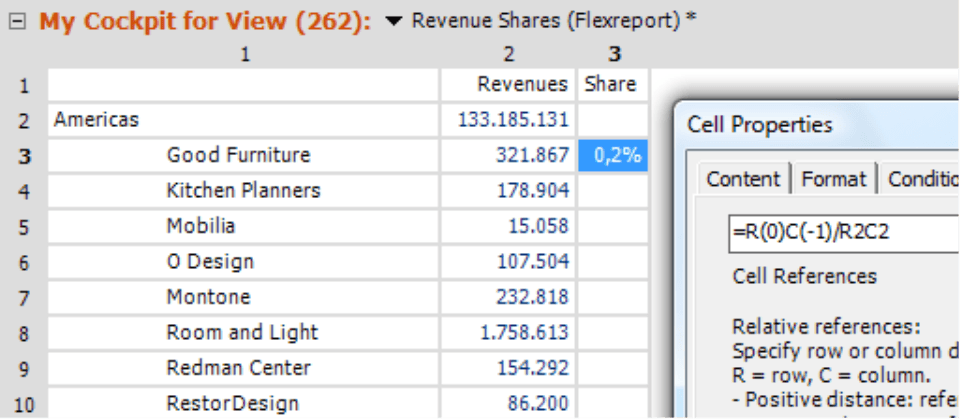
Using the formulas in a Flexreport, you can calculate percentages just as you would in a spreadsheet. Before you start, you may wish to display the Cell coordinates (context menu, I want to… menu) so that you can recognize the address of the cells that should be used more easily. Now you can edit the Cell properties (context menu) for the cells in which the percentage value should be displayed. On the Content tab, now select the Formula option; on the Formula tab, type the division expression.
The screenshot on your right uses relative and absolute referencing. Due to the parentheses, DeltaMaster will interpret the first part (”=R(0)C(?1)/R2C2“) relatively. This expression references the cells that are in the same row and to the left-hand side of the current column. (“R(0)“ equals a row with a gap of 0 while“C(?1)“ equals a column with a gap of ?1). Since the second part of the expression (”R2C2“) does not contain parentheses, DeltaMaster reads these as absolute coordinates. If you define the cell content this way, you only need to enter the formula in a single cell of a column. Afterwards, you can copy the formula in the remaining cells of the percentage column. Simply highlight the cell, hit Ctrl + C, highlight the remaining cells, and then hit Ctrl + V. Since the sum cells contain absolute references, these remain constant after you copy and paste them. The single values, however, will be taken from the cells containing relative references on the left.
The easiest way to avoid zeros in the divisor is to use conditional formatting. When the value of a sum cell is zero, the content of the respective cell should be empty text.
Flexreport with cell references to a pivot table showing percentages
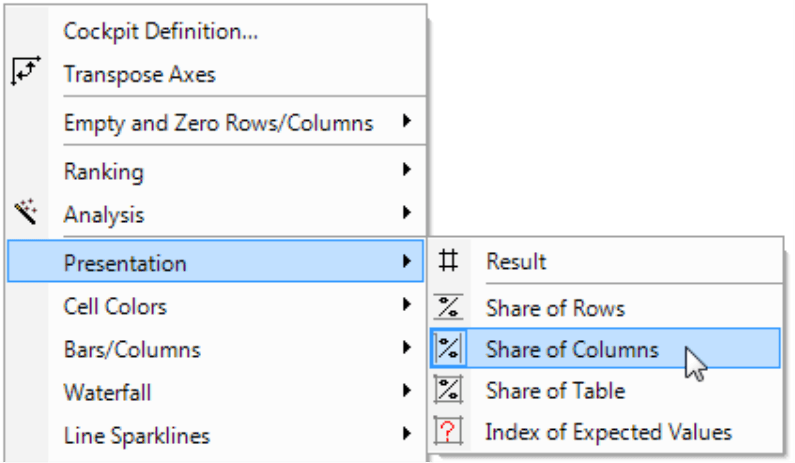
As of DeltaMaster 5.3.5, you now have an additional way to create percentage columns (or rows) in Flexreports (see DeltaMaster deltas! 5.3.5, feature #8 for more information). When you activate the Presentation option in a pivot table, you can either display the actual values (i.e. the Result of the database query) or their percentage share of the table’s rows, columns or total sum. If you save a pivot table containing a Presentation with percentages and then later reference these cells in a Flexreport, DeltaMaster will also include the Presentation in the Flexreport.
Please note that DeltaMaster draws on all values of the rows, column or table to calculate percentages – and even aggregates such as the subtotal or the total sum. Since the members that you want to examine should all be on the same level, please ensure that there are not subtotals or other aggregates. Although the results would be correct, at a first glance they could be irritating. You can do this quickly by performing a Drill across in the context menu of the row and column headlines. Alternatively, you can enter the desired level using the Level selection feature located in the Axis definition.
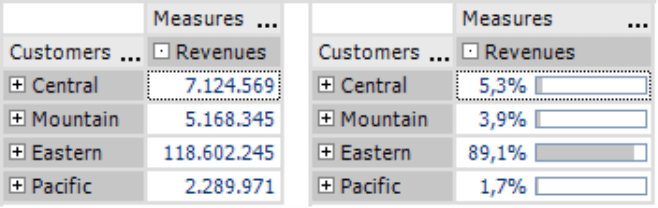
The screenshot on your right shows two pivot tables which are now on the “Customer region” level. One contains absolute values (standard view) while the other contains percentage values due to a change in the Presentation options. In the second table we also displayed 100-percent bars which visualize the relationship as well (see DeltaMaster deltas! 5.3.1, feature #25).
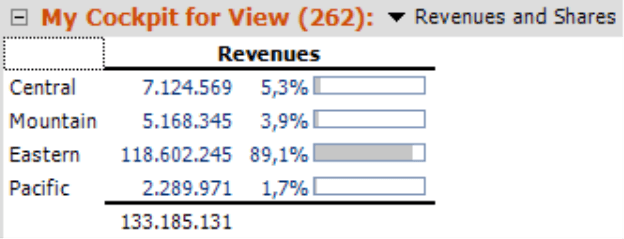
You can now combine both of these cockpits into a Flexreport. Simply start with the percentage presentation and then change it into a Flexreport with cell references (Change menu in the My cockpit window). DeltaMaster will then transfer the percentage values and the bars into the report. The absolute values, however, are still missing. To integrate these, simply Add [additional] columns and then Add references to the result cockpit. Both of these options are located in the context menu of the Flexreports. After a few format changes, your report looks similar to the one above in which the absolute values and percentages stand next to each other.
Questions? Comments?
Just contact your Bissantz team for more information!
